
Article Figures & Data
Figures
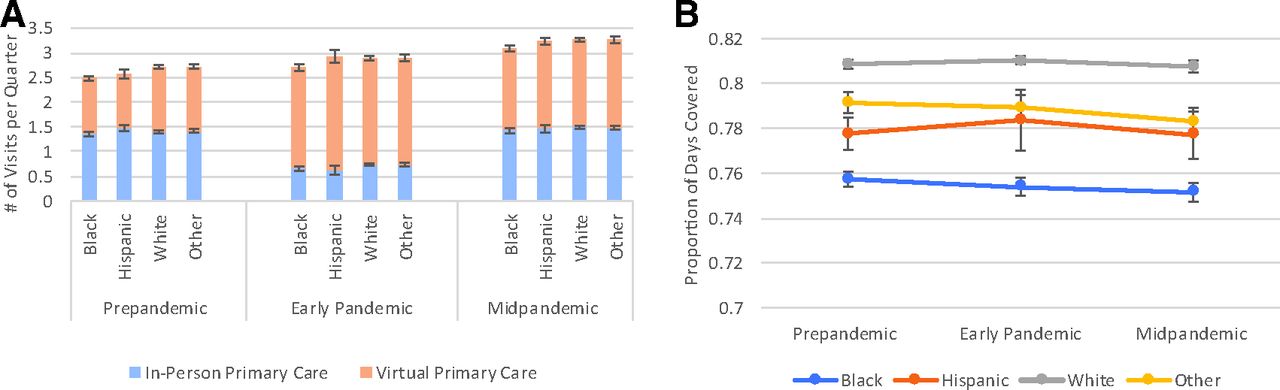
- Figure 1.
Mean adjusted primary care visits (A) and medication adherence (B) in high-risk patients by race/ethnicity. In A, blue/orange bars show mean number of primary care visits per patient per quarter estimated from regression models. In B, adherence was measured by proportion of days covered, ranging from 0 to 1.0, per patient per quarter and estimated from regression models. Mean visits and adherence per quarter were estimated from linear regression models adjusting for age-group and pandemic phase and their interaction terms, quarter, patients’ sociodemographic characteristics, Elixhauser comorbidity, comorbid depression, distance to primary care site, rurality, clinic factors, and community rate of COVID infections.
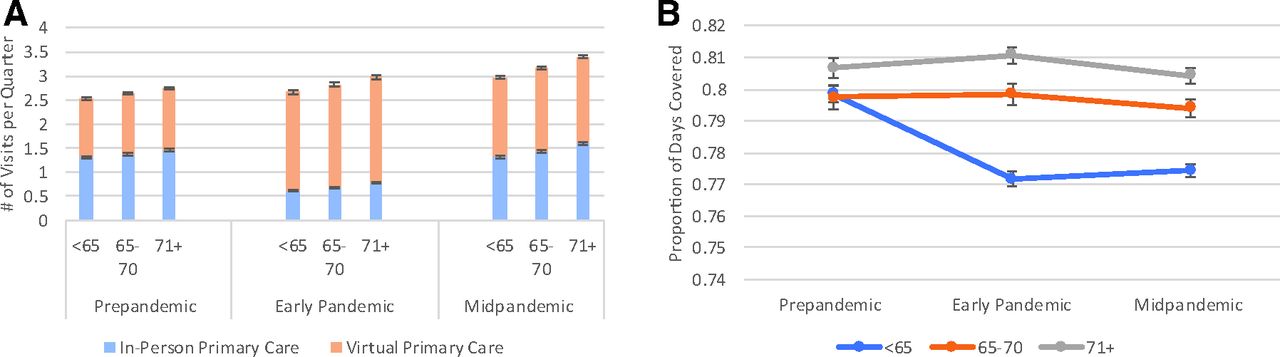
- Figure 2.
Mean adjusted primary care visits (A) and medication adherence (B) in high-risk patients by age group. In A, blue/orange bars show mean number of primary care visits per patient per quarter estimated from regression models. In B, adherence was measured by proportion of days covered, ranging from 0 to 1.0, per patient per quarter and estimated from regression models. Mean visits and adherence per quarter were estimated from linear regression models adjusting for age-group and pandemic phase and their interaction terms, quarter, patients’ sociodemographic characteristics, Elixhauser comorbidity, comorbid depression, distance to primary care site, rurality, clinic factors, and community rate of COVID infections.
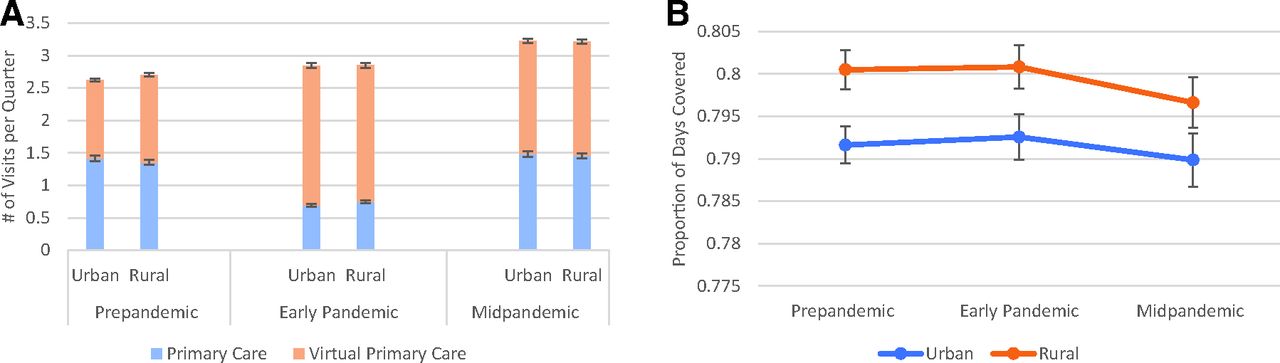
- Appendix 3.
Mean Adjusted Primary Care Visits (A) and Medication Adherence (B) in High-Risk Patients by Rurality. Mean visits and adherence per quarter were estimated from linear regression models adjusting for rurality and pandemic phase and their interaction terms, quarter, patients’ sociodemographic characteristics, Elixhauser comorbidity, comorbid depression, distance to primary care site, rurality, clinic factors, and community rate of COVID infections.


Tables
- Table 1.
Patient and Clinic Characteristics for High-Risk VA Patients with Diabetes, Fiscal Year 2019
Patient Characteristics, n = 188,569 N (%)/Mean (SD) Age Group <65 61,097 (32) 65 to 70 52,453 (28) 71+ 75,019 (40) Gender Male 179,134 (95) Female 9,435 (5) Race/ethnicity White 123,126 (65) Black 41,508 (22) Hispanic 13,016 (7) Other* 10,919 (6) Marital status Married 93,391 (50) Single/never married 19,380 (10) Divorced/separated 61,932 (33) Widowed 13,866 (7) Priority status 1 to 2: service-connected disability 30%+ 101,733 (54) 3 to 4: service-connected disability 10% to 20%/housebound 23,546 (12) 5 to 6: below VA means test/5 years postdischarge 57,033 (30) 7 to 8: above VA means test 6,257 (3) Drive time to nearest primary care site (in minutes) 21 (16) Rurality Rural 64,997 (34) Urban 123,572 (66) Comorbidities Sum of Elixhauser comorbid conditions 6.4 (3.0) Hypertension 176,426 (94) Hyperlipidemia 157,115 (83) Depression 72,273 (38) Diabetes medication drug class Alpha-glucosidase 1,656 (1) Biguanides 84,732 (45) Dipeptidyl-peptidase-4 inhibitors 19,686 (10) Glucagon-like peptide-1 agonist 14,874 (8) Meglitinides 41 (<1) Sodium-glucose co-transporter-2 (SGLT2) inhibitors 9,825 (5) Sulfonylureas 59,727 (32) Thiazolidinediones 6,828 (4) Clinic characteristics, n = 930 Average wait time for appointment (in days) 4.3 (2.8) Proportion of encounters provided by telephone 27% (10) Percent of patients with prior telehealth use 17% (6.8) ↵* Other includes Asian, Pacific Islander, American Indian, Alaska Native, and unknown race/ethnicity.
Abbreviations: VA, Veterans Affairs; SD, standard deviation.
- Table 2.
Mean Unadjusted VA Use by Pandemic Phase in High-Risk VA Patients with Diabetes, FY2019-2021, n = 188,569
Use Type Mean per Patient per Quarter (SD) Prepandemic Early Pandemic Midpandemic In-person primary care visits 1.48 (2.09) 0.66 (1.77) 1.27 (1.99) Virtual primary care visits 1.34 (2.03) 2.05 (2.72) 1.58 (2.30) Adherence to diabetes medications* 0.82 (0.25) 0.81 (0.27) 0.82 (0.26) Emergency department visits 0.22 (0.42) 0.16 (0.36) 0.17 (0.38) All-cause medical/surgical hospitalizations 0.10 (0.37) 0.07 (0.33) 0.08 (0.35) Hospitalizations for ambulatory care sensitive conditions 0.022 (0.15) 0.015 (0.12) 0.017 (0.13) Hospitalizations for diabetes complications 0.010 (0.10) 0.007 (0.08) 0.007 (0.09) ↵* Measured by the proportion of days covered.
Abbreviations: VA, Veterans Affairs; SD, standard deviation.
- Table 3.
Adjusted Differences in Use During Early and Midpandemic Phases Compared to Prepandemic Phase Among High-Risk VA Patients with Diabetes, n = 188,569
Use Type Mean Difference per Patient per Quarter (95% CI)* Early Pandemic Midpandemic In-person primary care visits −0.68 (−0.70, −0.66) 0.08 (0.05, 0.11) Virtual primary care visits 0.88 (0.84, 0.92) 0.49 (0.45, 0.53) Adherence to diabetes medications† 0.00 (−0.00, 0.00) −0.00 (−0.01, 0.00) Emergency department visits −0.22 (−0.24, −0.21) −0.03 (−0.06, 0.001) All-cause medical/surgical hospitalizations −0.23 (−0.28, −0.19) −0.02 (−0.06, 0.02) Hospitalizations for ambulatory care sensitive conditions −0.26 (−0.32, −0.20) −0.05 (−0.12, 0.02) Hospitalization for diabetes complications −0.002 (−0.002, −0.001) −0.000 (−0.000, 0.000) ↵* Mean difference was estimated from linear regression models adjusting for quarter, patients’ sociodemographic characteristics, Elixhauser comorbidity, comorbid depression, distance to primary care site, rurality, clinic factors, and community rate of COVID infections. A Poisson model was used to estimate emergency department visits, all-cause, and ACSC hospitalizations, whereas a logistic model was used to estimate hospitalization for diabetes complications.
† Measured by the proportion of days covered.
Abbreviations: CI, confidence interval; VA, veterans affairs; ACSC, ambulatory care-sensitive condition.
In-Person Primary Care Visits Virtual Primary Care Visits Adherence (Proportion of days covered) to Diabetes Medications All-Cause Emergency Department Visits All-Cause Medical/ Surgical Hospitalization Hospitalization for Ambulatory Care Sensitive Condition Hospitalization for Diabetes Domplications Coefficient Coefficient Coefficient IRR IRR IRR OR Quarter −0.05* −0.02* 0.003* 0.97* 0.99 0.99 0.98 (0.002) (0.002) (0.000) (0.002) (0.011) (0.029) (0.006) Pandemic phase Prepandemic phase Ref Ref Ref Ref Ref Ref Ref Early pandemic phase −0.68* 0.88* 0.001 0.80* 0.79* 0.77* 0.77* (0.011) (0.021) (0.0001) (0.006) (0.018) (0.023) (0.027) Midpandemic phase 0.08* 0.49* −0.003 0.97* 0.98 0.95 0.99 (0.015) (0.019) (0.002) (0.014) (0.019) (0.034) (0.048) Patient factors Age group <65 years Ref Ref Ref Ref Ref Ref Ref 65 to 70 years 0.07* 0.06* 0.02* 0.85* 0.85* 0.79 0.62* (0.007) (0.008) (0.001) (0.034) (0.021) (0.332) (0.016) 71+ years 0.19* 0.10* 0.03* 0.83* 0.82* 0.75 0.49* (0.008) (0.009) (0.001) (0.013) (0.025) (0.372) (0.013) Gender Female Ref Ref Ref Ref Ref Ref Ref Male 0.23* −0.24* 0.01* 0.92 1.17 1.36 1.53* (0.016) (0.022) (0.002) (0.033) (0.083) (0.314) (0.081) Race/ethnicity White Ref Ref Ref Ref Ref Ref Ref Black −0.07* −0.15* −0.05* 1.20* 0.95 1.13 1.07 (0.019) (0.022) (0.002) (0.066) (0.048) (0.079) (0.032) Hispanic 0.01 −0.10* −0.03* 1.26* 1.09 1.04 1.10 (0.028) (0.025) (0.004) (0.077) (0.050) (0.279) (0.047) Other 0.01 −0.004 −0.02* 1.01 1.00 1.03 1.02 (0.014) (0.020) (0.002) (0.024) (0.056) (0.107) (0.049) Drive time to primary care (in miles) −0.004* −0.002* <0.001 1.00 1.00 1.00 1.00 (0.0003 (0.0005) <0.001 (0.001) (0.001) (0.002) (0.001) Rural/urban residence Urban Ref Ref Ref Ref Ref Ref Ref Rural 0.051* 0.10* 0.01* 0.77* 0.90* 0.89 0.83* (0.019) (0.026) (0.002) (0.041) (0.041) (0.142) (0.026) Marital status Currently married Ref Ref Ref Ref Ref Ref Ref Divorced/separated −0.001 −0.05* −0.02* 0.97 1.03 1.13* 1.22* (0.007) (0.008) (0.001) (0.020) (0.031) (0.037) (0.028) Single, never married 0.020 −0.10* −0.02* 0.99 1.06 1.17 1.39* (0.011) (0.013) (0.002) (0.019) (0.028) (0.252) (0.044) Widowed 0.12* 0.02 −0.01* 1.00 1.05 1.12 1.25* (0.015) (0.016) (0.002) (0.039) (0.040) (0.083) (0.048) VA enrollment priority Group 1 to 2 Ref Ref Ref Ref Ref Ref Ref Group 3 to 4 0.12* 0.10* −0.01* 1.05 1.12 1.16 1.20* (0.012) (0.013) (0.002) (0.021) (0.089) (0.139) (0.039) Group 5 to 6 −0.005 −0.09* −0.02* 1.07 1.17 1.31 1.33* (0.007) (0.009) (0.001) (0.027) (0.109) (0.459) (0.033) Group 7 to 8 −0.04 −0.05 −0.01* 1.01 1.10 1.29 1.23* (0.016) (0.020) (0.003) (0.028) (0.072) (0.246) (0.072) Elixhauser comorbidity score 0.11* 0.10* −0.001* 1.16* 1.36 1.42 1.35* (0.005) (0.003) (<0.001) (0.028) (0.179) (0.751) (0.005) Comorbid depression 0.09* 0.10* −0.02* 0.96 0.75 0.69 0.81* (0.008) (0.009) (0.001) (0.020) (0.139) (0.339) (0.019) Clinic factors Clinic appointment wait time −0.004 0.013 <−0.001 1.01 0.98* 0.98 0.99 (0.014) (0.016) (0.001) (0.002) (0.007) (0.034) (0.020) Clinic ratio of telephone encounters −0.03* 0.28* 0.001 1.04 1.01 1.03 1.04* (0.011) (0.018) (0.001) (0.016) (0.026) (0.075) (0.017) Clinic use of telehealth 0.014 −0.042* <−0.001 0.98 0.99* 0.99 0.98 (0.013) (0.015) (0.001) (0.009) (0.004) (0.019) (0.018) County rate of COVID-19 0.06* −0.05* −0.003* 1.02* 1.02 1.00 1.01 (0.003) (0.005) (0.0003) (0.005) (0.013) (0.041) (0.009) Outcomes for primary care use and adherence were estimated from linear regression models adjusting for quarter, patients’ sociodemographic characteristics, Elixhauser comorbidity, comorbid depression, distance to primary care site, rurality, clinic factors, and community rate of COVID infections. A Poisson model was used to estimate emergency department visits, all-cause, and ambulatory care-sensitive condition hospitalizations, whereas a logistic model was used to estimate hospitalization for diabetes complications. All results have standard errors reported in parentheses.
*P < .01.
Abbreviations: IRR, incidence rate ratio; VA, veterans affairs; OR, odds ratio.
- Appendix 2.
Mean Adjusted Number of Emergency Department Visits/Hospitalizations per Quarter in High-Risk Patients by Race/Ethnicity, Age Group, and Rurality
Acute Care Type Mean per Patient per Quarter (SD) Prepandemic Early Pandemic Midpandemic Emergency department visits Race/ethnicity White 0.19 0.16 0.19 Black 0.23 0.18 0.23 Hispanic 0.24 0.19 0.24 Other 0.20 0.16 0.19 Age group <65 0.23 0.18 0.21 65 to 70 0.20 0.16 0.20 71+ 0.19 0.16 0.20 Rurality Rural 0.17 0.14 0.18 Urban 0.22 0.18 0.22 All-cause medical/surgical hospitalizations 0.10 0.07 0.08 Race/ethnicity White 0.10 0.08 0.10 Black 0.09 0.08 0.10 Hispanic 0.11 0.09 0.10 Other 0.10 0.08 0.10 Age group <65 0.11 0.09 0.10 65 to 70 0.09 0.08 0.10 71+ 0.09 0.07 0.09 Rurality Rural 0.09 0.07 0.09 Urban 0.10 0.08 0.10 Hospitalizations for ambulatory care sensitive conditions Race/ethnicity White 0.02 0.02 0.02 Black 0.02 0.02 0.02 Hispanic 0.02 0.02 0.02 Other 0.02 0.02 0.02 Age group <65 0.03 0.02 0.02 65 to 70 0.02 0.02 0.02 71+ 0.02 0.01 0.02 Rurality Rural 0.02 0.02 0.02 Urban 0.02 0.02 0.02 Hospitalization for diabetes complications 0.010 0.007 0.007 Race/ethnicity White 0.009 0.007 0.009 Black 0.010 0.007 0.009 Hispanic 0.010 0.008 0.009 Other 0.009 0.007 0.009 Age group <65 0.014 0.010 0.012 65 to 70 0.008 0.007 0.009 71+ 0.007 0.006 0.007 Rurality Rural 0.008 0.007 0.010 Urban 0.010 0.007 0.010 Mean number of hospitalizations and ED visits were estimated from Poisson regression models adjusting for race/ethnicity, age group, and rurality and pandemic phase and their interaction terms, quarter, patients’ sociodemographic characteristics, Elixhauser comorbidity, comorbid depression, distance to primary care site, clinic factors, and community rate of COVID infections. Hospitalizations for diabetes complications were estimated using a logistic model.
Abbreviations: ED, emergency department; SD, standard deviation.


