
Article Figures & Data
Figures
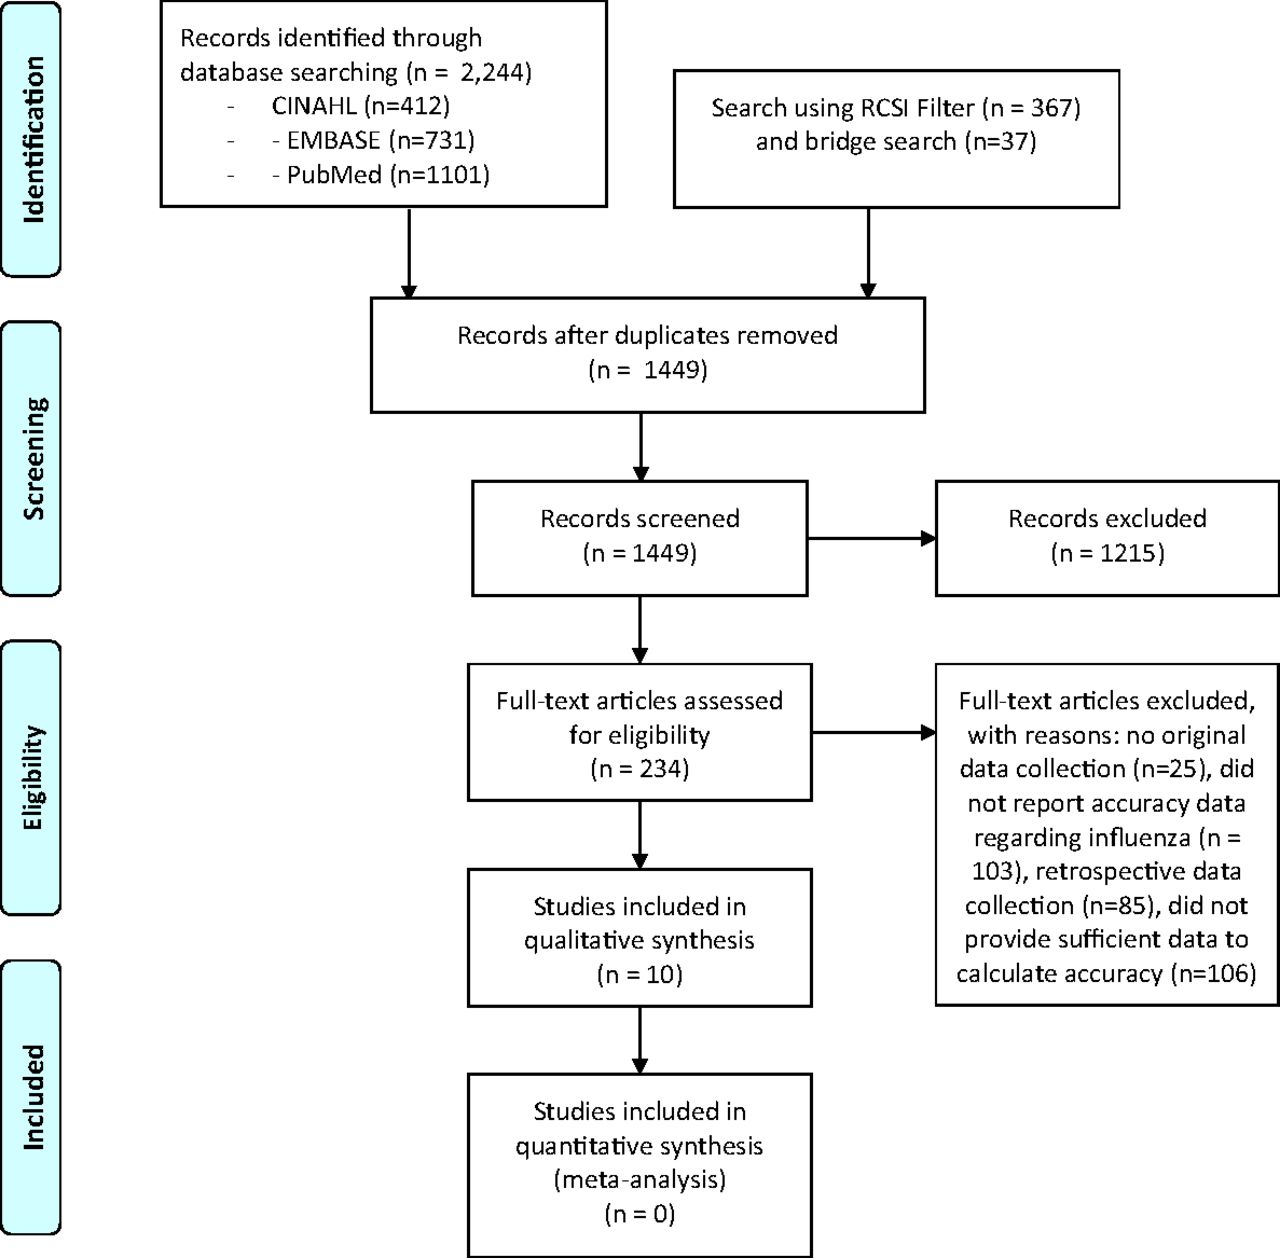
- Figure 1.
PRISMA diagram describing the search.
Tables
- Table 1.
Characteristics of Included Studies That Develop or Validate Clinical Prediction Rules for Influenza
Study No. of Patients Mean Age (Years) Population Studied Flu Strain Reference Std Country (Year) Afonso, 2012* 456 Swiss: 34.3
US: 38.8Swiss: Adult outpatients with ILI
US: adult outpatients with acute RTI symptomsA + B Swiss: Culture
US: PCRSwitzerland (1999 to 2000), US (2002) Ebell, 2012*,† 456 Swiss: 34.3
US: 38.8Swiss: Adult outpatients with ILI
US: adult outpatients with acute RTI symptomsA + B Swiss: Culture
US: PCRSwitzerland (1999 to 2000), US (2002) Anderson, 2018 4572 10.7 Patients > 6 months of age with fever and cough or sore throat, presenting within 3 days if outpatient and within 5 days if in-patient A + B PCR Thailand (2009 to 2014) Dugas, 2019 1941 48.6 An ED patient who reported 1 or more of the following: measured fever >100.4°F, subjective fever, cough, nasal congestion, sinus congestion, rhinorrhea, sore throat, or shortness of breath NR PCR US (2013 to 2014) Govaert, 1998 1791 Range: 60–91 Adults aged 60 or older presenting to GP with ILI
Patients with heart, lung, kidney disease, or diabetes excludedNR Serology Netherlands (1991 to 1992) Ranjan, 2012 638 46.4 Travelers quarantined in an airport during swine flu outbreak with ILI A PCR India (2009) van Vugt, 2015† 1801 48 Adult outpatients and older with clinical presentation of LRTI, symptom onset < 7 days A + B PCR 12 European countries (2007 to 2010) Vuichard-Gysin, 2019 2191 NR Children and adults of Canadian Hutterite communities with ARTI defined as at least 2 of: chills, cough, earache, fatigue, fever, headache, myalgias, coryza, or sore throat A + B PCR Canada (2008 to 2011) Woolpert, 2012 789 31.2 Outpatients with subjective fever and/or temperature >38.0°C, plus cough or sore throat A + B PCR US (2007 to 2008) Zimmerman, 2016 4173 34.1 Outpatients > 6 months of age, seeking care for ARTI with cough or fever A + B PCR US (2011 to 2012) ARTI, acute respiratory tract infection; ED, emergency department; GP, general practice; ILI, influenza-like illness; LRTI, lower respiratory tract infection; NR, not reported; PCR, polymerase chain reaction; RTI, respiratory tract infection; Std, standard; US, United States.
↵* These studies used the same dataset but different methods for generating a clinical prediction rule.
↵† The FluScore was developed in the study by Ebell and colleagues and validated in the study by van Vugt and colleagues.
- Table 2.
Evaluation of Study Quality Using the QUADAS-2 Framework for Studies of Influenza Clinical Prediction Rules
Study, Year Patient Selection Index Test Reference Std Flow and Timing Overall 1 2 3 4 5 6 7 8 9 10 11 12 13 14 15 16 17 Consecutive Not Case Control or Retrospective-Cohort Exclusion Criteria Risk of Bias Applicability Index Blinded Threshold Pre-Specified Risk of Bias Applicability PCR Used for Some or All Patients Reference Blinded Risk of Bias Applicability All Got Reference Std All Got Same Ref Std All Accounted Risk of Bias Anderson, 2018 Y Y Y L N Y Y L L Y U L L Y Y Y L L Ranjan, 2012 Y Y Y L N Y Y L L Y U L L Y Y Y L L van Vugt, 2015 Y Y Y L N Y Y L L Y Y L L Y Y Y L L Vuichard-Gysin, 2019 Y Y Y L N Y Y L L Y U L L Y Y Y L L Woolpert, 2012 Y Y Y L N Y Y L L Y U L L Y Y Y L L Zimmerman, 2016 Y Y Y L N Y Y L L Y U L L Y Y Y L L Afonso, 2012 Y Y Y L N Y Y L L Y U L L Y N Y H M Ebell, 2012 Y Y Y L N Y Y L L Y U L L Y N Y H M Dugas, 2019 Y Y Y L N Y Y L L Y U L L Y Y N H M Govaert, 2013 Y Y Y L N Y Y L L N U H L Y Y Y L M H, High; L, Low; M, Moderate; N, No; PCR, polymerase chain reaction; Std, standard; U, Uncertain; Y, Yes.
- Table 3.
Predictor Variables Included in Each Influenza Risk Score or Classification and Regression Tree (CART) Model
Study, Year Cough Fever Chills or Sweats Myalgia Acute Onset Coryza Sore Throat Age Headache Fatigue or malaise Sneezing Flu in community Close Contact Sex Sinus Problems Afonso, 2012 × × × × Afonso, 2012 × × Afonso, 2012 × × Anderson, 2018 × × × × × Dugas, 2019 × × × Ebell, 2012 (FluScore) × × × × × Govaert, 1998 × × × × × × × × Ranjan, 2012 × × × × × × × Vuichard-Gysin, 2019 (children) × × × × × Vuichard-Gysin, 2019 (children) × × × × Vuichard-Gysin, 2019 (adults) × × × × × Vuichard-Gysin, 2019 (adults) × × × Woolpert, 2012 × × × × Zimmerman, 2016 × × × Number of models: 12 11 9 7 4 3 3 2 2 2 1 1 1 1 1 Study or Dataset Type of Validation and Number of Patients AUROCC Overall Prevalence of Flu % Flu and LR by Risk Group (Derivation) % Flu and LR by Risk Group (Validation) % of Patients in Each Risk Group FluScore risk score Ebell, 2012 Split sample internal: derivation n = 326, validation n = 133 0.79 * 34.2% Low: 9.2%, LR 0.20 Low: 5.0%, LR 0.10 Low: 32.5% * Mod: 27.8%, LR 0.76 Mod: 35.9%, LR 1.02 Mod: 28.1% High: 59.1%, LR 2.83 High: 57.4%, LR 2.47 High: 39.4% van Vugt, 2015 (flu season) Prospective external: n = 505 0.71 † 23.6% NA Low: 13.6%, LR 0.51 Low: 60% ‡ Mod: 32.1%, LR 1.53 Mod: 27% High: 50.0%, LR 3.24 High: 14% Classification and Regression Tree (CART) models Afonso, 2012: Model 1 Split sample internal: derivation n = 322, validation n = 134 0.82/0.80 * 34.2% Low: 5.6% flu, LR 0.12 Low: 8%, LR 0.15 Low: 21% * Mod: 29% flu, LR 0.83 Mod: 37%, LR 0.98 Mod: 62% High: 78% flu, LR 7.2 High: 82%, LR 7.8 High: 17% Afonso, 2012: Model 2 Split sample internal: derivation n = 322, validation n = 134 0.75/0.76 * 34.2% Low: 5.6% flu, LR 0.12 Low: 8%, LR 0.15 Low: 21% * Mod: 18% flu, LR 0.44 Mod: 18%, LR 0.37 Mod: 30% High: 55% flu, LR 2.4 High: 62%, LR 2.7 High: 49% Afonso, 2012: Model 3 Split sample internal: derivation n = 322, validation n = 137 0.76/0.77 * 34.2% Low: 7.5% flu, LR 0.16 Low: 3%, LR 0.06 Low: 24% * Mod: 26% flu, LR 0.72 Mod: 34%, LR 0.89 Mod: 46% High: 63% flu, LR 3.4 High: 70%, LR 3.9 High: 30% Anderson, 2018 Prospective internal: derivation n = 3782 (2009 to 2013),validation n = 790 (2014) 0.69 * 32.7% Low: 21.9% flu, LR 0.52 Low: 20.2% flu, LR NR Low: 71% † High: 59.7% flu, LR 2.73 High: 63.8%, LR NR High: 29% Vuichard-Gysin, 2019 (children) Split sample internal: derivation n = 819, validation n = 422 0.77/0.74 $ 12.3% Low: 8% flu, LR 4.5 Low: 8%, LR 0.72 Low: 88.6% † High: 36% flu, LR 4.5 High: 34%, LR 4.3 High: 11.4% Vuichard-Gysin, 2019 (adults) Split sample internal: derivation n = 627, validation n = 323 0.80/0.75 $ 7.1% Low 4% flu, LR 0.59 Low: 5%, LR 0.68 Low: 89.3%† High 30% flu, LR 5.8 High: 26%, LR 4.6 High: 10.7% Zimmerman, 2016 Split sample internal: derivation n = 2087, validation n = 2086 0.68/0.69 $ 15.4% Low: 6% flu, LR 0.33 Low 5% 43% * High: 23% flu, LR 1.63 High: 23% 57% Other risk scores Dugas, 2019 Split sample internal: derivation n = 1553, validation n = 388 NR 9.4% Low (0 to 2): 1.5%, LR 0.16 Low (0 to 2): 3.3%, LR 0.25 Low: 33.4% * High (3+): 12.5%, LR 1.48 High (3+): 16.2%, LR 1.40 High: 66.6% Govaert, 1998 (post hoc) None, derivation only,n = 1791 NR 6.8% Low (0): 3.2%, LR 0.46; NA Low: 64.5%† Mod (1 to 2): 6.2%, LR 0.91 Mod: 8.1% High (≥ 3): 15%, LR 2.49 High: 27.4% Ranjan, 2012 None, derivation only,n = 638 NR 19.9% Low (0 to 6): 4% NA NR High (7+): 64% Vuichard-Gysin, 2019 (children) Split sample internal: derivation n = 819, validation n = 422 0.76/0.70 $ 12.3% Low (0 to 4): 6% flu, LR 0.53 Low (0 to 4): 7%, LR 0.59 Low: 80.1% * High (5+): 31% flu, LR 3.7 High (5+): 28%, LR 3.1 High: 19.9% Vuichard-Gysin, 2019 (adults) Split sample internal: derivation n = 627, validation n = 323 0.78/0.79 $ 7.1% Low (0 to 3): 6% flu, LR 0.59; Low (0 to 3): 5%, LR 0.67 Low: 94.2% * High (4+): 34% flu, LR 5.8 High (4+): 26%, LR 4.8 High: 5.8% Woolpert, 2012 (original) None, derivation only,n = 523 NR 30.0% 0 pts: 0.0%, LR 0.0 NA 0 pts: 0.6% * 1 pts: 10.1%, LR 0.26 1 pt: 15.1% 2 pts: 20.9%, LR 0.62 2 pts: 53.0% 3 pts: 50.0%, LR 2.33 3 pts: 26.0% 4 pts: 82.1%, LR 10.7 4 pts: 5.4% Woolpert, 2012 (post hoc) None, derivation only,n = 523 NR 30.0% Low (0 to 1): 9.8%, LR 0.25 NA Low: 15.7% * Mod (2): 20.9%, LR 0.61 Mod: 53.0% High (3+): 55.5%, LR 2.87 High: 31.4% Study Risk Score or CART model Afonso, 2012 CART model 1
Fever, chills or sweats, duration < 2 days, coughAfonso, 2012 CART model 2
Fever, chills, sweatingAfonso, 2012 CART model 3
Fever, myalgiaAnderson, 2018 CART modelAge ≥ 5 years, cough, coryza, chills, myalgia Dugas, 2019 Risk score
2 points for new or increased cough, 1 point for headache, 1 point for subjective fever, and 1 point for measured temperature > 100.4 F.
Low-risk group: 0 to 2 points
High-risk group: ≥ 3 pointsEbell, 2012 Risk score (“FluScore”)
2 points for fever and cough, 2 points for myalgias, 1 point for chills or sweats, and 1 point for duration < 2 days
Low-risk group: 0 to 2 points
Moderate risk group: 3 points
High-risk group: 4 to 6 pointsGovaert, 1998 Risk score (original)
1 point for each of the following 8 symptoms:
cough, fever, acute onset, malaise, rigor or chills, myalgia, headache, sore throat.
Probability of influenza is then reported for each point score.Govaert, 1998 Risk score (post hoc)
1 point for each of the following 8 symptoms: cough, fever, acute onset, malaise, rigor or chills, myalgia, headache, sore throat
Low-risk group: 0 points
Moderate risk group: 1 to 2 points
High-risk group: 3 + pointsRanjan, 2012 Risk score
1 to 3 points for different levels of fever, 1 point each for sneezing, coryza, sore throat, cough or wheeze, 1 point for flu circulating in community, and 2 points for close contact with confirmed flu.
Low-risk group: 0 to 6 points
High-risk group: ≥ 7 pointsVuichard-Gysin, 2019 (children) CART model
Fever, chills, cough, coryza, male sexVuichard-Gysin, 2019 (children) Risk score (children)
1 point for age 6 to 17 years, 2 points for chills, 2 points for cough, and 3 points for fever.
Low-risk group: 0 to 4 points
High-risk group: ≥ 5 pointsVuichard-Gysin, 2019 (adults) CART model
Chills, cough, myalgia, sinus problem, sore throatVuichard-Gysin, 2019 (adults) Risk score (adults)
2 points for chills, 2 points for cough, and 1 point for myalgias
Low-risk group: 0 to 3 points
High-risk group: ≥ 4 pointsWoolpert, 2012 Risk score (original)
1 point for each of the following 4 symptoms: acute onset, fever, cough, myalgia. Probability of influenza is then reported for each point score.Woolpert, 2012 Risk score (post hoc)
1 point for each of the following 4 symptoms: acute onset, fever, cough, myalgia
Low-risk group: 0 to 1 points
Moderate risk group: 2 points
High-risk group: 3 + pointsZimmerman, 2016 CART model
Fever, cough, fatigueCART, Classification and Regression Tree.
In this issue


Jump to section
- Article
- Abstract
- Introduction
- Methods
- Results
- Discussion
- Appendix 1. Search for Diagnosis of Influenza Using the History and Physical Examination
- Appendix 2. Search for clinical prediction rules using RCSI filter1
- Appendix 3. Definitions used for QUADAS-2 framework for quality assessment
- Appendix 4. Clinical Prediction Rules Included in the Systematic Review
- Notes
- References
- Figures & Data
- References
- Info & Metrics
Related Articles
Cited By...
- Accuracy of individual signs and symptoms and case definitions for the diagnosis of influenza in different age groups: a systematic review with meta-analysis
- Use of Patient-Reported Symptom Data in Clinical Decision Rules for Predicting Influenza in a Telemedicine Setting
- Research on the Issues Family Physicians Face Today: Controlled Substances, COVID-19, Hypertension, and "Slow Medicine," Among Many More Topics