
Article Figures & Data
Figures
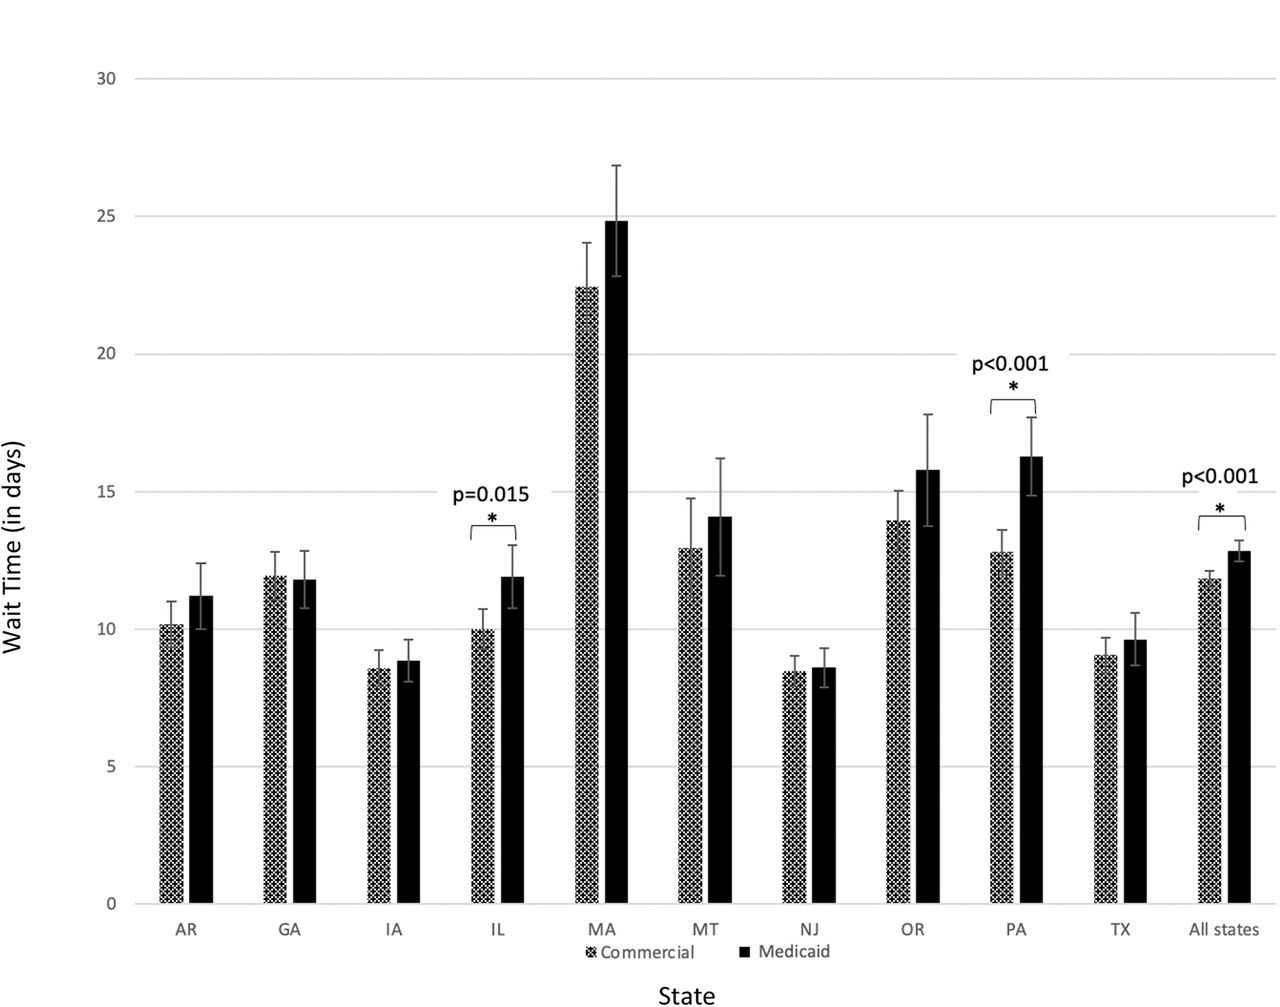
- Figure 1.
Distribution of Wait Times (in Days) by State and Insurance Type in 2012, 2014, and 2016. An asterisk indicates a two-sample t-test showed a statistically significant difference between categories (P < 0.05). The P value is indicated above the bars.

Tables
MedicaidMean (SD) CommercialMean (SD) Wait time (in days) 13.0 (19.3) 11.8 (17.2) Hypertensive 0.50 (0.50) 0.51 (0.50) FQHC 0.01 (0.29) 0.05 (0.21) ACO 0.34 (0.47) 0.35 (0.48) IHS 0.37 (0.48) 0.32 (0.47) HHI Index 0.17 (0.20) 0.15 (0.17) Medicaid beneficiaries per 1000 220.0 (75.6) 196.2 (73.2) Per capita income (in 1000s) 51.0 (13.87) 53.07 (14.59) PCPs per 10,000 0.75 (0.32) 0.79 (0.32) ACPs per 10,000 1.08 (0.61) 1.05 (0.56) FQHCs per 1000 0.14 (0.31) 0.12 (0.24) Percent urbanized 77.3% 80.1% (28.0%) (24.6%) Number of calls 5726 8740 This table includes summary statistics of three waves of experimental data from a multiyear simulated patient study (2012, 2014, 2016), as separated by insurance type of simulated patient. The definition for how hypertension is measured is a binary variable with 0 = no hypertension and 1 = hypertension.
ACO, accountable care organization; ACPs, advanced care practitioners; FQHC, Federally Qualified Health Center; HHI, Herfindahl-Hirschman Index; IHS, integrated health system; PCPs, primary care providers (MDs and DOs); SD, standard deviation.
- Table 2.
Predictors of the Number of Days to Primary Care Appointments for Medicaid versus Commercially Insured Simulated Patients
Medicaid Commercial Coef. (95% CI) P Value Coef. (95% CI) P Value Hypertension −3.62 (−4.74, −2.50) <0.001 −4.50 (−5.41, −3.60) <0.001 FQHC flag 4.48 (2.09, 6.87) <0.001 3.22 (1.25, 5.19) 0.001 ACO indicator 1.74 (0.14, 3.35) 0.033 1.20 (0.23, 2.16) 0.015 IHS indicator 5.73 (4.30, 7.15) <0.001 4.04 (2.96, 5.13) <0.001 HHI index −2.30 (−5.93, 1.32) 0.212 −0.19 (−3.38, 3.01) 0.909 # Medicaid beneficiaries per 1000 −0.014 (−0.03, −0.00) 0.040 −0.004 (−0.01, 0.00) 0.355 Per capita income (in 1000s) −0.11 (−0.24, 0.01) 0.081 −0.09 (−0.15, −0.03) 0.002 PCPs per 10,000 −4.13 (−7.75, −0.51) 0.025 −0.39 (−2.95, 2.16) 0.762 ACPs per 10,000 1.57 (−1.41, 4.55) 0.302 0.92 (−1.03, 2.87) 0.355 FQHCs per 1000 −1.44 (−2.63, −0.26) 0.017 −1.29 (−3.07, 0.50) 0.158 Percent urban 5.20 (1.34, 9.05) 0.008 2.82 (0.67, 5.57) 0.045 Quarter 2 −0.21 (−3.22, 2.79) 0.889 0.63 (−2.23, 3.48) 0.668 Quarter 3 2.25 (−2.20, 6.70) 0.322 3.66 (−3.59, 10.92) 0.322 Quarter 4 1.51 (0.12, 2.90) 0.033 1.43 (0.42, 2.43) 0.045 2014 1.03 (−2.01, 4.07) 0.506 0.73 (−2.29, 3.76) 0.635 2016 2.20 (0.96, 3.44) 0.001 2.51 (1.46, 3.57) <0.001 Intercept 16.06 (8.08, 24.03) <0.001 11.69 (7.43, 15.95) <0.001 Number of calls 5726 8740 This table includes regression analysis of three waves of experimental data from a multiyear simulated patient study (2012, 2014, 2016); analyses were conducted by separated by insurance type of simulated patient. The linear regressions include county-clustered standard errors and state fixed effects.
All P values were determined within groups (ie, they do not represent significant differences between Medicaid and commercially insured simulated patients).
ACO, accountable care organization; ACPs, advanced care practitioners; CI, confidence interval; FQHC, Federally Qualified Health Center; HHI, Herfindahl-Hirschman Index; IHS, integrated health system; PCPs, primary care providers (MDs and DOs).
- Table 3.
Predictors of Wait Times for Primary Care Appointments for Medicaid Simulated Patients, by Medicaid Concentration
Bottom 25% (Low) Medicaid Beneficiary Concentration in County Top 25% (High) Medicaid Beneficiary Concentration in County Coef. (95% CI) P Value Coef. (95% CI) P > |t| Hypertension −3.77 (−6.13, 1.42) 0.002 −1.98 (−3.61, −0.35) 0.018 FQHC flag 4.38 (0.22, 8.54) 0.039 5.46 (1.58, 9.35) 0.006 ACO indicator −0.27 (−3.11, 2.58) 0.852 1.74 (−0.44, 3.91) 0.117 IHS indicator 7.66 (4.48, 10.84) <0.001 3.86 (1.43, 6.28) 0.002 HHI index −2.49 (−8.86, 3.89) 0.442 2.66 (−3.64, 8.96) 0.406 Per capita income (in 1000s) 0.052 (−0.31, 0.14) 0.218 −0.64 (−0.87, −0.42) <0.001 PCPs per 10,000 −5.41 (−10.46, −0.36) 0.036 0.22 (−5.63, 6.07) 0.941 ACPs per 10,000 1.94 (−0.166, 5.54) 0.289 1.01 (−2.20, 4.23) 0.535 FQHCs per 1000 0.01 (−3.46, 3.47) 0.996 −3.11 (−6.33, −0.12) 0.059 Percent urban 4.81 (−1.21, 10.84) 0.117 9.04 (2.87, 15.21) 0.004 Quarter 2 3.08 (−3.60, 9.76) 0.363 −3.00 (−6.02, 0.019) 0.051 Quarter 3 11.88 (1.09, 22.66) 0.031 −2.42 (−9.43, 4.60) 0.497 Quarter 4 1.69 (−1.71, 5.09) 0.326 0.52 (−1.60, 2.64) 0.628 2014 −1.77 (−8.79, 5.26) 0.620 3.58 (0.22, 6.95) 0.037 2016 1.77 (−1.01, 4.55) 0.210 1.06 (−1.24, 3.36) 0.373 Intercept 3.08 (−4.94, 11.09) 0.449 23.64 (15.80, 31.48) <0.001 Number of calls 1217 1700 This table includes summary statistics of three waves of experimental data from a multiyear simulated patient study (2012, 2014, 2016), as separated by county-level Medicaid concentration data. Only Medicaid callers were included. The linear regressions include county-clustered standard errors and state fixed effects.
All P values are within groups (ie, they do not represent difference-in-difference significance between low and high concentration counties) and are derived from two separate regressions.
ACO, accountable care organization; ACPs, advanced care practitioners; CI, confidence interval; FQHC, Federally Qualified Health Center; HHI, Herfindahl-Hirschman Index; IHS, integrated health system; PCPs, primary care providers (MDs and DOs).


