
Abstract
Background: Timely access to primary care is important, particularly among patients with acute conditions and patients seeking gateways to specialty care. Due to concerns that expanded Medicaid eligibility would compromise access to primary care among new Medicaid beneficiaries, an experimental study was conducted to test the ability to obtain timely appointments. Although access to primary care appointments for simulated Medicaid patients significantly increased, wait times also increased. This study explores the determinants of wait times and whether they pose greater barriers to Medicaid beneficiaries.
Methods: We conducted linear regressions to determine the association between the number of days to scheduled appointments and the simulated patient's clinical scenario, practice-level characteristics, and county-level measures of primary care supply.
Results: Simulated Medicaid patients faced 1.3 days longer wait times than commercially insured ones. Participation in accountable care organizations and integrated health systems was associated with longer wait times but did not seem to reduce wait time disparities across insurance types. Notably, the presence of Federally Qualified Health Centers in a given county was associated with lower wait times for simulated Medicaid patients.
Conclusions: These findings highlight the complexity of access disparities for Medicaid patients and provide insight for future waves of health care reform.
- Access to Health Care
- Appointments and Schedules
- Health Care Disparities
- Health Care Reform
- Linear Models
- Medicaid
- Patient Protection and Affordable Care Act
- Primary Health Care
- Vulnerable Populations
Introduction
After the implementation of the Affordable Care Act (ACA) in 2014, the uninsured rate fell from above 17% to 10%.1 Contrary to expectations, primary care appointment availability increased for Medicaid simulated patients and remained stable for commercially insured simulated patients over the same time period.2 The same study found that wait times for primary care appointments increased by approximately 1 day and remained slightly longer for Medicaid simulated patients than for commercially insured simulated patients.3 However, the predictors of wait times and variation across insurance types were not closely examined, prompting the current study.
While Medicaid eligibility has been linked to the increased receipt of health care services, with greater increases in states that expanded Medicaid,4⇓⇓–7 there are concerns that the primary care workforce may be unable to accommodate Medicaid patients,8⇓–10 in part due to Medicaid's relatively low reimbursement rates.11 Indeed, a study conducted before the ACA found that physicians were far less likely to accept new Medicaid patients compared with those that are commercially insured.12 Anticipating the heightened demand resulting from state-level Medicaid expansions, policymakers introduced initiatives to strengthen primary care delivery, including a temporary increase in Medicaid reimbursement for primary care providers (PCPs),13 more funding of Federally Qualified Health Centers (FQHCs),14 and incentivizing primary care coordination through innovative care delivery models such as accountable care organizations (ACOs) and patient-centered medical homes.15
Existing studies of Medicaid access have focused on appointment availability or providers' willingness to accept new patients, but wait times play an important role in the patient experience.16,17 Longer wait times have been shown to decrease patient satisfaction and increase the use of urgent care,18 and one study estimated that roughly 40% of emergency department visits were not emergent and may have been attributable to the lack of timely access to primary care.19 Lack of timely primary care is also associated with delays for specialty services requiring referrals and more self-referrals to higher-cost specialists.20 There is evidence that inadequate access to primary care can increase morbidity and mortality among patients with chronic conditions.21
While Medicaid beneficiaries may experience lower access to primary care appointments due to low reimbursement rates and narrow provider networks, wait times remain an important dimension of access. This motivates the current study, which aims to better understand why Medicaid patients experience longer wait times than commercially insured patients. To do so, we conduct secondary analysis on three waves (2012, 2014, and 2016) of an experimental study of primary care access that focused on the access gap between Medicaid beneficiaries and the commercially insured. We use additional data sources to further explore practice-level and geographic determinants of wait times in primary care across the same diverse 10 states. Hypothesizing that a key driver of the disparity in wait times could be primary care capacity in the face of high volumes of Medicaid patients, we also stratify the sample based on whether the county has a high or low prevalence of Medicaid beneficiaries.
Methods
We conducted a secondary analysis of three waves of experimental data from a simulated patient study (2012, 2014, and 2016) across 10 states (Arkansas, Georgia, Illinois, Iowa, Massachusetts, Montana, New Jersey, Oregon, Pennsylvania, and Texas). Calls were performed by trained and supervised research staff who simulated nonelderly adult patients requesting a new patient appointment for either routine care or an urgent health concern (newly diagnosed untreated hypertension).2 All calls were kept as short as possible, and scheduled appointments were cancelled at the end of the call or immediately thereafter to avoid taking a slot from an actual patient. This study was conducted by the University of Chicago Survey Research Lab and approved by the University of Pennsylvania Institutional Review Board.
In total, 22,859 calls were made to randomly selected practices from a sample frame provided by the SK&A Office-Based Physician Database, which we validated as having at least 90% of all primary care offices through a sample call through.11 Simulated patients were randomized to an insurance type (Medicaid or commercial insurance) and to either the routine checkup or newly diagnosed untreated hypertension (blood pressure of 180/100) clinical scenario.
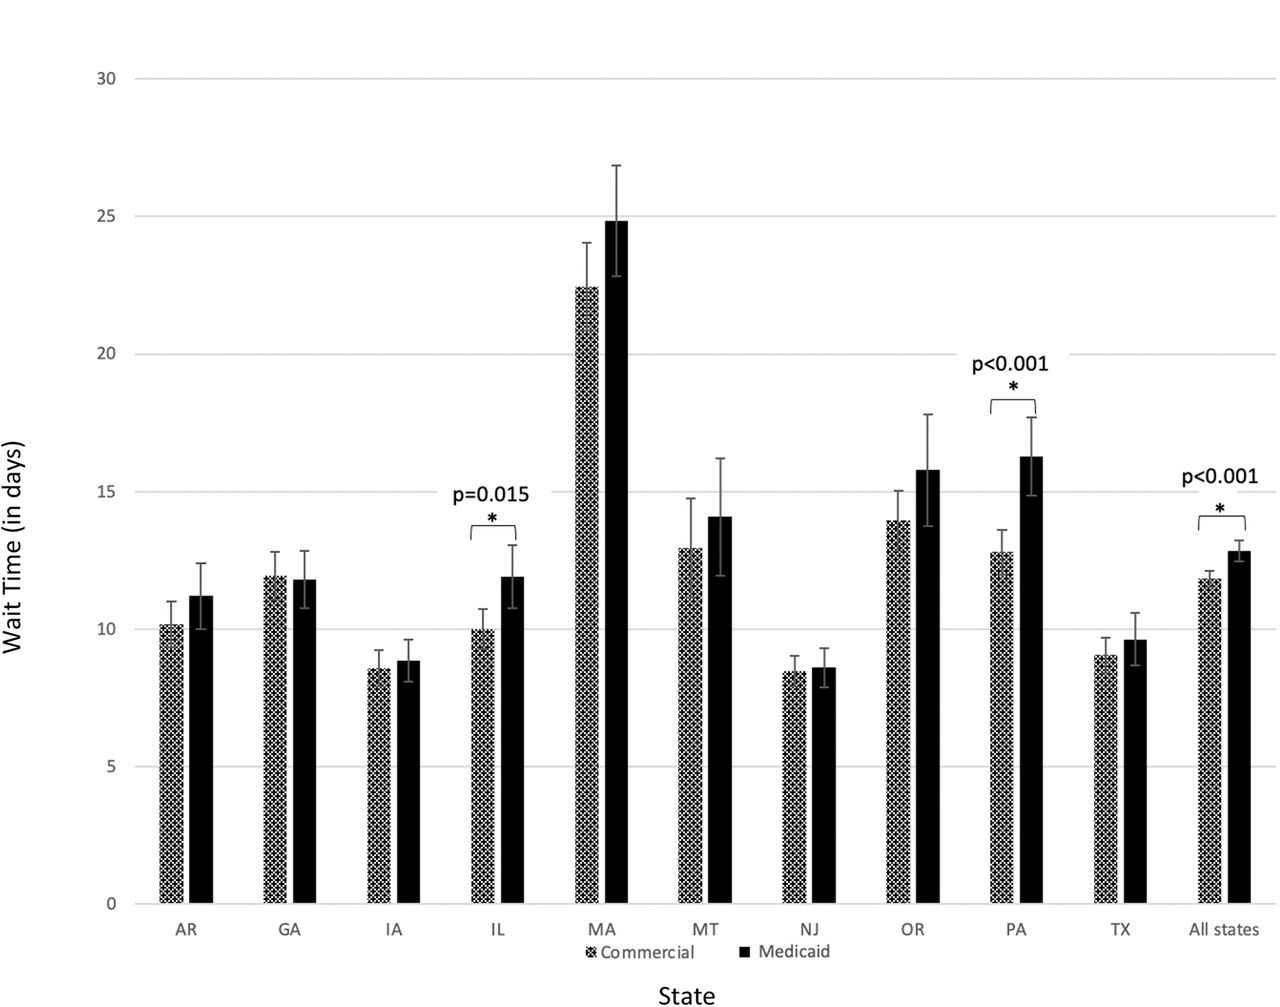
Calls that did not result in an appointment and thus did not result in wait time data (5279) were excluded from the sample, resulting in 14,420 calls with scheduled appointments and a measured wait time, which we compared across insurance type within states (Figure 1). Of note, for offices to be eligible for a Medicaid call, the office had to accept Medicaid. Thus, question of insurance eligibility during the simulated call was not an expected determinant of differential wait times for Medicaid beneficiaries. Instead, factors that were hypothesized to explain wait time differences for Medicaid beneficiaries, such as practice characteristics and county-level Medicaid patient volume characteristics, were deemed more pertinent to the study.

Distribution of Wait Times (in Days) by State and Insurance Type in 2012, 2014, and 2016. An asterisk indicates a two-sample t-test showed a statistically significant difference between categories (P < 0.05). The P value is indicated above the bars.
In addition to the clinical scenario, we explored three additional characteristics that could drive wait times:
Practice-level characteristics: From the SK&A Office-Based Physician Database, we extracted whether the primary care practice was an FQHC, ACO, or integrated health system (IHS). We also calculated a measure of market concentration using the Herfindahl-Hirschman Index (HHI), which measures the share of primary care physicians in a given county that are associated with a given practice.
County-level characteristics: Using the Area Health Resources File, we included measures of the per capita supply of PCPs, defined as MDs and DOs, advanced care practitioners (ACPs), defined as nurse practitioners and physician assistants, and FQHCs by county. We also controlled for rurality, per capita income, and Medicaid beneficiaries per capita.
Temporal characteristics: Year and calendar quarter were controlled for to account for seasonal variation and general time trends.
Summary statistics are included in Table 1.
Summary Statistics of Predictors of Wait Times
To identify the factors that are most predictive of wait times, we performed linear regressions with county-clustered standard errors and included the practice-level, county-level, and temporal characteristics defined above. We added state fixed effects to account for time-invariant differences across states. We ran separate regressions for Medicaid and commercially insured simulated patients to compare the magnitude and statistical significance of potential predictors of wait times. All P values are within groups.
To study the potential impact of the geographic concentration of Medicaid beneficiaries, we stratified analyses by a county-level estimate of Medicaid beneficiaries extracted from the Area Health Resources File and adjusted for population. After stratification, we ran our regression model to study the determinants of wait times, specifically for callers to practices located in counties in the top and bottom quartile of Medicaid beneficiaries per capita on the county level.
Results
The distribution of wait times in each state and by insurance type is shown in Figure 1 The predictors of wait times across insurance type are shown in Table 2.
Predictors of the Number of Days to Primary Care Appointments for Medicaid versus Commercially Insured Simulated Patients
The largest predictor of wait times was simulated patient acuity. Medicaid callers who indicated having untreated hypertension (ie, they were concerned about a high blood pressure reading and were not on medication for hypertension) waited 3.6 days less (P < .001) than those who requested a routine checkup. Commercially insured callers waited 4.5 days less (P < .001) than those who requested a checkup.
Practice characteristics were also predictive of wait times. In practices that were FQHCs, Medicaid callers waited 4.5 days longer (P < .001), and commercially insured callers waited 3.2 days longer (P = .001). In practices that participate in an ACO, Medicaid callers waited 1.7 days longer (P = .033), and commercially insured callers waited 1.2 days longer (P = .015). In practices that are part of an IHS, Medicaid callers waited 5.7 days longer (P < .001), and commercially insured callers waited 4.0 days longer (P < .001).
Among the county-level characteristics, rurality was associated with shorter wait times. A practice residing in a county that was 100% urban had wait times that were 5.2 days longer for Medicaid callers (P = .008) than counties that were 100% rural. On the other hand, commercially insured callers waited 2.8 days longer in counties that were 100% urban (P = .045). In terms of primary care supply, including the numbers of PCP and ACP per capita, no significant difference in wait times were detected, with the exception of PCP supply for Medicaid callers. A higher PCP supply in counties in which Medicaid callers scheduled appointments decreased wait times by 4.1 days (P = .025). Wait times decreased by 1.4 days (P = .017) for every additional FQHC per 1000 people in the county for Medicaid callers and were unchanged for the commercially insured.
In comparison to the first wave of calls in 2012, wait times increased by 2.5 days (P < .001) for commercially insured callers and 2.2 days for Medicaid callers (P = .001) in the third wave of calls in 2016. Seasonal differences were notable in the fourth quarter, where wait times were 1.4 days longer (P = .005) for commercially insured callers and 1.5 days longer (P = .033) for Medicaid callers than in the first quarter of the year.
We also stratified the sample based on practices residing in counties in the top and bottom quartile of Medicaid beneficiary concentration, as shown in Table 3. In the top quartile, a Medicaid caller in a 100% urban county waited 9.0 days longer for an appointment (P = .004) than in a 100% rural county. Hypertensive Medicaid callers in low-Medicaid counties waited 3.8 days less (P = .002) than checkup callers and 2.0 days less than checkup callers in high-Medicaid counties (P = .018). The presence of FQHCs did not reduce wait times in the bottom quartile but did reduce wait times by 3.1 days (P = .059) in the top quartile of Medicaid beneficiary concentration on the county level.
Predictors of Wait Times for Primary Care Appointments for Medicaid Simulated Patients, by Medicaid Concentration
Discussion
This study examined the determinants of wait times for primary care appointments across 10 diverse states over three waves of experimental data collection in 2012, 2014, and 2016. We were particularly interested in identifying factors associated with wait times for Medicaid beneficiaries, who typically experience more barriers in access to primary care than commercially insured patients.12 Given that the ACA was largely modeled on Massachusetts's 2006 health care reforms, there was widespread anticipation that the ACA's insurance expansions would lead to issues scheduling primary care appointments.22 A large multiphase study largely found the opposite: by 2014 the ability of a simulated patient with Medicaid to get a primary care appointment increased after the ACA; in 2016, the increase only remained significant in states that expanded Medicaid.2 It also found that, among primary care offices that offered appointments in 2012, there was a one day increase in wait times, with Medicaid simulated patients experiencing longer wait times than commercially insured simulated patients. This study unpacks the impact of clinical concerns and practice characteristics associated with variations in primary care wait times.
While Massachusetts continued to have longer wait times for primary care, reported since its 2006 insurance expansions,23 Massachusetts was the only state to experience a decline in wait times from 2012 to 2016 in our study. Moreover, there were no significant disparities in wait times between Medicaid and commercially insured callers in that state.
Acuity was significantly associated with reduced wait times for both commercially insured and Medicaid callers, indicating that primary care practices are engaging in triage, prioritizing simulated patients with an urgent health concern over routine care.24 Finding that Medicaid and commercially insured simulated patients with similar clinical scenarios have lower wait times is reassuring that appropriate triage is being exercised similarly for insurance types.
These results also highlight how practice-level and geographic characteristics are associated with wait times. While callers of each insurance type experienced longer wait times in practices that participate in an ACO or IHS, Medicaid callers in these arrangements still experienced longer waits than commercially insured callers in the same practices on average. This suggests that models of primary care that focus on improved access and quality, such as ACOs and IHSs, should put additional effort into reducing insurance-related disparities among their patients.
Unlike ACOs and IHSs, the presence of FQHCs in a given county appeared to benefit Medicaid callers, especially in counties with a high prevalence of Medicaid beneficiaries. The presence of FQHCs was associated with shorter wait times within a county despite FQHCs having a longer wait time on average.25 This suggests that there may be positive spillover effects from FQHCs to neighboring primary care practices, which adds to the important role FQHCs have played since the ACA coverage expansions.14 There is evidence to suggest that Medicaid callers benefit most from FQHCs in counties that have higher percentages of Medicaid beneficiaries, which suggests an additional benefit of establishing FQHCs where the need is greatest.
There were several indicators that were significant in predicting wait times for Medicaid callers that were not significant in predicting wait times for the commercially insured callers. For example, the concentration of Medicaid beneficiaries, supply of PCPs, and FQHCs on the county level were only significant in the Medicaid group. Focusing on those counties with a higher concentration of Medicaid beneficiaries, we also found that more PCP supply benefits Medicaid beneficiaries only in low Medicaid beneficiary counties, while FQHCs reduced wait times only in high Medicaid beneficiary counties.
Combined, these results suggest that capacity concerns are exacerbated in areas with higher concentrations of Medicaid beneficiaries. Indeed, wait times were longer in the top quartile of counties in terms of Medicaid concentration, indicating that practices may be less inclined to take on new Medicaid patients. As the Health Resources and Services Administration assesses primary care shortage areas, it might do more to address differences in insurance composition of populations as well as differences in the likelihood to schedule a timely appointment. Fortunately, our evidence also suggests that existing policy solutions, including funding for FQHCs, are already working to address these disparities.
While wait times are considered an important determinant of access, it is important to note that there is no standard recommendation on what constitutes appropriate wait times for various types of primary care appointments. Some commonly used quality benchmarks include follow-up care received within 7 and 30 days, pointing to the importance of timely care.26 Studies have shown an inverse relationship between wait times and patient satisfaction and highlighted potential trade-offs with morbidity and mortality when primary care is not accessible, but quality metrics around wait times could clarify these associations.17,20
Our findings also indicate that patients may be at greater risk of delay in the last quarter of the year. While callers were scripted to refer to their clinical scenario as part of the research design, there may be less information shared when patients with limited health literacy try to schedule appointments, as they may not provide the clinical information needed for timely scheduling. Professional associations should consider creating clinical guidelines about the types of questions to ask when scheduling appointments. While it is very encouraging that primary care practices are prioritizing hypertensive callers, schedulers and patients alike might benefit from guidelines regarding indications and timeframes for urgent primary care.
A number of study limitations must be noted. The experimental design controls for patient-level factors. Simulated patients were trained to consistently push for and accept the soonest possible appointment that was offered. Depending on their needs and personal obligations to work or family, real patients may experience more variation in the timeliness of new patient appointments. While we selected the 10 states to represent variation in sociodemographic characteristics, health care systems, and health policy, results may not be generalizable to other states. We also focused on nonelderly populations—while the motivation for that focus was Medicaid expansions that targeted the nonelderly, a study of wait times in Finland16 revealed that age was an important factor and that elderly patients experienced longer wait times. Likewise, we cannot comment on the timeliness of appointments for established patients.
Finally, all practices were in network for the insurance plan used in the call. Actual patients might face more rejection or longer wait times, especially if they do not have accurate information as to who is in network for their insurance plan. Moreover, inclusion in this study was conditional on callers receiving an appointment; there were 5279 calls that did not result in an appointment and were excluded from the analysis.
Despite these limitations, this study makes novel contributions to our understanding of wait times in primary care and sheds new light on wait time disparities experienced by Medicaid beneficiaries. Primary care is the most common point of contact for patients, increasingly taking on roles for diagnosing and treating complex conditions, including diabetes and mental health.27,28 Primary care is also the gateway to accessing needed specialty care.29 Increasing our understanding of what drives the variation in wait times can improve scheduling efficiency and close persistent gaps in access between Medicaid beneficiaries and the commercially insured. Aligning the incentives to improve equitable access to primary care should be an important goal in future health care reform efforts.
Acknowledgments
We thank Daniel Polsky, PhD, Genevieve Kenney, PhD, Doug Wissoker, PhD, and Martha Van Haitsma, PhD, and research staff from the University of Chicago Survey Lab for collaborating on the survey design and conducting the data collection.
Notes
This article was externally peer reviewed.
Funding: Data collection was funded by the Robert Wood Johnson Foundation, grant number 71100.
Conflict of interest: None.
To see this article online, please go to: http://jabfm.org/content/34/3/571.full.
- Received for publication September 21, 2020.
- Revision received December 1, 2020.
- Accepted for publication December 3, 2020.


