
Article Figures & Data
Figures
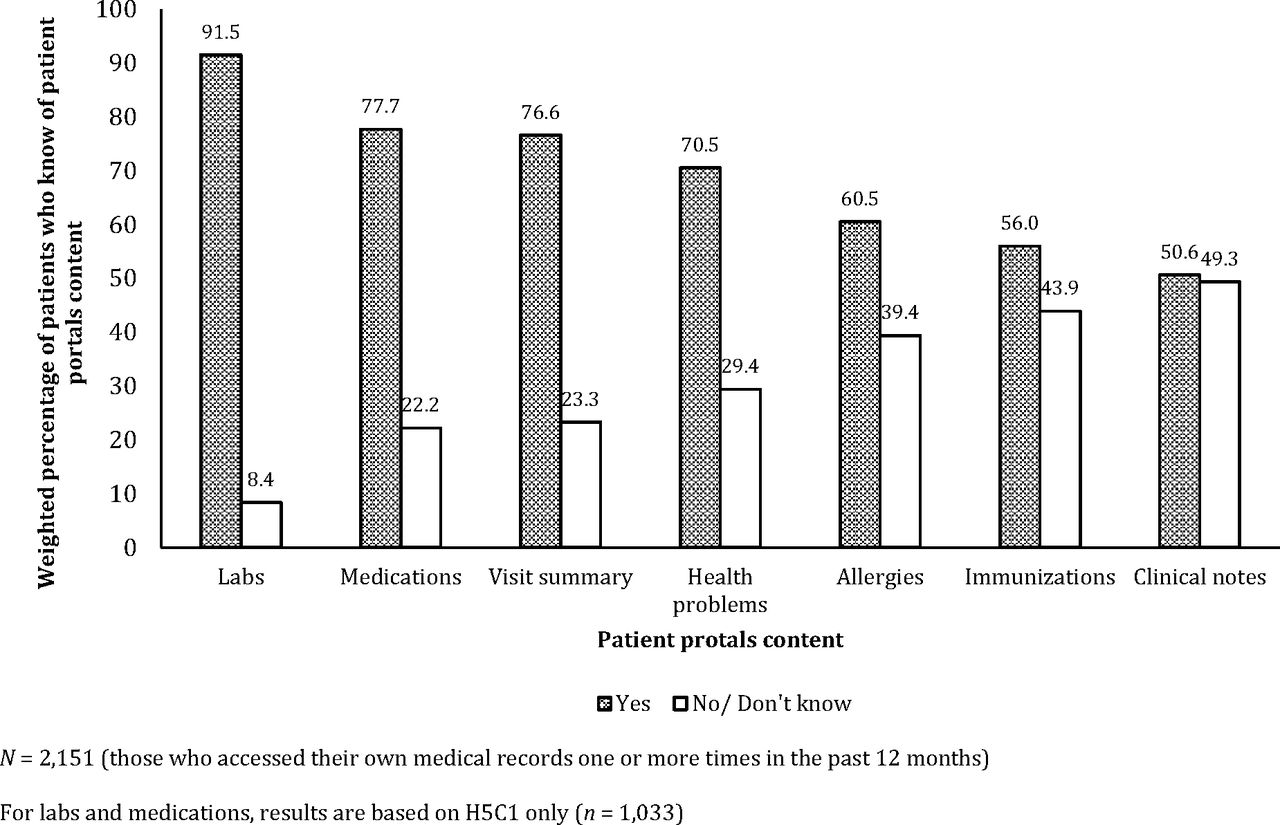
- Figure 1.
Knowledge of patient portals content among 2151 participants in the 2017–2018 Health Information National Trends Survey 5, Cycles 1 and 2, US.

Tables
- Table 1.
Weighted Sample Characteristics of 6789 Participants in the 2017–2018 Health Information National Trends Survey 5, Cycles 1 and 2, US
n % Weighted LL UL Gender Men 2759 48.9 48.7 49.1 Women 4030 51.1 50.9 51.3 Age, years 18 to 39 1248 30.6 28.7 32.4 40 to 59 2391 42.3 40.5 44.1 ≥ 60 3150 27.1 26.9 27.4 Race/ethnicity Latino 995 15.8 15.5 16.2 White 4297 65.2 64.7 65.7 Black 923 10.5 10.0 11.0 Other* 574 8.4 8.2 8.7 Annual household income < $20,000 1254 17.3 15.9 18.8 $20,000 to $49,999 1829 26.1 24.5 27.7 $50,000 to $74,999 1237 18.5 17.0 20.0 ≥ $75000 2470 38.1 36.2 39.9 Education < High school 504 8.8 7.6 10.0 High school graduate 1279 22.6 21.4 23.8 Vocational school, some college 2040 36.4 35.3 37.6 College graduate, postgraduate 2967 32.2 31.9 32.4 Employment Employed 3423 57.9 55.8 59.9 Unemployed 3366 42.1 40.1 44.2 Marital status Single 1169 30.2 30.0 30.5 Married, living as married 3595 53.9 53.1 54.7 Separated, widowed 2024 15.9 15.1 16.6 Place of birth United States 5826 85.5 84.4 86.5 Foreign born 963 14.5 13.5 15.6 Speak English Very well 6042 88.3 87.2 89.3 Well, not well, not at all 747 11.7 10.7 12.8 Regular provider Yes 4848 65.4 63.6 67.3 No 1941 34.6 32.7 36.4 Health insurance Yes 6441 91.6 91.5 91.7 No 348 8.4 8.3 8.5 General health Excellent/good 5638 84.1 82.6 85.6 Fair/poor 1151 15.9 14.4 17.4 Census region Northeast census region 1065 17.9 17.9 17.9 Midwest census region 1249 21.0 21.0 21.0 South census region 2893 37.6 37.6 37.6 West census region 1582 23.5 23.5 23.5 Rural/urban designation Metro 5863 86.1 84.8 87.3 Urban 834 12.4 11.2 13.7 Rural 92 1.5 1.0 2.0 LL, lower limit; UL, upper limit.
n = 6789; Imputed subjects have 20 records, thus imputed n is 1/20th of a subject rounded to the nearest integer.
↵* Asians, Pacific Islanders, and multiple races.
- Table 2.
Multivariate Logistic Regression Models of Associations between Patient Characteristics and Patient Portals Access and Use in the Health Information National Trends Survey 5, Cycles 1 and 2, US
Access Facilitators of Use Use Behavior Provider Maintains Medical Records, aOR (95% CI) Provider Offers Medical Records Access, aOR (95% CI) Provider Encourages Medical Record Use†, aOR (95% CI) Confident Medical Records Safe, aOR (95% CI) Access Own Medical Record, aOR (95% CI) Access Family Medical Record†, aOR (95% CI) Gender (ref: men) Women 1.7 (1.4-2.0) 1.7 (1.5-2.0) 1.6 (1.3-2.0) 1.2 (0.9-1.4) 1.5 (1.2-1.8) 1.6 (1.0-2.3) Age (ref: 18 to 39 years) 40 to 59 years 1.2 (0.9-1.6) 0.9 (0.8-1.2) 0.9 (0.7-1.3) 0.9 (0.7-1.1) 1.1 (0.9-1.4) 0.9 (0.6-1.3) ≥ 60 years 1.4 (1.0-1.8) 0.8 (0.7-1.0) 0.8 (0.6-1.0) 1.0 (0.8-1.3) 0.8 (0.6-0.9) 0.7 (0.4-1.2) Race/ethnicity (ref: White) Latino 1.2 (0.9-1.5) 0.9 (0.7-1.1) 0.8 (0.6-1.2) 1.3 (0.9-1.8) 0.9 (0.7-1.2) 1.1 (0.7-1.8) Black 1.2 (0.8-1.7) 0.8 (0.7-1.0) 1.0 (0.8-1.5) 1.0 (0.8-1.4) 0.9 (0.7-1.2) 0.8 (0.4-1.6) Other* 0.9 (0.5-1.4) 0.8 (0.6-1.0) 0.8 (0.6-1.2) 0.9 (0.7-1.3) 1.2 (0.9-1.7) 1.2 (0.7-2.1) Education (ref: college/post grad) < High school 0.5 (0.3-0.8) 0.4 (0.3-0.7) 0.5 (0.2-1.0) 1.4 (0.9-2.1) 0.3 (0.2-0.5) 0.7 (0.3-1.7) High school grad 0.6 (0.4-0.7) 0.6 (0.4-0.7) 0.4 (0.3-0.6) 1.0 (0.8-1.4) 0.4 (0.3-0.5) 0.3 (0.1-0.5) Vocational, some college 0.6 (0.5-0.8) 0.6 (0.5-0.8) 0.6 (0.5-0.8) 1.2 (0.9-1.5) 0.5 (0.4-0.7) 0.5 (0.4-0.8) Marital status (ref: married, living as married) Single 0.6 (0.4-0.8) 0.5 (0.4-0.6) 0.4 (0.3-0.6) 1.0 (0.8-1.3) 0.6 (0.5-0.8) 0.2 (0.1-0.6) Separated, widowed 0.7 (0.5-0.9) 0.6 (0.5-0.7) 0.6 (0.5-0.8) 1.0 (0.9-1.3) 0.6 (0.5-0.7) 0.4 (0.2-0.8) Speak English (ref: very well) Well, not well, not at all 0.7 (0.5-0.9) 0.6 (0.4-0.8) 0.8 (0.5-1.2) 0.8 (0.6-1.1) 0.7 (0.5-0.9) 1.2 (0.7-2.2) Health insurance (ref: yes) No 0.5 (0.3-0.9) 0.5 (0.3-0.8) 0.7 (0.3-1.5) 0.9 (0.5-1.4) 0.4 (0.2-0.7) 0.8 (0.3-2.3) Regular provider (ref: yes) No 0.3 (0.2-0.4) 0.4 (0.4-0.5) 0.5 (0.4-0.6) 0.7 (0.6-0.9) 0.4 (0.3-0.5) 0.6 (0.4-0.9) General health (ref: excellent/good) Fair/poor 0.9 (0.7-1.1) 0.9 (0.8-1.2) 1.0 (0.8-1.4) 0.7 (0.5-0.9) 0.9 (0.7-1.1) 1.0 (0.6-1.6) Census region (ref: Northeast) Midwest 0.8 (0.6-1.2) 0.9 (0.7-1.3) 1.0 (0.7-1.7) 1.2 (0.9-1.6) 1.2 (0.9-1.7) 1.1 (0.6-2.1) South 0.7 (0.5-0.9) 0.8 (0.6-1.0) 0.9 (0.7-1.5) 1.1 (0.9-1.4) 1.0 (0.8-1.4) 1.2 (0.7-2.1) West 0.8 (0.6-1.1) 0.9 (0.6-1.1) 1.1 (0.8-1.7) 0.9 (0.7-1.2) 1.3 (0.9-1.7) 1.5 (0.9-2.6) Rural/urban designation (ref: metro) Urban 1.0 (0.7-1.5) 0.7 (0.5-0.9) 0.6 (0.4-0.9) 1.0 (0.8-1.4) 0.6 (0.4-0.8) 0.9 (0.5-1.9) Rural 0.7 (0.3-1.5) 0.6 (0.3-1.2) 0.6 (0.2-1.6) 0.9 (0.4-2.1) 0.7 (0.4-1.4) 0.5 (0.01-30.3) aOR, adjusted odds ratio; CI, confidence interval.
n = 6789.
↵* Asians, Pacific Islanders, and multiple races.
↵† Question was omitted in 2018 H5C2, so n = 3285 based on H5C1 only.
Bolded cells are statistically meaningful.
Participants in H5C2 were asked the number of times that they accessed their own medical records only if they responded “yes” to whether they have been offered online access to medical records. Participants then reported who offered them access (i.e., healthcare provider, health insurer, someone else). To harmonize the data, we coded participants who said “no/don’t know” to “have you been offered online access to your medical records?” as “no” and those who selected “healthcare provider” to “who offered you online access to your medical records?” as “yes.”
Logistic regression analysis modeled the probability of 1 (eg, provider maintained electronic medical records, provider offered access to electronic medical records).
- Table 3.
Multivariate Logistic Regression Models of Associations between Patient Characteristics and Use of Patient Portals Functionalities in the 2017–2018 Health Information National Trends Survey 5, Cycles 1 and 2, US
View Results,† aOR (95% CI) Message Healthcare Provider, aOR (95% CI) Make Appointment,† aOR (95% CI) Refill Medication, aOR (95% CI) Complete Forms, aOR (95% CI) Gender (ref: men) Women 1.1 (0.6-2.0) 0.9 (0.7-1.2) 0.8 (0.5-1.2) 0.9 (0.7-1.2) 1.0 (0.8-1.4) Age (ref: 18 to 39 years) 40 to 59 years 1.3 (0.7-2.3) 0.8 (0.5-1.1) 0.9 (0.5-1.5) 1.1 (0.7-1.7) 1.0 (0.7-1.6) ≥60 years 0.7 (0.4-1.4) 0.7 (0.5-0.9) 0.8 (0.4-1.3) 1.7 (1.1-2.5) 0.8 (0.5-1.0) Race/ethnicity (ref: White) Latino 0.5 (0.3-1.0) 0.8 (0.5-1.2) 1.0 (0.5-2.1) 0.9 (0.7-1.4) 0.9 (0.6-1.5) Black 0.8 (0.4-1.8) 1.0 (0.7-1.6) 1.6 (0.8-3.0) 1.0 (0.7-1.7) 0.7 (0.4-1.0) Other* 0.8 (0.3-1.9) 0.7 (0.4-1.3) 1.5 (0.8-2.5) 1.2 (0.7-1.9) 0.7 (0.4-1.0) Education (ref: college/post grad) <High school 1.7 (0.4-6.5) 1.0 (0.3-2.9) 0.2 (0.04-1.0) 1.7 (0.6-5.0) 0.3 (0.1-0.9) High school grad 0.9 (0.3-2.7) 1.0 (0.7-1.5) 1.1 (0.6-2.1) 0.9 (0.7-1.4) 0.6 (0.4-0.8) Vocational, some college 1.1 (0.6-2.1) 1.0 (0.8-1.4) 0.9 (0.6-1.4) 1.0 (0.7-1.4) 0.7 (0.5-0.9) Marital status (ref: married, living as married) Single 0.8 (0.4-1.7) 1.3 (0.9-2.0) 1.4 (0.8-2.5) 1.3 (0.9-1.9) 1.3 (0.9-1.9) Separated, widowed 0.9 (0.4-1.8) 0.9 (0.6-1.3) 0.9 (0.6-1.6) 0.9 (0.7-1.3) 0.9 (0.7-1.3) Speak English (ref: very well) Well, not well, not at all 0.8 (0.3-1.8) 0.8 (0.4-1.3) 1.4 (0.6-3.3) 0.5 (0.3-0.9) 0.7 (0.3-1.3) Health insurance (ref: yes) No 0.6 (0.1-5.7) 0.9 (0.4-2.5) 0.9 (0.2-4.5) 0.6 (0.2-1.9) 0.6 (0.1-2.2) Regular provider (ref: yes) No 0.8 (0.4-1.6) 0.7 (0.5-0.9) 1.0 (0.6-1.9) 0.8 (0.5-1.2) 0.8 (0.6-1.1) General health (ref: excellent/good) Fair/poor 1.1 (0.5-2.7) 1.3 (0.8-1.9) 1.1 (0.7-1.9) 1.6 (1.1-2.3) 1.4 (0.9-2.1) Census region (ref: Northeast) Midwest 0.7 (0.3-1.7) 1.0 (0.7-1.6) 0.9 (0.5-1.8) 0.7 (0.5-1.1) 1.2 (0.7-2.1) South 1.2 (0.6-2.3) 1.0 (0.8-1.5) 1.5 (0.8-2.9) 0.9 (0.7-1.4) 1.8 (1.2-2.7) West 2.8 (1.3-6.3) 2.5 (1.7-3.9) 3.5 (1.8-6.8) 1.5 (0.9-2.2) 1.6 (1.0-2.5) Rural/urban designation (ref: metro) Urban 1.0 (0.4-2.6) 0.9 (0.6-1.7) 1.3 (0.7-2.5) 1.0 (0.7-1.6) 0.7 (0.4-1.2) Rural 1.9 (0.1-54.8) 0.8 (0.3-2.6) 2.4 (0.5-12.4) 1.8 (0.5-6.4) 1.4 (0.4-4.6) Monitor health† Make decisions Add information Download information Request correction aOR (95% CI) aOR (95% CI) aOR (95% CI) aOR (95% CI) aOR (95% CI) Gender (ref: men) Women 0.7 (0.5-1.1) 0.8 (0.6-1.2) 1.0 (0.8-1.4) 0.8 (0.5-1.1) 1.4 (0.8-2.3) Age (ref: 18 to 39 years) 40 to 59 years 0.9 (0.6-1.7) 0.7 (0.5-1.0) 1.1 (0.8-1.7) 0.8 (0.5-1.0) 0.8 (0.4-1.6) ≥60 years 0.7 (0.4-1.2) 0.5 (0.3-0.8) 0.9 (0.6-1.4) 0.6 (0.4-0.9) 0.7 (0.3-1.7) Race/ethnicity (ref: White) Latino 0.9 (0.4-2.1) 1.0 (0.6-1.8) 1.0 (0.7-1.8) 1.0 (0.7-1.7) 1.2 (0.6-2.6) Black 1.6 (0.8-3.2) 1.7 (1.0-2.9) 1.0 (0.7-1.8) 1.1 (0.7-1.9) 1.6 (0.8-3.0) Other* 1.2 (0.6-2.4) 1.0 (0.6-1.9) 0.7 (0.4-1.4) 0.9 (0.6-1.7) 0.9 (0.4-2.1) Education (ref: college/post grad) <High school 0.7 (0.1-4.4) 0.4 (0.2-0.9) 0.5 (0.2-1.2) 0.3 (0.1-0.8) 1.2 (0.3-4.6) High school grad 0.9 (0.4-1.7) 0.9 (0.5-1.5) 0.9 (0.6-1.5) 0.5 (0.2-1.0) 0.6 (0.3-1.5) Vocational, some college 0.8 (0.5-1.2) 0.8 (0.6-1.2) 0.8 (0.6-1.2) 0.9 (0.6-1.3) 0.9 (0.6-1.6) Marital status (ref: married, living as married) Single 0.9 (0.5-1.8) 0.9 (0.6-1.4) 1.5 (0.9-2.2) 0.9 (0.5-1.6) 1.2 (0.6-2.4) Separated, widowed 0.7 (0.4-1.3) 0.8 (0.5-1.2) 0.9 (0.7-1.3) 1.3 (0.8-1.9) 1.6 (0.8-3.2) Speak English (ref: very well) Well, not well, not at all 1.2 (0.4-3.5) 1.1 (0.6-2.2) 0.9 (0.4-1.7) 1.6 (0.8-3.2) 2.2 (0.9-5.2) Health insurance (ref: yes) No 0.5 (0.05-4.3) 1.1 (0.3-4.6) 0.8 (0.2-4.0) 0.7 (0.2-3.0) 0.7 (0.02-22.2) Regular provider (ref: yes) No 0.6 (0.4-1.2) 0.7 (0.5-1.1) 0.7 (0.5-1.0) 1.0 (0.7-1.5) 0.9 (0.5-1.7) General health (ref: excellent/good) Fair/poor 0.9 (0.5-1.7) 1.5 (0.8-2.7) 1.3 (0.9-2.0) 1.2 (0.7-2.1) 1.7 (0.9-3.2) Census region (ref: Northeast) Midwest 1.9 (0.9-3.5) 1.0 (0.6-1.9) 1.6 (0.9-2.6) 0.9 (0.5-1.9) 1.3 (0.6-3.0) South 1.5 (0.9-2.6) 0.9 (0.6-1.5) 1.8 (1.0-3.1) 1.3 (0.8-2.1) 1.3 (0.7-2.7) West 1.8 (0.9-3.4) 1.5 (0.9-2.5) 2.4 (1.4-4.2) 1.1 (0.7-1.9) 1.9 (0.9-3.9) Rural/ Urban designation (ref: metro) Urban 1.6 (0.9-3.0) 0.9 (0.5-1.7) 1.1 (0.7-2.0) 1.7 (0.9-2.8) 1.1 (0.4-2.8) Rural 2.0 (0.3-10.9) 1.2 (0.2-7.7) 2.2 (0.6-8.7) 3.9 (1.2-12.8) 3.0 (0.1-70.1) aOR, adjusted odds ratio; CI, confidence interval.
n = 2,151 reflects those who accessed their own medical records one or more times in the past 12 months.
↵* Asians, Pacific Islanders, and multiple races.
↵† Question was omitted in 2018 H5C2, so n = 1033 (those who accessed their own medical records one or more times in the past 12 months based on H5C1 only).
Bolded cells are statistically meaningful.
Logistic regression analysis modeled the probability of 1 (e.g., patient viewed results, patient messaged healthcare provider).
Appendix Table 1: Multivariate Logistic Regression Models of Associations between Patient Characteristics, Internet Access, and Electronic Device Ownership, and Use of Personal and Family Patient Portals in the 2017–2018 Health Information National Trends Survey 5, Cycles 1 and 2, US
Access Own Medical Record, aOR (95% CI) Access Family Medical Record, aOR (95% CI) Gender (ref: men) Women 1.5 (1.2-1.8) 1.6 (1.0-2.3) Age (ref: 18 to 39 years) 40 to 59 years 1.1 (0.9-1.4) 0.9 (0.6-1.4) ≥ 60 years 1.1 (0.9-1.5) 0.9 (0.5-1.6) Race/ethnicity (ref: White) Latino 0.9 (0.7-1.2) 1.1 (0.7-1.9) Black 0.9 (0.7-1.2) 0.8 (0.4-1.5) Other* 1.2 (0.9-1.7) 1.2 (0.7-2.0) Education (ref: college/post grad) < High school 0.5 (0.3-0.9) 0.8 (0.3-2.2) High school grad 0.5 (0.4-0.7) 0.3 (0.2-0.6) Vocational, some college 0.6 (0.5-0.7) 0.5 (0.4-0.8) Marital status (ref: married, living as married) Single 0.7 (0.5-0.9) 0.2 (0.1-0.6) Separated, widowed 0.8 (0.6-0.9) 0.5 (0.3-0.9) Speak English (ref: very well) Well, not well, not at all 0.8 (0.6-1.1) 1.3 (0.6-2.4) Health insurance (ref: yes) No 0.4 (0.2-0.7) 0.9 (0.3-2.5) Regular provider (ref: yes) No 0.4 (0.3-0.5) 0.6 (0.4-0.9) General health (ref: excellent/good) Fair/poor 1.0 (0.8-1.3) 1.1 (0.7-1.8) Census region (ref: Northeast) Midwest 1.3 (0.9-1.8) 1.2 (0.6-2.2) South 1.0 (0.8-1.4) 1.2 (0.7-2.1) West 1.2 (0.9-1.6) 1.4 (0.8-2.5) Rural/urban designation (ref: metro) Urban 0.6 (0.4-0.8) 0.9 (0.5-2.1) Rural 0.7 (0.3-1.5) 0.5 (0.01-29.3) Dial-up (ref: yes) No 1.7 (0.7-4.1) 1.0 (0.2-4.5) Not ascertained† 0.6 (0.2-1.5) 1.0 (0.2-4.5) Broadband (ref: yes) No 0.7 (0.6-0.8) 0.7 (0.5-1.0) Cell network (ref: yes) No 1.2 (1.0-1.5) 0.9 (0.7-1.4) Wi-Fi (ref: yes) No 0.7 (0.6-0.9) 0.8 (0.5-1.3) Tablet (ref: yes) No 0.6 (0.5-0.7) 0.8 (0.5-1.3) Smartphone (ref: yes) No 0.5 (0.4-0.6) 0.6 (0.3-1.2) aOR, adjusted odds ratio; CI, confidence interval.
n = 6789 for access own medical records and n = 3285 for access family medical records.
↵* Asians, Pacific Islanders, and multiple races.
Among those who responded yes to “Do you ever go online to access the Internet or World Wide Web, or to send and receive email?” any internet use was at 82.0% (n = 5280; 95% CI, 80.6-83.3) with dial-up access at 2.3% (n = 140; 95% CI, 1.7-3.0), broadband access at 52.5% (n = 2749; 95% CI, 50.2-54.9), cell network at 66.2% (n = 3099; 95% CI, 64.3-68.1), and Wi-Fi access at 82.1% (n = 4178; 95% CI, 80.5-83.6).
Any electronic device ownership was at 98.0% (n = 6656; 95% CI, 97.5-98.4) with tablet ownership at 59.8% (n = 3894; 95% CI, 57.7-61.8), smartphone ownership at 79.5% (n = 5008; 95% CI, 78.2-80.8), and cellphone ownership at 15.5% (n = 1317; 95% CI, 14.1-16.8).
† “Not ascertained” (n = 750) were those who reported no internet access and, thus, were not asked questions about means to access the internet via dial up, broadband, cell network, Wi-Fi.
Table includes odds ratio for “not ascertained dial up” only because SAS calculates the first odds ratio for a group of linearly related outcomes, which is the case for “not ascertained” for dial-up, broadband, cell network, and Wi-Fi.
Bolded cells are statistically meaningful.
Logistic regression analysis modeled the probability of 1 (e.g., patient accessed their own medical records).
In this issue


Jump to section
Related Articles
Cited By...
- Cross-sectional analyses of online appointment booking and repeat prescription ordering user characteristics in general practices of England in the years 2018-2020
- Post-Pandemic Telehealth Policy for Primary Care: An Equity Perspective
- Socioeconomic deprivation, age and language are barriers to accessing personal health records: a cross-sectional study of a large hospital-based personal health record system
- Must-Read Family Medicine Research--Glucosamine/Chondroitin Supplements and Mortality, Telomere Length and the Doctor-Patient Relationship, Reducing Opioid Use, and More