
Abstract
Background and Objectives: The purpose of this study is to examine the patterns of patient teach-back experience (also known as “interactive communication loop”) and determine its association with risk for diabetic complications and hospitalization, and health expenditures among individuals with diabetes.
Methods: A retrospective cohort study of 2901 US adults aged 18 years or older with a confirmed diagnosis of diabetes was conducted using data from the 2011 to 2016 Longitudinal Medical Expenditure Panel Survey. Survey-design adjusted multivariable models were used to examine whether having patient teach-back experience at the baseline year (Year 1) is associated with development of diabetic complications, hospitalization, and health expenditure at follow-up year (Year 2). Health expenditures were adjusted for inflation and expressed in 2017 US dollars. All adjusted models included patient sociodemographic and clinical characteristics.
Results: Analyses found that patients with teach-back experience were less likely to develop diabetic complications (adjusted odds ratio [AOR], 0.70; 95% CI, 0.52–0.96) and be admitted to the hospital due to diabetic complications (AOR, 0.51; 95% CI, 0.29–0.88) at 1-year followup. Patients having teach-back experience also had a significantly smaller increase in total expenditures of $1920 compared with those not having teach-back of $3639 (a differential change of −$1579; 95% CI, −$1717 to −$1443; P < .001).
Conclusions: Teach-back could be an effective communication strategy that has potential to improve health outcomes, resulting in savings in diabetes care.
- Diabetes Complications
- Diabetes Mellitus
- Health Expenditures
- Health Communication
- Health Literacy
- Hospitalization
- Longitudinal Studies
- Outcomes Assessment
- Patient-Centered Care
- Primary Health Care
- Retrospective Studies
- Surveys and Questionnaires
Introduction
Diabetes mellitus is a growing public health concern in the world. The International Diabetes Federation has estimated 425 million people live with diabetes around the globe; nearly $727 billion USD were spent to provide care for diabetes treatment in 2017.1 In the United States, 1 in 3 individuals are projected to have diabetes by 2050.2 Those with diabetes are at increased risk of medical complications including premature death and lifelong severe impairments and disabilities.3⇓⇓–6 Given the significant burden on health care, there is an increasing need for effective and efficient means of providing care that could attenuate this trend.
Diabetes is a complex condition requiring active patient self-management and continuous care from health care providers.7⇓–9 The goal of diabetes care management is to prevent or delay the development of diabetes-associated complications, decrease mortality, and maintain or improve the overall quality of life among those living with the disease.10 To achieve this goal, diabetes care management encompasses both medical treatments by clinicians and self management by patients.8,10,11 Therefore, patient education that improves patient knowledge and compliance to treatment comes first as a critical component of primary diabetes care.8
Teach-back is a communication technique to assess patient understanding by checking health information delivered in communication between patient and provider.12 A simple asking-back question in the teach-back method can create the process of “interactive communication loop” enabling providers to ensure that essential health information is delivered correctly and well understood by patients or their caregivers.12⇓–14 If they demonstrate poor recall or lack of understanding, providers then repeat, clarify, or tailor the information to a format that is commonly understood (this step is known as “closing the loop”).12⇓–14 Better communication and interactions between patients and providers promote effective coping strategies and self management required for those with diabetes.12,15⇓⇓⇓⇓⇓⇓⇓–23 In this regard, the teach-back method could be promising to improve the relationship and close the loop in diabetic patient care.
Previous work has suggested that improved patient-provider relationships throughout the teach-back strategy could explain better patient health outcomes.18,23,24 For example, higher patient satisfaction and trust-building by effective interaction with health care providers would help ensure continuity of care,19⇓⇓–22 resulting in improved disease management and health outcomes (eg, less hospitalization).15⇓⇓–18 However, there is no known study to demonstrate and confirm this association in the diabetes care spectrum. Furthermore, most of the studies that documented the use of teach-back are based on pilot interventions and data having limited generalizability.25⇓–27 To address these gaps, this study sought to examine the association of teach-back with patient-reported health outcomes among individuals with diabetes. We hypothesized that diabetic patients who had teach-back experience are less likely to develop diabetes-related complications, and this would result in a reduction in hospitalization risk and health expenditures.
Research Design and Methods
Data Source
This was a retrospective, observational cohort study to evaluate the effect of having teach-back experience on health outcomes among patients with diabetes. We used data from the 2011 to 2016 Longitudinal Medical Expenditure Panel Survey (MEPS). The MEPS is administered annually by the US Agency for Health care Research and Quality and applies an overlapping panel design including 5 rounds of interviews over a span of 2 full calendar years.28,29 Specifically, each year, 2 panels are selected for the survey comprised of 1 panel in its first year (Year 1) and the other panel in its second year (Year 2) of data collection.28 In this study, we considered Year 1 survey data as the baseline period and Year 2 as the follow-up period for each panel. We used 6-year pooled MEPS longitudinal panel data (panels 16 to 20) to secure an adequate sample size and linked to Medical Conditions and Hospital Inpatient Stays Files to validate and supplement the clinical and medical events information provided by respondents in the MEPS. The University of Florida institutional review board approved this study and waived the need for informed consent because all data were retrospective and deidentified.
Study Population
The study sample included US adults aged 18 years or older with a confirmed diagnosis of diabetes (both type I and type II) without complications given that diabetic complications could interfere with treatment adherence and accurate outcome assessment.30 The study participants were identified using the Clinical Classification Code (CCC) 049. The CCC codes are based on the International Classification of Diseases, Ninth Revision, Clinical Modification (ICD-9-CM) containing more than 14,000 diagnosis codes.31 A full list of aggregated ICD-9-CM conditions and the CCC codes is presented in Appendix Table 1. We included those who had 1 or more visits to their usual source of providers (identified as family medicine, internal medicine, and general practice) and excluded those who had no visit to care since they had no interaction with health care providers. Further, patients having hospitalization in Year 1 (baseline year), history of cancer or pregnancy at the time of the survey were excluded due to the possible severity of the condition and unusual patterns of health services utilization (eg, hospitalization for delivery).15 The final study sample included 2901 (weighted sample of 10,121,276) individuals met the study inclusion and exclusion criteria. Figure 1 presents the study cohort selection process.
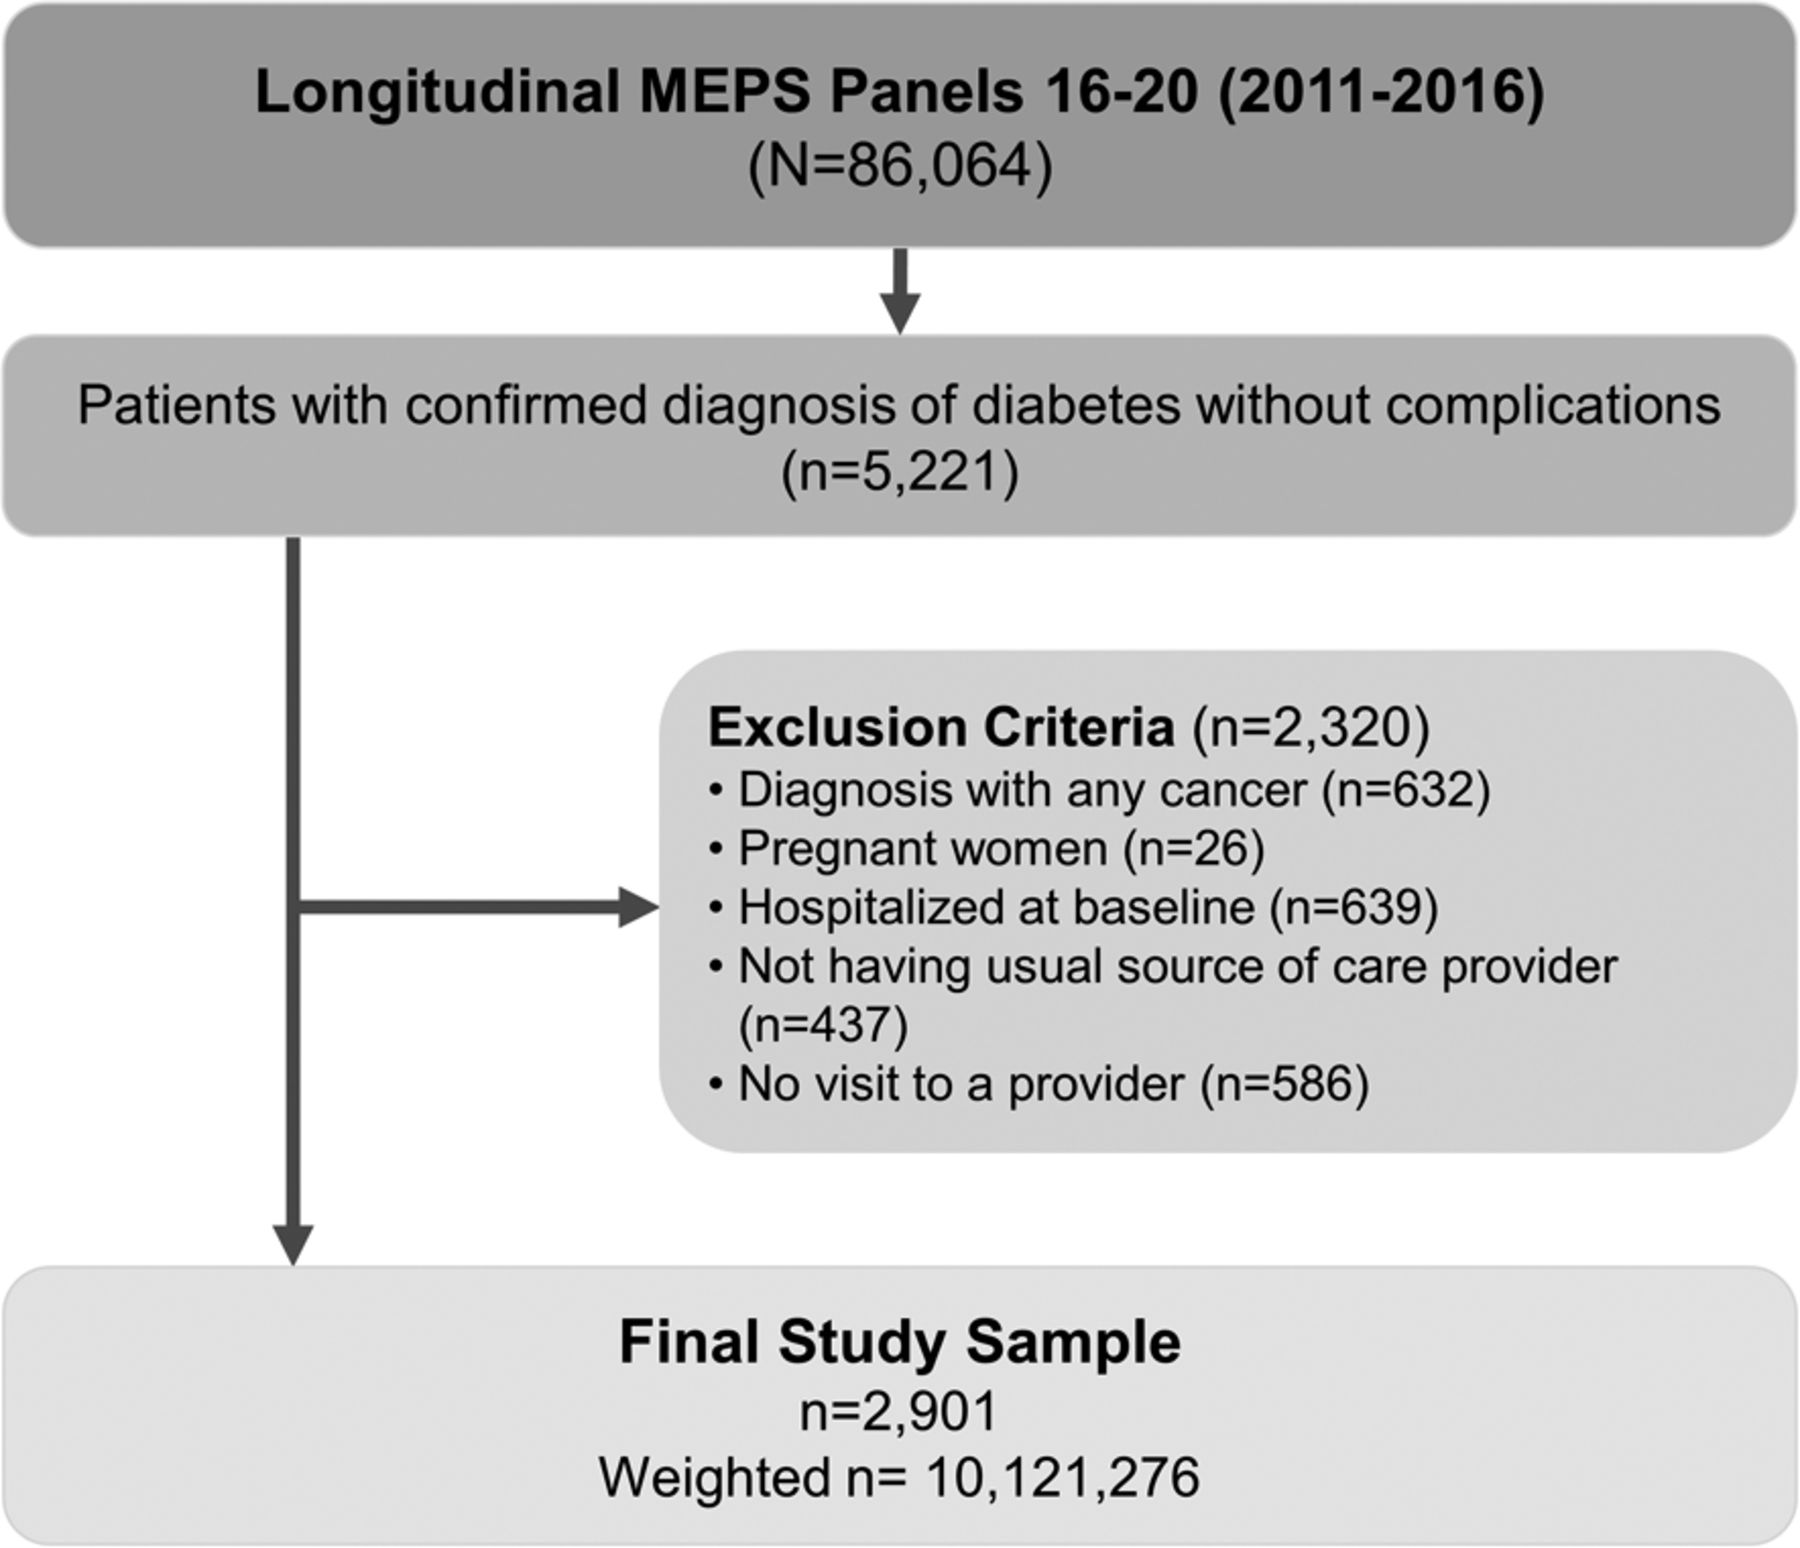
Analytic cohort selection. Abbreviation: MEPS, Longitudinal Medical Expenditure Panel Survey.
Baseline Characteristics of Study Population by Teach-Back Experience
Measures
Primary Exposure: Teach-Back Experience
The primary independent variable was the patient teach-back experience at the baseline year. Criteria and procedures to define the teach-back experience are described in detail elsewhere.15,32 Briefly, a 2-step approach was employed to identify patients with teach-back experience during their visits to any type of health care provider: 1) patients perceived instructions given from health providers to be easy to understand, and 2) those asked to describe how to follow the instructions given. The study sample included those who had 1 or more visits to their usual source of providers at the baseline year. Given that the teach-back questions were a summative assessment of all clinical encounters in the past 12 months, we made the conservative assumption that a patient received consistent teach-back only if he or she responded “always” to the questions and we defined as nonteach-back if responded otherwise.
Primary Outcomes: Complications, Hospitalization, and Health Expenditures
Primary outcomes for this study included diabetes-related complications, hospitalization, and total health expenditure. Diabetic complications included any cardiovascular disease (CVD; coronary heart disease, myocardial infarction, angina, cardiac dysrhythmias, congestive heart failure, cerebrovascular disease, and other heart diseases), eye, and kidney problems. Any diagnosis of those complications during the followup (Year 2) was measured using self-reported questions first and supplemented by medical records in the Medical Condition Files using ICD-9-CM or ICD-10-CM codes. Beginning in 2016, ICD-9-CM codes are no longer used in the MEPS and participants’ medical conditions are coded using ICD-10-CM. The study participants in the Panel 20 (2015 to 2016 cohort) were in this transition, and thus, their Year-2 outcomes were measured using corresponding ICD-10-CM codes. Hospitalization or any inpatient admission in Year 2 was measured if participants had 1 or more events (for any cause). Condition-specific admission was identified using a similar approach using ICD-9-CM or ICD-10-CM. A full list of aggregated ICD-9-CM and ICD-10-CM conditions to specify these outcomes is provided in Appendix Table 1. Total health expenditure was defined as the sum of direct payments for care provided during the year. Both Year-1 and Year-2 total expenditures were adjusted for inflation and expressed in 2017 US dollars.33
Other Covariates
Patient characteristics included self-reported sociodemographic and health-related information: age (18 to 49 years, 50 to 59 years, 60 to 64 years, 65 to 69 years, and 70+ years), sex, race/ethnicity (non-Hispanic White, non-Hispanic Black, Hispanic, and Other [Asian/Pacific Islander, American Indian/Alaskan Native, other multiple races]), foreign-born status, education (less than high school, high school diploma/general educational development), family income (based on federal poverty level [FPL] < 100% as poor income, FPL 100% to 200% as low income, FPL 200% to 400% middle income, and FPL > 400% high income), census region (Northeast, Midwest, South, and West), health insurance type (any private, public, and uninsured), general health status (poor/fair and good/excellent), and current smoking, obesity (self-reported body mass index > 29.9 kg/m2), and comorbid conditions (hypertension, hyperlipidemia, and chronic obstructive pulmonary disease, and asthma). The comorbid conditions were derived from the questions asking, “Has your doctor/health provider ever told you that you have a condition?” for each corresponding condition. Current diabetes care and treatment information were also included: whether was being treated with lifestyle modification, any medication, or insulin injections. Detailed specifications of variables and measures we used for this study are available in Appendix Table 2.
Associations between Teach-Back Experience and Patient Health Outcomes
Statistical Analysis
Survey-design adjusted Wald F tests were used to summarize study sample characteristics. Multivariable logistic models were used to determine the association between teach-back experience in Year 1 and binary outcomes, whether having complications and hospitalization in Year 2. Total expenditures were estimated using generalized linear models with log link and γ distribution to address the positive skewness of the health care cost data.34 Differences in total expenditures between Year 1 and Year 2 were then compared using ordinary least-squares regression models. The models were adjusted for all sociodemographic and clinical characteristics listed above as covariates, consistent with previous studies using MEPS.34⇓–36 All analyses incorporated longitudinal MEPS survey weights and standard errors accounted using the Taylor-series linearization method in SPSS 24 Complex Survey (IBM Corp., Armonk, NY) and SAS 9.4 (SAS Institute, Cary, NC), as recommended.29
Results
Of 2901 individuals living with diabetes (median age [interquartile range; IQR], 60 years [51 to 69 years], 52.6% female, 59.5% non-Hispanic White, median time since diabetes diagnosis [IQR], 7 years [3 to 14 years]), 25.0% (95% CI, 23.0% to 26.9%, representing 2.5 million individuals with diabetes) reported consistent patient teach-back experience at the baseline year. Overall, there was not much difference across socioeconomic and health-related characteristics between the teach-back and nonteach-back groups. However, those who were racial/ethnic minorities or immigrants were more likely to have teach-back experience (Table 1).
Diabetic Complications
During the 1-year followup, 16.8% (95% CI, 15.1% to 18.5%) study participants developed diabetic complications. Particularly, CVD accounted for more than 50% of complications developed during the study period. Compared with patients not having teach-back experience, those having teach-back had lower rates of diabetic complications: for any CVD, 6.7% versus 8.3%, for kidney problem, 3.1% versus 4.9%, and an eye problem, 5.5% versus 7.1% (Table 2). However, these differences were not statistically significant (P > .05 for all). When combined (for any complication), there was a significant difference in complications observed (14.0% vs 17.7%, P = .042). In adjusted analysis, patients with teach-back experience had a lower likelihood of developing any diabetic complication (adjusted odds ratio [AOR], 0.70; 95% CI, 0.52–0.96; P = .026) than those without teach-back.
Hospitalization
Overall, 6.5% (95% CI, 5.4% to 7.7%) of patients were hospitalized for any reason during the 1-year followup. Although patients with teach-back experience had a lower likelihood of hospitalization (AOR, 0.72; 95% CI, 0.47–1.09) than those without, this difference did not reach statistical significance (P = .123) (Table 2). Similarly, for diabetes-specific hospitalization, having teach-back experience was not associated with the likelihood of hospitalization (AOR, 0.58; 95% CI, 0.29–1.14; P = .112). However, those with teach-back experience had a lower likelihood of being hospitalized for diabetic complications, mostly for CVD-related (AOR, 0.51; 95% CI, 0.29–0.88; P = .015).
Health Expenditures
During the study period, the unadjusted average total health expenditures of the study population increased by 48.2% from the mean annual expenditure of $8491 at the baseline to $12,581 in the follow-up year. This increase of $3090 was largely driven by hospitalization events ($2592 per patient, $20,088 per episode of hospitalization) and prescription drugs ($911 per patient; data not shown). Table 3 shows the changes in adjusted total expenditures for patients with teach-back experience relative to their counterparts. In the follow-up year, those having teach-back experience had a significantly smaller increase in adjusted total expenditures of $1920 (95% CI, $1660 to $2178) compared with those not having teach-back of $3639 (95% CI, $3466 to $3812; a differential change of −$1579 [95% CI, −$1717 to −$1443]; P < .001). When extrapolated based on the study population estimates (10.1 million patients with diabetes), these differences translate into aggregate potential savings of $11.9 (95% CI, $10.9 to $13.0) billion from the teach-back implementation in diabetes care.
Differential Changes in Adjusted Total Medical Expenditure by Teach-Back Experience
Discussion
Using the nationally representative sample of patients with diabetes, we found that patients with teach-back experience were less likely than those without to develop diabetic complications and have hospital admissions related to those conditions. We hypothesize patient teach-back experience may have improved their comprehension of the condition and management skills. These improvements may result in reduced risks for complications and related-hospitalizations and ultimately leading to a reduction in health expenditures. Previous studies demonstrated that the teach-back intervention reduced the hospitalization risk by 12% to 36% among patients with other chronic conditions (eg, heart failure).15,16 Evaluating the differential increase in total expenditures during the study period between the teach-back and control groups indicates that, with continuous teach-back use, $1443 to $1717 could be saved for a patient diagnosed with diabetes without complications. Full implementation of teach-back communication in the current diabetes care would generate annual savings of $11.9 billion (by multiplying the estimated 10.1 million with missed opportunity). These estimates are comparable or slightly greater than the potential annual savings from eliminating medication nonadherence ($10.1 in 2017 USD) among all patients with diabetes.37
Our findings provide a valuable reference that can be used to strengthen patient education in practice and public health education in various settings. We hope to raise more awareness of the importance and effectiveness of the teach-back among medical school boards, primary care providers, and health educationists.26,27 The key impact of teach-back links the implication of effective patient-provider communication and its benefits during the delivery of care and patient disease management. Diabetes is the most common chronic condition and precursor to CVDs and many cancers, top leading causes of death in the United States.3⇓⇓–6 The disease requires patients to actively self manage the condition in their everyday lives. For this reason, the ability to effectively use health information and health care services is of great importance; most importantly, effective patient self-management is closely related to health literacy and their understanding of the condition and treatment.7⇓⇓⇓–11 However, there has been a longstanding issue of the disconnect between what delivered in a clinic and what a patient actually does at home. Health care providers, especially in primary care settings, should play a key role in assisting patients and their caregivers in developing their ability to perform self-care management and be successful across the continuum of care. Implementing teach-back as a standard of care and applying to other chronic disease management could hold great promise in improving the overall quality of care delivered and patient population health. Future research should further investigate patient characteristics that can reflect their ability (eg, health literacy) or barriers (eg, patient perception and attitude toward teach-back) to effective communication with providers.
Findings from this study also have some implications for policy makers and other stakeholders involved in designing value-based programs. The value-based program models are designed to incorporate patient-centered outcomes to improve the quality of care and incentivize providers in a reliable and effective way.38⇓–40 The present study found that the teach-back method during the interaction between a patient and provider achieved favorable patient outcomes. However, only 25% of the patient population with diabetes had consistent teach-back experience during their visits to care. This information would lend insight into guidelines for clinical practice and highlight the need to include “value-added” clinical processes like teach-back communication and patient-provider interaction quality, given a significant link between clinical process and patient outcomes when evaluating performance. If the teach-back implementation is adopted as one of the care process measures, the overall increase in patient-provider interaction quality and patient satisfaction should be achieved effectively and linked to subsequent favorable health outcomes.23,27 Wider adoption of teach-back or analogous strategy (eg, a follow-up assessment to ensure shared understanding between provider and patient), including standard practice guidelines to promote and incentivize its use, would be promising for both providers and patients in the delivery of care.
There are limitations to this study and caution is required for interpretation of the study findings. First, in the nature of secondary data analysis, we were not able to capture and control for other unmeasured (or unmeasurable) factors that might have caused residual confounding. For example, clinical measures (eg, Hemoglobin A1c control) and quality performance during teach-back (eg, length of teach-back time, question quality, provider attitude and behaviors) were not measurable in the given dataset. How teach-back was performed and in what settings can be valuable information given that care delivery by a provider who is more congruent with clinical guidelines tend to be more patient centered and involves superior communication with a patient. How interactive the communication actually was between patient and provider would be critical to further assess the effectiveness of teach-back implementation. In the same vein, the use of teach-back communication may be subject to selection bias. For example, primary care practices embedded in large health care systems may have more resources for training providers and may also have more resources to implement other aspects of patient-centered care that impact outcomes for their patients. Future research with a more rigorous experimental study design is warranted to control for these possible confounders and confirm the study findings. Third, although the study follow-up period may be too short of capturing diabetes-related complication development, longer duration of diabetes (median, 7 years; IQR, 3 to 14 years) among study participants may have led us to overestimate complication rates during the study period. Forth, given the MEPS sampling design, the findings from this study may not be generalizable to those institutionalized populations (eg, nursing homes, rehabilitation centers, and other long-term facilities). Fifth, patient medical records were obtained from supplementary medical conditions, prescription drug, and inpatient stay data files that were verified from providers and insurers the MEPS respondents used.28 However, excessive missing values and unavailability of full ICD-9 and 10 codes (eg, full 5 digits for ICD-9 and 7 digits for ICD-10) are frequently cited limitations of analyzing the MEPS data. Some discrepancies in patient records between national surveys and claims data have also been reported.41 Lastly, the majority of information in the MEPS was based on patient self-reported data, which is subject to response and recall biases.
In summary, teach-back is a simple communication technique to confirm patient understanding by a follow-up assessment asking about what they were told or discussed during their visit to care. Patients with diabetes who reported teach-back experience were less likely to develop diabetic complications, reducing the risk for condition-related hospitalization and total health expenditures. However, patient teach-back is a substantially underused strategy in primary care for those with diabetes, suggesting considerable missed opportunities to enhance the quality of care. For those who are eager to deliver true patient-centered care in practice, it is important to recognize the potentials of this simple assessment during a visit to care for improving patient experience, compliance to treatment, and health outcomes. To establish and maintain an effective, therapeutic patient-provider relationship is the key to success under the ongoing health reform. Further effort is needed to expand and incorporate the teach-back method in the delivery of diabetes care.
Appendix A. Identification of Medical Conditions
AHRQ Clinical Classification Category (CCC) and ICD-9 and 10-CM Codes Defining Medical Conditions
Appendix B. STUDY Variable Operationalization
Descriptions of Study Variables
Notes
This article was externally peer reviewed.
Conflict of interest: None.
Funding: None.
Author contributions: YRH and AGM contributed to the study design, methods, and discussion; performed the statistical analyses; interpreted the data; and drafted and revised the manuscript. JH, AJ, and MC contributed to the study design, methods, and discussion; interpreted the data; and reviewed and edited the manuscript.
To see this article online, please go to: http://jabfm.org/content/33/6/903.full.
- Received for publication May 12, 2020.
- Revision received July 15, 2020.
- Accepted for publication July 20, 2020.


