
Article Figures & Data
Figures
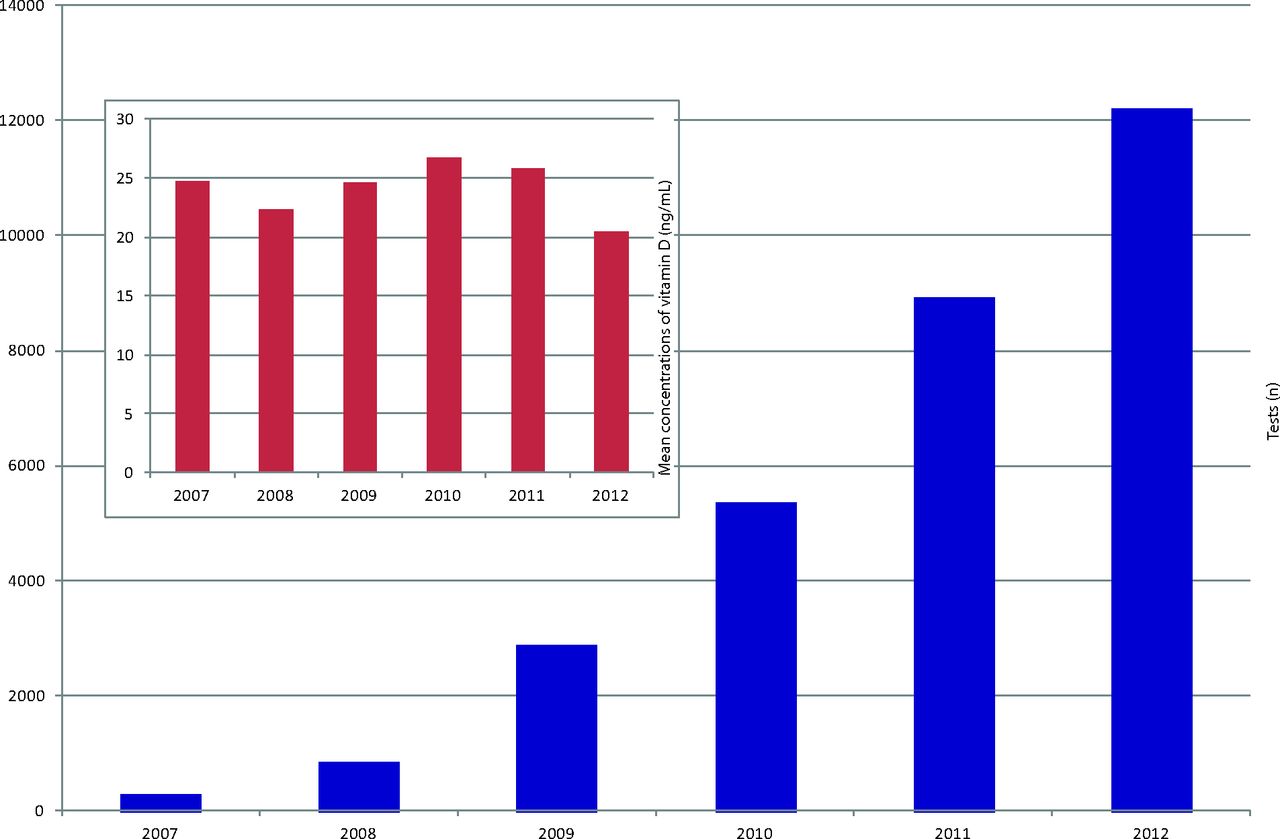
- Figure 1.
Annual volume of 25-hydroxyvitamin D testing and mean serum concentrations of 25-hydroxyvitamin D in each year. The year-to-year changes in the mean concentrations (inset) of 25-hydroxyvitamin D are statistically significantly different (P < .05). The testing volume increased from <300 to >12,000 per year without any improvement in the outcome of average serum concentrations of 25-hydroxyvitamin D, despite the providers' prescription being in keeping with recommended doses of vitamin D, suggesting that the recommended doses were inadequate.
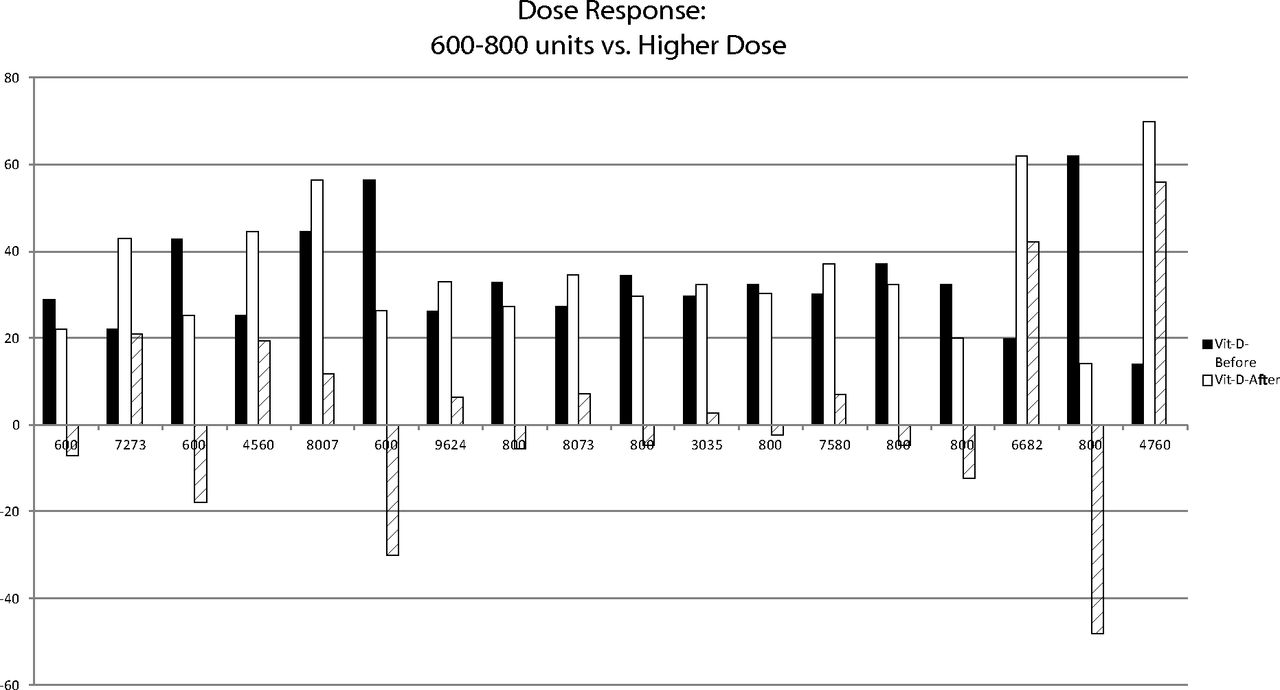
- Figure 2.
Dose response in a patient. The graph displays the starting concentration (black), end concentration (white), and change (diagonal lines) in 25-hydroxyvitamin D concentration in one patient given the recommended doses of 600 to 800 IU/day interspersed with treatment with higher doses. Doses administered are given below each episode of treatment. In this purposely selected nursing home patient, each episode of treatment with the Geriatric Society–recommend dose resulted in decline in serum 25-hydroxyvitamin D concentration, and each episode of treatment with a higher dose increased the serum concentration of 25-hydroxyvitamin D, suggesting that the Geriatric Society–recommended dose was inadequate. The patient was admitted to the nursing home at the age of 47 with a 10-year history of multiple sclerosis and had paraplegia, urinary retention with repeated infections, fecal incontinence, pressure ulcers, gastroesophageal reflux, type 2 diabetes mellitus, body mass index of 29.8 kg/m2, rheumatoid arthritis, lactose intolerance, hypertension, hyperlipidemia, history of vitamin B12 and folate deficiency, depression, degenerative joint disease, and dysphagia with risk of aspiration. She made multiple attempts to live at home but was readmitted and developed heart failure and experienced episodes of renal and respiratory failure often associated with sepsis. She died at the age of 54 due to progressive heart failure.


Tables
- Table 1. Number of Tests for Serum 25-Hydroxyvitamin D and Serum Concentrations of 25-Hydroxyvitamin D
Year Serum 25-Hydroxyvitamin D Concentration (ng/mL) Total Tests (n) <12 <20 <30 >150 2007 17.24 48.62 71.38 0.34 290 2008 21.04 47.4 75.77 0 846 2009 16.65 39.01 69.19 0 2,889 2010 15.53 35.55 63.27 0.04 5,358 2011 16.81 38.15 65.14 0.02 8,910 2012 33.11 60.83 82.22 0.07 12,194 Data are percentages unless otherwise indicated. The number of serum 25-hydroxyvitamin D tests done increased from 290 in 2007 to 12194 in 2012. The percentage of patients with serum concentrations of 25-hydroxyvitamin D <12, 20, 30 or >150 ng/mL did not change appreciably. If anything the serum25-hydroxyvitamin D concentrations decreased during the period of observation, again attesting that patients were undertreated.
- Table 2. Average (Median) Daily Doses of Vitamin D (IU/day) and Changes in Serum 25-Hydroxyvitamin D Concentrations after Treatment
Population Average Dose ± Standard Deviation (Median) Decrease or No Increase Any Increase Increase ≥10 ng/mL All 1907 ± 1771 (1000) 4707 ± 3856 (4000) 5682 ± 4323 (4800) Ambulatory 2154 ± 1716 (2000) 4229 ± 3637 (3976) 5092 ± 4092 (4000) Nursing home 1427 ± 1709 (800) 6103 ± 4131 (5448) 7574 ± 4505 (6597) An average daily dose of about 2000 IU/day did not register a positive change in serum concentrations of 25-hydroxyvitamin D. Doses of about 4000 to 7000 IU/day were needed for meaningful increases in serum concentrations of 25-hydroxyvitamin D. The observed doses that resulted in positive changes in serum concentrations of 25-hydroxyvitamin D are far greater than the doses recommended by national agencies.
- Table 3. Average Responses of Various Subsets of Patients to Average Daily Doses of Vitamin D Treatment
Population Patients (n) Observations (n) Average Dose (IU/day) Average Concentration (ng/mL) Concentration <30 ng/mL (%) Before Treatment After Treatment Before Treatment After Treatment Total 1327 3885 3588 25.2 30.5 68.5 55.3 Ambulatory 1183 2763 3460 22.4 29.1 75.7 61.1 Women 839 1947 3494 22.5 29.1 76 62.0 Men 344 816 3375 22.4 29.2 74.9 59.1 Nursing Home 144 1122 3907 32.2 34.1 47.1 41.0 Women 104 820 2902 32 33.9 48.8 42.4 Men 40 302 3918 32.5 34.4 42.7 37.1 The average increase in serum concentrations of 25-hydroxyvitamin D, with an average dose of 3588 IU/day, for the whole population (total observations = 3885) was 5.3 ng/mL.
- Table 4. Regression Coefficients Predicting Change in Serum 25-Hydroxyvitamin D Concentration: Full and Reduced Models for All Patients and All 3885 Observations
B P Value 95% Confidence Interval Lower Upper Full model Age 0.092 <.001* 0.05 0.13 Sex 0.647 .269 −0.50 1.8 BMI −0.200 <.001* −0.26 −0.14 Nursing Home 1.390 .057 −0.04 2.82 Albumin 1.457 .013* 0.28 2.44 Creatinine −0.462 .209 −1.18 0.26 Dose of vitamin D 0.002 <.001* 0.002 0.002 Starting vitamin D −0.615 <.001* −0.65 −0.58 Constant 7.838 .008* 2.02 13.66 Reduced model Age 0.074 <.001* 0.04 0.11 BMI −0.202 <.001* −0.26 −0.14 Albumin 1.739 .001* 0.73 2.75 Dose of vitamin D 0.002 <.001* 0.002 0.002 Starting vitamin D −0.622 <.001* −0.66 −0.59 Constant 8.521 .003* 2.86 14.18 ↵* Statistically significant (P < .05).
BMI, body mass index.
- Table 5. Regression Coefficients Predicting End (after Treatment) Serum 25-Hydroxyvitamin D Concentration
B P Value 95% Confidence Interval Lower Upper Full model Age 0.092 <.001* 0.05 0.13 Sex 0.616 .293 −0.53 1.77 BMI −0.201 <.001* −0.26 −0.14 Nursing home 1.349 .065 −0.08 2.78 Albumin 1.378 .012* 0.30 2.46 Creatinine −0.467 .205 −1.19 0.26 Dose of vitamin D 0.002 <.001* 0.002 0.002 Starting vitamin D 0.384 <.001* 0.35 0.42 Constant 7.853 .008* 2.03 13.68 Reduced model Age 0.074 <.001* 0.04 0.11 BMI −0.203 <.001* −0.26 −0.15 Albumin 1.749 .001* 0.74 2.76 Dose of vitamin D 0.002 <.001* 0.002 0.002 Starting vitamin D 0.074 <.001* 0.04 0.11 Constant −0.203 <.001* −0.26 −0.15 Full and reduced models for all patients and all 3885 observations are included.
↵* Statistically significant (P < .05).
BMI, body mass index.
Ambulatory Nursing Home P Value No. Mean (SD) No. Mean (SD) Age* 2763 56.0 (12.8) 1122 73.1 (14.1) <.001† BMI 2763 33.4 (8.9) 1122 30.4 (9.1) <.001† Vitamin D concentration Start* 2763 22.4 (15.1) 1122 32.2 (13.8) <.001† End* 2763 29.1 (19.8) 1122 34.1 (13.8) <.001† Change 2763 6.7 (21.5) 1122 1.9 (19.8) <.001† Dose* 2763 3458.2 (3228.7) 1122 3906.6 (3997.8) .018† Creatinine* 2754 1.17 (0.77) 1122 1.00 (0.62) <.001† Albumin* 2735 3.8 (0.5) 1118 3.3 (0.5) <.001† Sex‡ Female 1947 (70.5) 820 (73.1) .113 Male 813 (29.5) 302 (26.9) - Table 7. Comparison of Starting Serum Levels of 25-Hydroxyvitamin D and Average Doses Resulting in Decrease or No Increase, Any Increase, or Increase of ≥10 ng/mL between Races
White Black Other Patients (n) 710 521 96 Episodes (n) 2227 1385 273 Results of average dose (mean ± SD) Decrease or no change 1995 ± 1830 1774 ± 1689 1868 ± 1646 Any increase 4827 ± 3865 4540 ± 3781 4554 ± 4107 Increase of ≥10 ng/mL 5760 ± 4362 5539 ± 4216 5744 ± 4536 25-hydroxyvitamin D serum concentration (ng/mL) at start of treatment episode 25.5 ± 15.0 25.3 ± 15.9 23.0 ± 14.8 The differences between the races do not seem to be clinically meaningful.
SD, standard deviation.
In this issue


Jump to section
Related Articles
Cited By...
- Interpretating Normal Values and Reference Ranges for Laboratory Tests
- A Phase 1 Study of Oral Vitamin D3 in Boys and Young Men With X-Linked Adrenoleukodystrophy
- Vitamin D supplementation: Pearls for practicing clinicians
- Probability of Vitamin D Deficiency by Body Weight and Race/Ethnicity
- Vitamin D as Supplemental Therapy for Pneumocystis Pneumonia
- Content Usage and the Most Frequently Read Articles of 2014
- Re: A Predictive Equation to Guide Vitamin D Replacement Dose in Patients
- Context and Trade-offs in Family Medicine