
Abstract
Background: Family medicine is a specialty of breadth, providing comprehensive health care for the individual and the family that integrates the broad scope of clinical, social, and behavioral sciences. As such, the scope of practice (SOP) for family medicine is extensive; however, over time many family physicians narrow their SOP. We sought to provide a nationally representative description of the most common and the most critical diagnoses that family physicians see in their practice.
Methods: Data were extracted from the 2012 National Ambulatory Medical Care Survey (NAMCS) to select all ICD-9 codes reported by family physicians. A panel of family physicians then reviewed 1893 ICD-9 codes to place each code into an American Board of Family Medicine Family Medicine Certification Examination test plan specifications (TPS) category and provide a rating for an Index of Harm (IoH).
Results: An analysis of all 1893 ICD-9 codes seen by family physicians in the 2012 NAMCS found that 198 ICD-9 codes could not be assigned a TPS category, leaving 1695 ICD-9 codes in the dataset. Top 10 lists of ICD-9 codes by TPS category were created for both frequency and IoH.
Conclusions: This study provides a nationally representative description of the most common diagnoses that family physicians are seeing in their practice and the criticality of these diagnoses. These results provide insight into the domain of the specialty of family medicine. Medical educators may use these results to better tailor education and training to practice.
- Ambulatory Care
- Behavioral Sciences
- Certification
- Comprehensive Health Care
- Family Physicians
- Health Care Surveys
- International Classification of Diseases
Family medicine is a specialty of breadth, providing comprehensive health care for both the individual and the family that integrates the broad scope of clinical, social, and behavioral sciences.1 As such, the scope of practice (SOP) for family medicine is extensive. Generally speaking, the scope of the specialty has been characterized by the Accreditation Council for Graduate Medical Education training requirements2 and the American Board of Family Medicine (ABFM) certification examination blueprint.3
Although family physicians are trained to address a wide variety of medical problems, over time many family physicians narrow their SOP. Currently, fewer family physicians are providing obstetric care4, women's health5, and pediatric care6 than they have in the past. Narrowing of a physician's SOP can occur for a variety of reasons, such as needs of the community, physician preference, or employer requirements.
In some cases, a physician may have narrowed his or her SOP while still believing she or he predominantly practices full-scope family medicine. Cognitive psychology describes a phenomenon called the Availability Heuristic7, which causes people to make judgments about the likelihood of an event based on how easily an example comes to mind. Being able to easily recall a few patients who seemingly represent full-spectrum care would make a physician believe she or he is practicing full-spectrum care when, in fact, she or he is not. The availability of information in memory also underlies the Representativeness Heuristic.8 With the Representativeness Heuristic, people judge the probability of an event belonging to a certain class based on the degree to which the event resembles the class; however, this neglects the probability of the class occurring in the first place. Physicians also change practice patterns and scope gradually so changes in their SOP are not noticeable, unless they have a method to benchmark their practice against a standard. It would be helpful for these physicians to have information about the domain of family medicine that they could compare with their own practice to get a more accurate picture of their individual SOP.
Furthermore, it would be helpful for medical educators in family medicine to have accurate information about the domain of family medicine to more fully target their training to reflect the conditions that their residents will be expected to treat once they are no longer under the residency program's supervision. Finally, in constructing an examination designed to certify family physicians, it is critical that the construct adequately, accurately, and fairly assess the domain of family medicine.
The National Center for Health Statistics conducts the National Ambulatory Medical Care Survey (NAMCS) annually.9 NAMCS is a large, representative, national sample survey that provides information about ambulatory care delivered in the United States. This publicly available dataset includes the physician reported International Classification of Diseases, Ninth Revision, Clinical Modification (ICD-9)10 codes for each patient visit in the sample and permits stratification by physician specialty. This dataset is well suited to describing the patient visits commonly seen by family physicians.
Using the NAMCS dataset, this article will provide a nationally representative description of the types of diagnoses that were seen by family physicians in ambulatory care settings in 2012 and estimates of the prevalence of those diagnoses. To supplement this perspective, an indicator of the degree of harm that would be caused by misdiagnosing or incorrectly treating each diagnosis was derived from ratings made by a panel of family physicians. Because of the large number of ICD-9 codes available, it may be of some utility to aggregate them into clinically relevant categories. We chose to use the ABFM's Family Medicine Certification Examination (FMCE) test plan specifications (TPS) because approximately 85% of active family physicians are certified by the ABFM11, making it quite possibly the most widely applicable framework available.
Methods
Design
This study used the 2012 NAMCS data to identify ICD-9 codes that were reported by family physicians. These ICD-9 codes were included on a survey that was administered to physicians so that the ICD-9 codes could be linked to the ABFM's FMCE TPS categories. Each ICD-9 code was either linked to a TPS category or excluded for being too vague. NAMCS provides a weight for each visit in the sample (called a patient weight), allowing for the calculation of the frequency with which each ICD-9 was reported in the population. The top 10 most frequently seen ICD-9 codes for each TPS category are reported. In addition, the survey also asked the physicians about the likely degree of harm that would be caused by misdiagnosing or incorrectly treating the ICD-9 code. This information was transformed into an Index of Harm (IoH) scale.
NAMCS Data
The sampling frame for the 2012 NAMCS was composed of all physicians contained in the American Medical Association and the American Osteopathic Association master files who were office based; principally engaged in patient care activities; nonfederally employed; not in the specialties of anesthesiology, pathology, and radiology; and younger than 85 years of age at the time of the survey.
The 2012 NAMCS sample included 15,740 physicians: 14,931 allopathic physicians and 809 osteopathic physicians. Physicians included in the sample were screened at the time of the survey to assure that they met the above-mentioned criteria. A total of 6166 physicians did not meet all the criteria and were ruled ineligible for the study. Of the 9,574 eligible physicians, 3,583 participated in the NAMCS survey. For these, data were collected for 76,330 visits, either by a NAMCS representative (74,647 visits) or by physicians or their staffs (1,683 visits).12
We restricted our sample to those physicians whose self-identified specialty was family practice or general practice, as defined by NAMCS. Of the 76,330 Patient Record Forms (PRF) and 3,583 physicians, there remained 12,897 PRFs provided by 551 physicians following the implementation of the inclusion criterion. NAMCS contains a patient weight estimate that is used to obtain visit estimates from the survey data. By aggregating the patient weights, we are able to obtain estimates for the approximately 928,629,953 office visits made in the United States in 2012. Subsequent analyses were based on this dataset.
Panelists
An invitation was sent to 100 ABFM-certified family physicians from the greater Minneapolis, MN area to participate in a 1-day panel to review a sample 800 ICD-9 codes from a relevant population of 1893 ICD-9 codes. There were 27 physicians who accepted the invitation and 21 participated. The exercise lasted a single day and the panelists were provided an honorarium to acknowledge their contribution.
Instrumentation
Survey Content
A master survey was created using the ICD-9 codes that were reported by the physicians in the NAMCS sample for each patient visit; in aggregate, 1893 unique ICD-9 codes were reported. Given that the purpose of the survey was to connect the ICD-9 codes with the ABFM's FMCE TPS categories as a framework for understanding the domain of family medicine, panelists were asked to assign each ICD-9 code to 1 of the 16 FMCE TPS categories: Respiratory, Cardiovascular, Musculoskeletal, Gastrointestinal, Special Sensory (visual, hearing, etc.), Endocrine, Integumentary, Neurologic (brain, spinal cord, peripheral nervous system), Psychogenic (psychological, behavioral, mental health), Reproductive (male), Reproductive (female), Nephrologic, Hematologic/Immune, Nonspecific, Population-Based Care and Health Systems, and Patient-Based Care and Systems.
In addition to providing a TPS category for each ICD-9 code, panelists were also asked to answer, “How critical is the diagnosis and treatment of this condition?” using a 4-point Likert-type rating scale (Minimally, Moderately, Somewhat, Very). These data were used to create an Index of Harm (IoH) scale.
Survey Data Collection Design
Because asking panelists to review all 1893 ICD-9 codes from the master survey would be burdensome and time consuming, each panelist was asked to review only a subset of the codes. To accomplish this, the 1893 ICD-9 codes were grouped into blocks of 100 and staggered to implement a sampling strategy that assigned these blocks of ICD-9 codes to panelists such that each code was rated by as few as 6 or as many as 12 panelists (Figure 1). Each panelist received 400 codes in the morning and 400 in the afternoon. The survey was also designed to provide overlap of ICD-9 codes across raters to ensure that adjustments of rater severity applied to the IoH would be from the same frame of reference (Figure 1).13,14 Furthermore, the IoH was estimated using the Rasch measurement15 Rating Scale Model16,17, which we used to adjust for the severity of the individual raters. It is important to note that Rasch models are robust to missing data, so the incomplete data design is not problematic when the overlap is sufficient to establish connectivity.
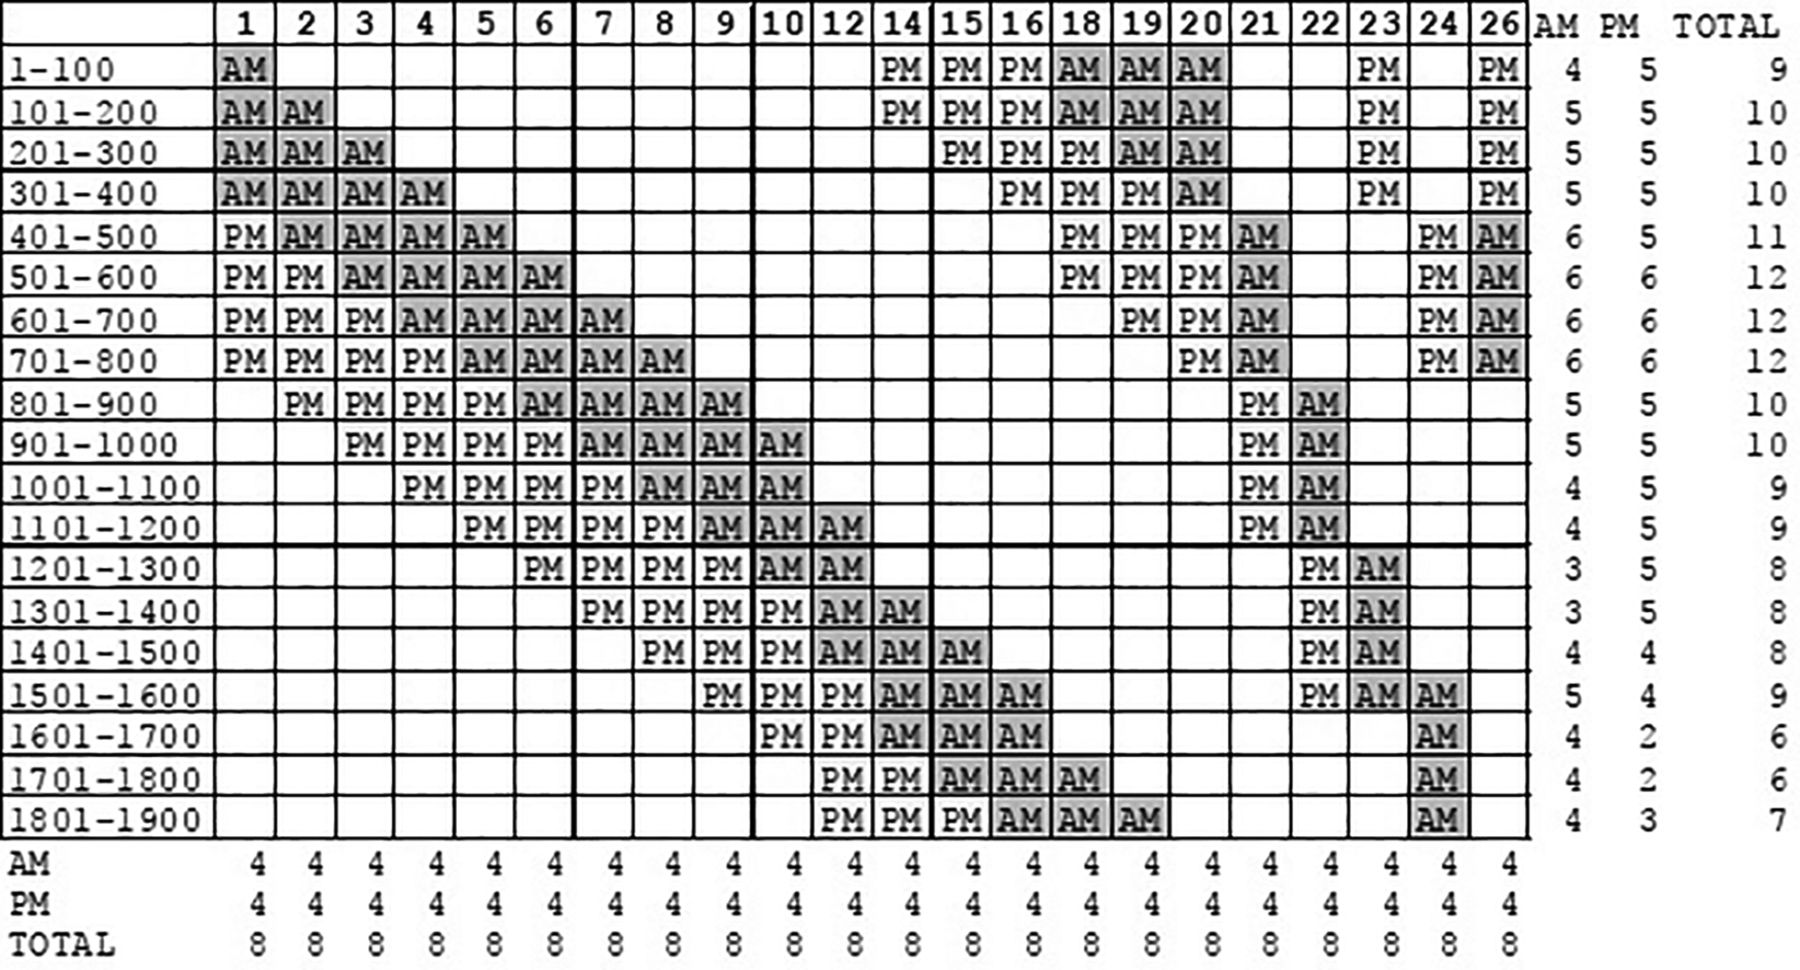
Data collection matrix by rater ID number, 100 item International Classification of Diseases, Ninth Revision (ICD-9) code block, and morning/afternoon schedule designed to ensure overlap of ratings for connectivity.
Analysis
Panel Review
To determine the category into which an ICD-9 code should be classified, the panelists' individual classifications were aggregated. For each ICD-9 code, if the total percentage of ratings for any single category was greater than or equal to 70% then that ICD-9 code was determined to have a sufficient level of agreement among the panelists to be classified in that category. The 70% consensus threshold was selected because the threshold had to be greater than 50% to establish that it was the dominant choice, but expecting 100% consensus in all cases seemed unreasonable. Furthermore, some codes were rated by as few as 6 or 7 panelists. Under these conditions the granularity of percentage in agreement becomes very coarse. With 6 raters, the possible choices are: 67% or 83% agreement. With 7 raters, the possible choices are: 57%, 71%, or 86% agreement. We chose 70% agreement as a compromise between being theoretically acceptable and technically manageable.
Committee Review
Those ICD-9 codes that did not achieve TPS category classification consensus among the panelists were reviewed by the ABFM Examination Committee using the same instrument and method; however, an additional category of “Too Vague to be Useful” was added. The same 70% consensus threshold was applied and any ICD-9 code that did not achieve a consensus rating in this review was removed from the final analysis.
Frequencies
After receiving a final category classification following the ABFM Examination Committee review, the prevalence of each ICD-9 code was examined by conducting frequency counts using the patient weights to estimate the number of visits nationally that were attributable to each ICD-9 code. Because NAMCS allows up to 3 ICD-9 codes to be entered for any single visit, we counted each ICD-9 code occurrence as a separate instance rather than try to control for co- and multi-morbidities.
IoH
The IoH for each ICD-9 code was estimated using a Rasch Rating Scale Model. More specifically, the probability of panelist n with a severity of β placing ICD-9 code i with a degree of harm δ into category x as:
 (1) where the categories are ordered from 0 to m, and τk are the rating scale structure parameters (“Rasch thresholds”). In the Rasch Rating Scale Model, the same rating scale structure is imposed across all ICD-9 codes. Winsteps Rasch Measurement Calibration software version 3.92.1 (Beaverton, OR) was used to calibrate these parameters using the panelists' data.
Because the Rasch model uses logits as its unit of measure, the logit calibrations were linearly transformed to have a minimum value of 0 (actually 0.1, near 0) for the lowest IoH score and 100 for the highest IoH score to improve the understandability of the measure using the formula:
 (2)
(2)
We examined data-model fit using outlier-sensitive standardized fit statistics (OUTFIT ZSTD), which are normally distributed z-scores showing the improbability of the data if the data were to fit the model perfectly.18 OUTFIT ZSTD values above 2.0 are typically considered to be too unpredictable and values below −2.0 are generally considered to be too constrained.19 In addition, summary statistics for a person reliability and item reliability are provided.20,21
Results
Panel Review
Of the 1893 ICD-9 codes, 1446 (76.4%) had a single category for which the number ratings met or exceeded 70% of the total ratings, and were subsequently classified as having reached consensus regarding the appropriate classification category. Each of these ICD-9 codes received at least 4 ratings and as many as 13 ratings. Although panelists were instructed to assign each ICD-9 code to only 1 category, there were 26 instances in which a panelist provided multiple categories; these were allowed to stand and the consensus percentage was calculated by the number of ratings not the number of panelists.
Committee Review
The ABFM Examination Committee reviewed the 447 ICD-9 codes that did not achieve a consensus rating. The ABFM Examination Committee was not able to reach the 70% consensus level for 85 codes, which were removed from the final dataset. The ABFM Examination Committee also determined that an additional 113 ICD-9 codes did not provide any meaningful information, which were also removed from the final dataset. Following this review, 1695 ICD-9 codes were assigned a final category classification and can be found in online Appendix A. A list of the 198 ICD-9 codes removed from the final dataset can be found in online Appendix B.
Frequencies
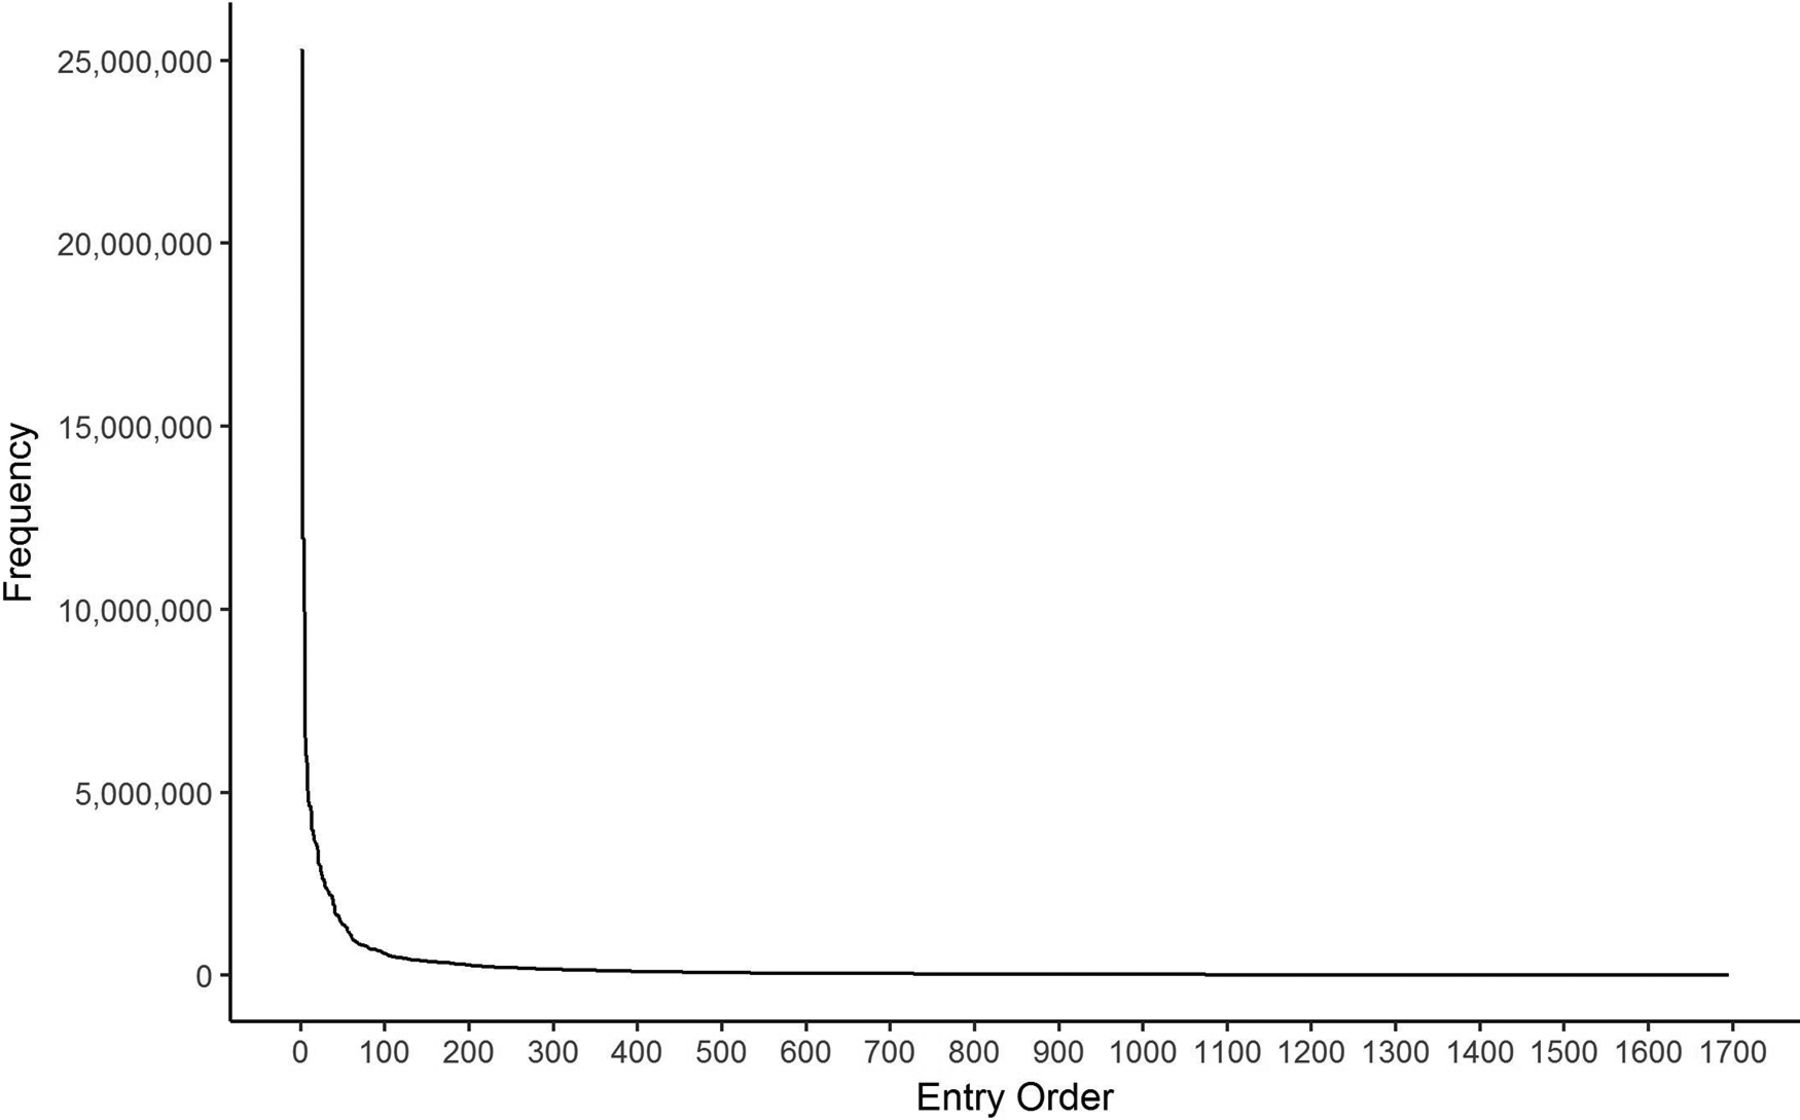
Estimates of the number of annual visits for each ICD-9 code were calculated using the patient weights in the NAMCS dataset. The 10 most frequently occurring ICD-9 codes assigned to each TPS category are provided in Table 1. Overall, Unspecified essential hypertension (4019), Other and unspecified hyperlipidemia (2724), and Diabetes mellitus w/o complication (25000) were the most frequently seen diagnoses. The distribution of diagnosis frequency can be seen in Figure 2, which shows that there are approximately 100 diagnoses that family physicians see often and then a lot of infrequently seen diagnoses.
Top 10 ICD-9 Codes for Each TPS Category by Weighted Frequency

Distribution of International Classification of Diseases, Ninth Revision (ICD-9) codes by frequency.
IoH
The ICD-9 codes with the 10 highest (i.e., most critical) IoH scores assigned to each TPS category are also provided in Table 2. Overall, Systolic heart failure (42821), Diabetes with other coma (25032), and Unspecified intracranial hemorrhage (4329) were found to have the highest IoH scores. The mean IoH score was 46.6 with a standard deviation of 14.5, which approximates a normal distribution about the mean. The mean OUTFIT ZSTD was −0.2 with 173 ICD-9 codes (9.1%) showing an OUTFIT ZSTD value above 2.0 and 103 (5.4%) below −2.0. Person reliability was 0.99 and item reliability was 0.86. There were 15 instances in which a panelist provided multiple IoH category ratings for a single ICD-9 code; these were classified as missing.
Top 10 ICD-9 Codes for Each TPS Category by IoH
Discussion
Using a national probability survey of patient visits for office-based family physicians and a panel of family physicians to rate ICD-9 codes for IoH, we were able to examine both the frequency with which diagnoses were seen by family physicians and identify those diagnoses that occur less frequently but have high IoH scores in clinical practice.
The NAMCS data allows us to more accurately describe the breadth of family medicine. As seen in Figure 2, there are approximately 100 diagnoses that family physicians see frequently in office visits and an additional 1600 diagnoses that are seen less often but still occur in office-based visits. Although some diagnoses are seen rarely, they are still important to the SOP of family physicians. The IoH attempts to describe the degree of harm that would be caused by misdiagnosing or incorrectly treating a specific ICD-9 code. For example, “Acute myocardial infarction of other anterior wall, initial episode of care (41011)” received an IoH score of 93, which was the 10th highest of all ICD-9 codes; however, it had the second lowest frequency of any diagnosis. This would seem to represent a diagnosis that although rarely seen is an important aspect of the scope of the domain of family medicine.
Individual physicians should be able to use tables 1 and 2 to examine whether their SOP mirrors that of the domain of family medicine while blunting the effects of the Representativeness Heuristic. However, they will still need to accommodate the Availability Heuristic by performing a record review or some other kind of objective analysis rather than relying on their own memory.
Because of the large number of ICD-9 codes, it made sense to aggregate the codes into a common framework using the ABFM FMCE TPS categories. Table 1 provides the top 10 ICD-9 codes by frequency and table 2 provides the top 10 ICD-9 codes by IoH. By using the TPS categories, medical educators may find common themes that would aid in curriculum development and targeting training to practice. For instance, it is likely that during training a resident would encounter the most frequently seen ICD-9 codes in the Cardiology TPS category, such as hypertension, hyperlipidemia, edema, and atrial fibrillation (see Table 1). However, residents may be less likely to encounter some of the conditions with high IoH scores that occur less frequently, such as acute myocardial infarction, dissection of coronary artery, or acute systolic heart failure (see Table 2). Designing educational programs around these low-frequency, high-IoH conditions may help better prepare residents for these rare, but critical events.
This study has several limitations. The list of ICD-9 codes taken from the NAMCS dataset is clearly not exhaustive, but it is representative and can provide useful information for examining the domain of family medicine. NAMCS considers only family physicians in the outpatient setting and future studies may wish to include the National Hospital Ambulatory Medical Care Survey to better understand the role of family physicians in the hospital/inpatient setting. Furthermore, the single panel site and 21% participation rate may have introduced some selection bias; however, because ICD-9 codes are used nationally, we have no reason to believe that physicians use them differently. We can think of no reason why this would affect the results. Finally, the ABFM TPS framework, although perhaps not optimal, does seem to represent the best option for a shared framework. Other classification schemes, such as the Agency for Health care Research and Quality's Clinical Classifications Software, may also provide useful representations of the domain of family medicine.
This was not a hypothesis testing study but rather a descriptive study that looked at the scope of what family physicians are doing in an ambulatory care setting from the perspectives of frequency and potential for patient harm. There is a subtle difference between what family physicians are doing and what the specialty of family medicine considers to be within its purview. This study considers only what family physicians are doing and is silent with regard to what is considered to be within the realm of family medicine. Nevertheless, this information is critical to anyone who is committed to preparing physicians to enter the specialty of family medicine, to providing relevant continuing medical education for them, or to accurately assessing their clinical knowledge. It is crucial that family medicine certification boards, both osteopathic or allopathic, understand what family physicians are doing, so that their certification process can sufficiently reflect the full range of the scope of family medicine. It is our hope that these descriptions can help the professional community identify appropriate content for teaching and testing the important aspects of family medicine.
Acknowledgments
The authors thank all the reviewers who helped to provide ratings: Steven Anderson, Elizabeth Baxley, John Beecher, Mark Bixby, John Brady, David Bucher, Colleen Conry, Stephen Craane, Christopher Cunha, Amy Daleiden, Tara Doyle-Bizily, Roger Fain, Patricia Fontaine, Joel Gordon, Joseph Gravel, Manuel Idrogo, Linda Johnson, Sandeep Kalola, Steven Kind, Jerry Kruse, Christine Matson, Mrinalini Mudkanna, Shannon Neale, Stephen Ready, David Satin, David Schneider, Scott Staples, Philip Stoyke, and Mark Westholder.
Appendix
ICD-9 Codes Assigned a Final Category Classification (n = 1,695)
ICD-9 Codes Removed from the Final Dataset (n = 198)
Notes
This article was externally peer reviewed.
Funding: none.
Conflict of interest: none declared.
To see this article online, please go to: http://jabfm.org/content/31/1/126.full.
- Received for publication May 24, 2017.
- Revision received August 16, 2017.
- Accepted for publication August 24, 2017.
References
In this issue


Jump to section
Related Articles
Cited By...
- Examining the Construct Stability of the Family Medicine Certification Scale Between One-Day Exam and Longitudinal Assessment
- The American Board of Family Medicine's 8 Years of Experience with Differential Item Functioning
- Changing Reasons for Visiting Primary Care Over a 35-Year Period
- CREATING A NEW BLUEPRINT FOR ABFM EXAMINATIONS
- Validating the Test Plan Specifications for the American Board of Family Medicine's Certification Examination
- Prevalence and practice for rare diseases in primary care: a national cross-sectional study in the USA
- Family Medicine and Obstetrics: Let's Stop Pretending
- Interventions Must Be Realistic to Be Useful and Completed in Family Medicine