
Article Figures & Data
Figures
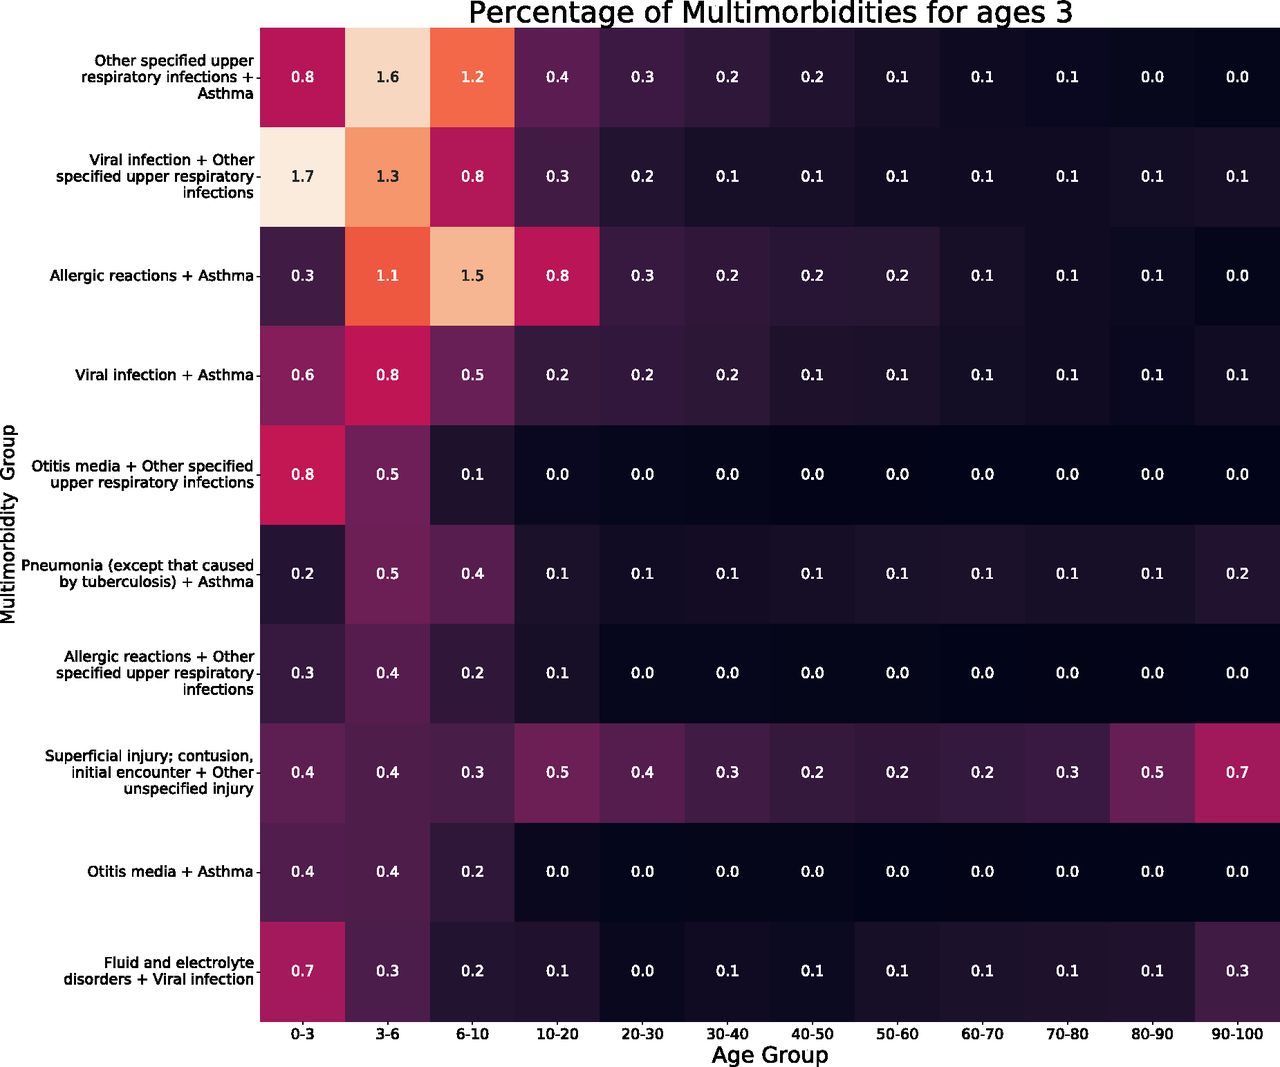
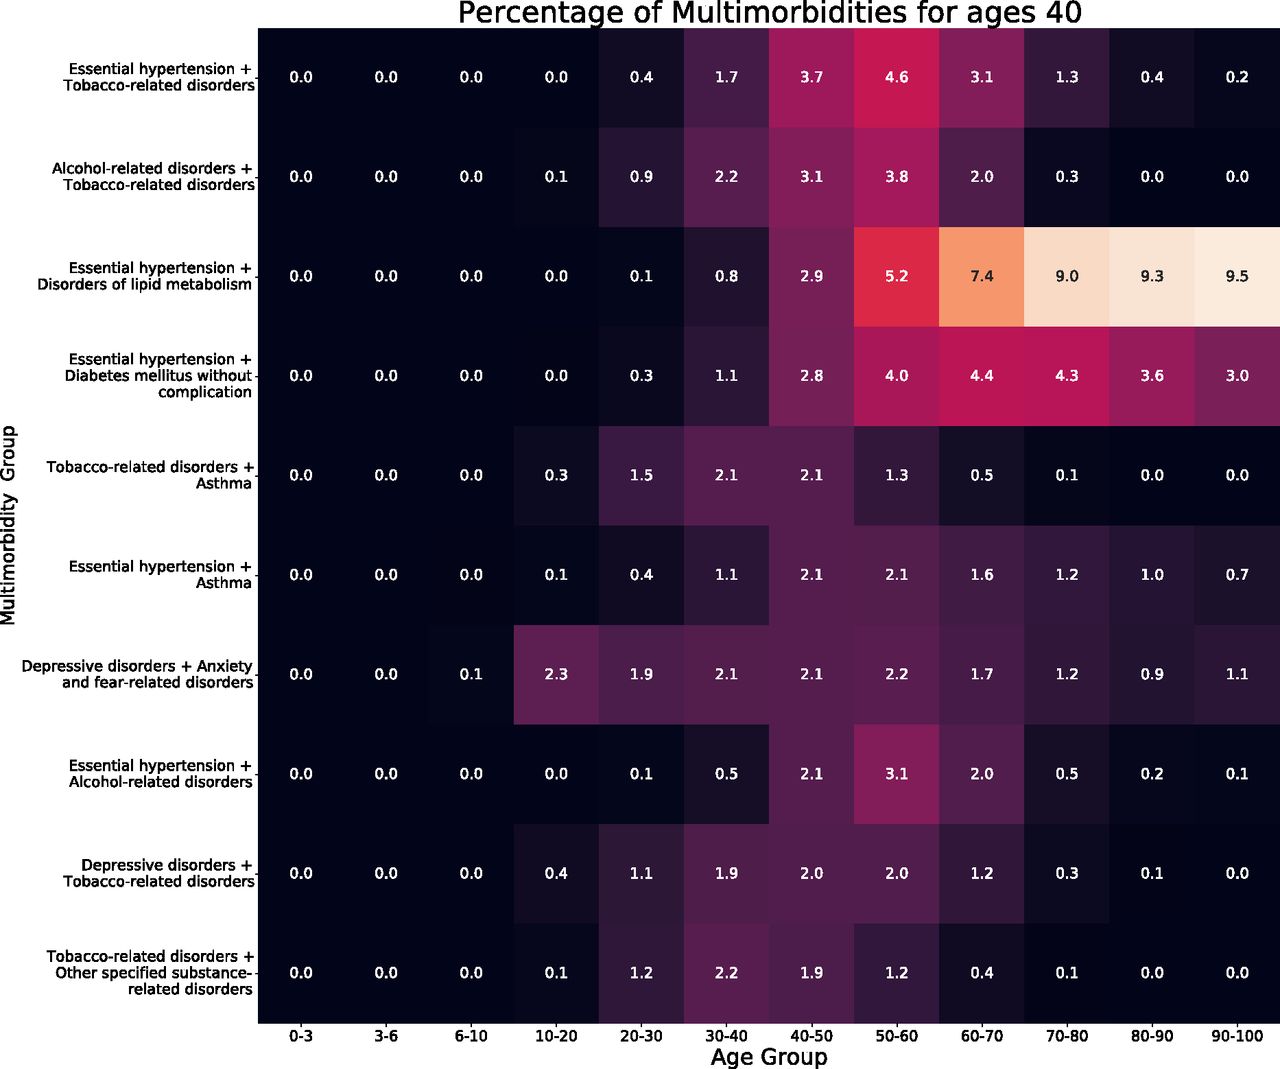
- Figure 1.
Heatmaps of the top 10 multimorbidities across the lifespan at selected age groups.
- Figure 2.
Sankey diagram showing the 5 most common individual diagnoses within each age category and the flow of patients between diagnoses between age categories.
- Figure 3.
Sankey diagram showing the 5 most common multimorbidities present within each age category and the flow of patients between multimorbidity pairs between age categories.
- Appendix Figure 1.
Percentage of overall top multimorbidities.


Tables
- Table 1.
Outcomes for the Overall Population and the Ten Most Common Multimorbidity Combinations
Overall 0-3 3-6 6-10 10-20 20-30 30-40 40-50 50-60 60-70 70-80 80-90 90+ n 2,11,953 11,899 7,332 7,434 23,239 32,329 28,883 23,716 26,759 21,944 15,089 9,510 3,819 Race, n (\%) White 1,20,323 (56.8) 4,683 (39.4) 2,671 (36.5) 2,838 (38.2) 11,835 (51.0) 16,383 (50.8) 14,529 (50.4) 12,670 (53.5) 16,395 (61.3) 15,365 (70.1) 11,644 (77.2) 7,905 (83.2) 3,405 (89.6) Black or African American 49,078 (23.2) 3,280 (27.6) 1,998 (27.3) 2,071 (27.9) 5,587 (24.1) 8,577 (26.6) 7,604 (26.4) 5,968 (25.2) 6,419 (24.0) 4,136 (18.9) 2,142 (14.2) 1,029 (10.8) 267 (7.0) Other 31,189 (14.7) 3,056 (25.7) 2,068 (28.2) 1,952 (26.3) 4,346 (18.7) 5,232 (16.2) 5,020 (17.4) 3,769 (15.9) 2,822 (10.6) 1,640 (7.5) 819 (5.4) 377 (4.0) 88 (2.3) Asian 5,797 (2.7) 499 (4.2) 295 (4.0) 239 (3.2) 672 (2.9) 1,319 (4.1) 972 (3.4) 659 (2.8) 503 (1.9) 306 (1.4) 219 (1.5) 95 (1.0) 19 (0.5) Unknown 4,029 (1.9) 277 (2.3) 242 (3.3) 278 (3.7) 627 (2.7) 558 (1.7) 502 (1.7) 436 (1.8) 432 (1.6) 383 (1.7) 206 (1.4) 71 (0.7) 17 (0.4) American Indian or Alaska Native 607 (0.3) 25 (0.2) 17 (0.2) 19 (0.3) 67 (0.3) 95 (0.3) 107 (0.4) 93 (0.4) 84 (0.3) 62 (0.3) 20 (0.1) 17 (0.2) 1 (0.0) Native Hawaiian or Other Pacific Islander 674 (0.3) 62 (0.5) 35 (0.5) 35 (0.5) 76 (0.3) 96 (0.3) 96 (0.3) 100 (0.4) 85 (0.3) 41 (0.2) 35 (0.2) 11 (0.1) 2 (0.1) Gender, n (\%) Female 1,15,895 (54.7) 5,460 (45.9) 3,341 (45.6) 3,378 (45.4) 12,025 (51.7) 19,374 (59.9) 17,108 (59.2) 13,049 (55.0) 14,248 (53.2) 11,564 (52.7) 8,237 (54.6) 5,528 (58.1) 2,583 (67.6) Male 96,055 (45.3) 6,439 (54.1) 3,991 (54.4) 4,056 (54.6) 11,214 (48.3) 12,955 (40.1) 11,774 (40.8) 10,667 (45.0) 12,509 (46.7) 10,380 (47.3) 6,852 (45.4) 3,982 (41.9) 1,236 (32.4) Unknown 3 (0.0) 1 (0.0) 2 (0.0) Chronic disease burden 3, n (\%) 0 or 1 disease 87,166 (41.1) 7,487 (62.9) 3,887 (53.0) 3,923 (52.8) 11,606 (49.9) 14,963 (46.3) 11,813 (40.9) 9,216 (38.9) 9,540 (35.7) 7,186 (32.7) 4,465 (29.6) 2,357 (24.8) 723 (18.9) 2 diseases (multimorbidity) 1,24,787 (58.9) 4,412 (37.1) 3,445 (47.0) 3,511 (47.2) 11,633 (50.1) 17,366 (53.7) 17,070 (59.1) 14,500 (61.1) 17,219 (64.3) 14,758 (67.3) 10,624 (70.4) 7,153 (75.2) 3,096 (81.1) Chronic disease burden, mean (S.D.) 3.0 (3.5) 1.4 (1.3) 1.7 (1.4) 1.7 (1.4) 1.9 (1.7) 2.3 (2.3) 2.7 (2.8) 3.0 (3.2) 3.5 (3.9) 4.0 (4.5) 4.5 (4.9) 5.2 (5.0) 5.7 (4.9) Chronic disease burden 2, median [Q1, Q3] 2.0 [1.0,4.0] 1.0 [1.0,2.0] 1.0 [1.0,2.0] 1.0 [1.0,2.0] 2.0 [1.0,2.0] 2.0 [1.0,3.0] 2.0 [1.0,3.0] 2.0 [1.0,4.0] 2.0 [1.0,4.0] 3.0 [1.0,5.0] 3.0 [1.0,6.0] 4.0 [2.0,7.0] 4.0 [2.0,8.0] Visits Per Year, mean (S.D.) 0.3 (0.5) 0.2 (0.2) 0.3 (0.3) 0.3 (0.3) 0.2 (0.3) 0.3 (0.4) 0.3 (0.5) 0.4 (0.7) 0.4 (0.8) 0.4 (0.7) 0.4 (0.5) 0.3 (0.5) 0.3 (0.4) Death, n (\%) No 1,99,930 (94.3) 11,867 (99.7) 7,321 (99.8) 7,416 (99.8) 23,166 (99.7) 32,106 (99.3) 28,500 (98.7) 23,069 (97.3) 25,228 (94.3) 19,749 (90.0) 12,535 (83.1) 6,704 (70.5) 2,269 (59.4) Yes 12,023 (5.7) 32 (0.3) 11 (0.2) 18 (0.2) 73 (0.3) 223 (0.7) 383 (1.3) 647 (2.7) 1,531 (5.7) 2,195 (10.0) 2,554 (16.9) 2,806 (29.5) 1,550 (40.6) Visit Department, n (\%) Emergency Room Visit 63,322 (37.0) 3,212 (33.2) 2,159 (35.2) 2,152 (34.6) 8,198 (43.5) 12,402 (48.3) 9,726 (41.9) 7,717 (39.9) 7,124 (33.0) 4,844 (27.3) 2,853 (23.8) 1,948 (25.6) 987 (32.3) Office Visit 52,184 (30.5) 4,313 (44.5) 2,639 (43.0) 2,705 (43.5) 6,079 (32.3) 6,610 (25.7) 6,225 (26.8) 5,316 (27.5) 6,234 (28.9) 5,497 (31.0) 3,778 (31.5) 2,171 (28.5) 617 (20.2) Telehealth 14,758 (8.6) 763 (7.9) 482 (7.8) 429 (6.9) 1,333 (7.1) 2,025 (7.9) 2,046 (8.8) 1,713 (8.8) 2,081 (9.6) 1,745 (9.9) 1,267 (10.6) 614 (8.1) 260 (8.5) Order document 23,634 (13.8) 883 (9.1) 614 (10.0) 651 (10.5) 2,085 (11.1) 3,190 (12.4) 3,348 (14.4) 2,566 (13.3) 3,286 (15.2) 3,075 (17.4) 2,163 (18.0) 1,333 (17.5) 440 (14.4) Emergency Room and Inpatient Visit 11,073 (6.5) 450 (4.6) 195 (3.2) 209 (3.4) 898 (4.8) 1,055 (4.1) 1,215 (5.2) 1,125 (5.8) 1,544 (7.1) 1,479 (8.3) 1,250 (10.4) 1,079 (14.2) 574 (18.8) Diagnostic Imaging Encounter 3,117 (1.8) 14 (0.1) 6 (0.1) 7 (0.1) 66 (0.4) 84 (0.3) 235 (1.0) 592 (3.1) 933 (4.3) 696 (3.9) 333 (2.8) 130 (1.7) 21 (0.7) Other 2,985 (1.7) 48 (0.5) 46 (0.7) 63 (1.0) 168 (0.9) 305 (1.2) 395 (1.7) 332 (1.7) 398 (1.8) 379 (2.1) 358 (3.0) 333 (4.4) 160 (5.2) Notes: Headings refer to multimorbidity pairs by AHRQ classification. For example, CIR-CIR refers to the coexistence of two circulatory system diagnoses, and CIR-END refers to the coexistence of a circulatory system and endocrine diagnosis.
Abbreviation: SD, standard deviation.
- Table 2.
Outcomes for the Overall Population and the Ten Most Common Multimorbidity Combinations
Multimorbidity pairs Overall CIR-CIR CIR-END CIR-MBD CIR-MUS DIG-END END-END END-MBD EXT-INJ MBD-MBD MUS-MUS P-Value n 2,11,953 18,295 28,063 15,601 13,589 13,966 19,167 13,475 19,037 23,730 12,770 Race, n (%) White 1,20,323 (56.8) 12,503 (68.3) 17,437 (62.1) 9,235 (59.2) 8,045 (59.2) 8,574 (61.4) 11,483 (59.9) 8,183 (60.7) 10,578 (55.6) 14,210 (59.9) 7,069 (55.4) <0.001 Black or African American 49,078 (23.2) 4,096 (22.4) 7,319 (26.1) 4,651 (29.8) 3,972 (29.2) 3,405 (24.4) 5,077 (26.5) 3,608 (26.8) 5,024 (26.4) 6,191 (26.1) 3,733 (29.2) Other 31,189 (14.7) 1,242 (6.8) 2,527 (9.0) 1,417 (9.1) 1,240 (9.1) 1,559 (11.2) 2,026 (10.6) 1,380 (10.2) 2,730 (14.4) 2,703 (11.4) 1,567 (12.3) Asian 5,797 (2.7) 198 (1.1) 338 (1.2) 92 (0.6) 125 (0.9) 174 (1.2) 253 (1.3) 86 (0.6) 325 (1.7) 221 (0.9) 152 (1.2) Unknown 4,029 (1.9) 169 (0.9) 285 (1.0) 109 (0.7) 119 (0.9) 140 (1.0) 205 (1.1) 117 (0.9) 269 (1.4) 211 (0.9) 135 (1.1) American Indian or Alaska Native 607 (0.3) 56 (0.3) 93 (0.3) 64 (0.4) 55 (0.4) 57 (0.4) 74 (0.4) 64 (0.5) 47 (0.2) 95 (0.4) 60 (0.5) Native Hawaiian or Other Pacific Islander 674 (0.3) 29 (0.2) 59 (0.2) 29 (0.2) 29 (0.2) 54 (0.4) 47 (0.2) 36 (0.3) 47 (0.2) 82 (0.3) 48 (0.4) Gender, n (%) Female 1,15,895 (54.7) 8,980 (49.1) 15,227 (54.3) 7,877 (50.5) 7,834 (57.6) 8,164 (58.5) 11,169 (58.3) 7,563 (56.1) 8,961 (47.1) 11,911 (50.2) 7,749 (60.7) <0.001 Male 96,055 (45.3 9,315 (50.9) 12,836 (45.7) 7,723 (49.5) 5,755 (42.4) 5,801 (41.5) 7,998 (41.7) 5,912 (43.9) 10,076 (52.9) 11,817 (49.8) 5,021 (39.3) Age, median [Q1, Q3] 38.0 [20.9,59.0] 70.4 [58.8,81.7] 65.2 [54.2,77.2] 58.0 [47.4,68.3] 65.0 [54.2,77.6] 60.1 [46.3,73.1] 62.2 [50.0,74.7] 56.1 [42.8,66.9] 35.6 [21.5,57.9] 39.9 [27.3,55.4] 55.4 [40.1,68.7] <0.001 Chronic disease burden, n (%) 0 or 1 disease 87,166 (41.1) 0 (0.0) 0 (0.0) 0 (0.0) 0 (0.0) 0 (0.0) 0 (0.0) 0 (0.0) 0 (0.0) 0 (0.0) 0 (0.0) 1.000 ≥ 2 diseases (multimorbidity) 1,24,787 (58.9) 18,295 (100.0) 28,063 (100.0) 15,601 (100.0) 13,589 (100.0) 13,966 (100.0) 19,167 (100.0) 13,475 (100.0) 19,037 (100.0) 23,730 (100.0) 12,770 (100.0) Chronic disease burden, mean (S.D.) 3.0 (3.5) 9.1 (6.0) 8.2 (5.4) 9.3 (5.8) 9.5 (5.9) 10.3 (6.1) 9.3 (5.8) 9.8 (5.9) 5.5 (4.7) 7.1 (5.0) 7.7 (5.9) <0.001 Chronic disease burden, median [Q1, Q3] 2.0 [1.0,4.0] 7.0 [5.0,12.0] 7.0 [4.0,11.0] 8.0 [5.0,12.0] 8.0 [5.0,12.0] 9.0 [6.0,14.0] 8.0 [5.0,12.0] 8.0 [5.0,13.0] 4.0 [3.0,7.0] 6.0 [4.0,9.0] 6.0 [3.0,10.0] <0.001 Visits Per Year, mean (S.D.) 0.3 (0.5) 0.7 (1.2) 0.7 (1.1) 0.9 (1.5) 0.8 (1.5) 0.9 (1.5) 0.8 (1.3) 0.9 (1.5) 0.6 (1.2) 0.7 (1.3) 0.8 (1.5) <0.001 Death, n (%) Yes 12,023 (5.7) 4,217 (23.1) 4,620 (16.5) 2,186 (14.0) 2,270 (16.7) 2,292 (16.4) 3,038 (15.9) 1,699 (12.6) 1,182 (6.2) 1,483 (6.2) 1,317 (10.3) <0.001 No 1,99,930 (94.3) 14,078 (76.9) 23,443 (83.5) 13,415 (86.0) 11,319 (83.3) 11,674 (83.6) 16,129 (84.1) 11,776 (87.4) 17,855 (93.8) 22,247 (93.8) 11,453 (89.7) Notes: Headings refer to multimorbidity pairs by AHRQ classification. For example, CIR-CIR refers to the coexistence of two circulatory system diagnoses, and CIR-END refers to the coexistence of a circulatory system and endocrine diagnosis. (see appendix table 1).
Description Three Character Abbreviation BLD Diseases of the blood and blood-forming organs and certain disorders involving the immune mechanism CIR Diseases of the circulatory system DEN Dental diseases DIG Diseases of the digestive system EAR Diseases of the ear and mastoid process END Endocrine, nutritional, and metabolic diseases EXT External causes of morbidity EYE Diseases of the eye and adnexa FAC Factors influencing health status and contact with health services GEN Diseases of the genitourinary system INF Certain infectious and parasitic diseases INJ Injury, poisoning and certain other consequences of external causes MAL Congenital malformations, deformations and chromosomal abnormalities MBD Mental, behavioral, and neurodevelopmental disorders MUS Diseases of the musculoskeletal system and connective tissue NEO Neoplasms NVS Diseases of the nervous system PNL Certain conditions originating in the perinatal period PRG Pregnancy, childbirth, and the puerperium RSP Diseases of the respiratory system SKN Diseases of the skin and subcutaneous tissue SYM Symptoms, signs and abnormal clinical and laboratory findings, not elsewhere classified


