
Abstract
Introduction: Multimorbidity rates are both increasing in prevalence across age ranges, and also increasing in diagnostic importance within and outside the family medicine clinic. Here we aim to describe the course of multimorbidity across the lifespan.
Methods: This was a retrospective cohort study across 211,953 patients from a large northeastern health care system. Past medical histories were collected in the form of ICD-10 diagnostic codes. Rates of multimorbidity were calculated from comorbid diagnoses defined from the ICD10 codes identified in the past medical histories.
Results: We identify 4 main age groups of diagnosis and multimorbidity. Ages 0 to 10 contain diagnoses which are infectious or respiratory, whereas ages 10 to 40 are related to mental health. From ages 40 to 70 there is an emergence of alcohol use disorders and cardiometabolic disorders. And ages 70 to 90 are predominantly long-term sequelae of the most common cardiometabolic disorders. The mortality of the whole population over the study period was 5.7%, whereas the multimorbidity with the highest mortality across the study period was Circulatory Disorders-Circulatory Disorders at 23.1%.
Conclusion: The results from this study provide a comparison for the presence of multimorbidity within age cohorts longitudinally across the population. These patterns of comorbidity can assist in the allocation to practice resources that will best support the common conditions that patients need assistance with, especially as the patients transition between pediatric, adult, and geriatric care. Future work examining and comparing multimorbidity indices is warranted.
- Adolescent Medicine
- Aging
- Comorbidity
- Epidemiology
- Family Medicine
- Geriatrics
- Lifespan
- Multimorbidity
- Pediatrics
- Retrospective Studies
Introduction
Family physicians are generalists, masters of dealing with the uncertainty and complexity of patients with dynamic illnesses, integrative of multiple pathologies.1,2 Multimorbidity, or the coexistence of 2 or more conditions3 (often presenting as chronic disease), is of increasing concern beyond the family medicine clinic. Data from Canada4, the United Kingdom,5 and the United States6 has demonstrated that the prevalence of multimorbidity has been rising over time. This international data on multimorbidity uses standardized age cohorts (with limited cohorts of pediatric and geriatric patients). The use of large, standardized age cohorts (such as <18, 18 to 44, 20 to 44, 45 to 64, and 65+ years) obfuscates the complexity inherent in pediatric and geriatric populations, a noted limitation in the literature.7,8 Existing clinical observational science has highlighted that the nature of primary care family medicine practice includes patients presenting with multifactorial symptoms and stages of disease, often more than 1 disease.9 Barnett et al10 provide a starting point as to a rationale to address multimorbidity: “Better understanding of the epidemiology of multimorbidity is necessary to develop interventions to prevent it, reduce its burden, and align health-care services more closely with patients’ needs.”10 In addition, understanding the prevalence and incidence of multimorbidity across the lifespan is crucial for effective planning, development, and sustainable implementation of health policies and systems. Epidemiologic knowledge can guide the exploration of disease mechanisms, influential factors driving age-related changes, and the financial and nonfinancial costs for individuals, families, communities, and governments worldwide. From such epidemiologic work we know that the nature of multimorbidity changes as patients accrue disease10 as well as within subsets of the lifespan.11 In addition, a central tenet of pediatrics “children are not little adults” reinforces the finding that the combinations of disease will look different in children than adults.12 Recognizing the interactions between discriminators from various facets of an person’s lifespan is essential for family medicine physicians whose practice contains patients from children to older adults, and necessarily must tailor care within their practice and the health system to population-specific needs. This article aims to close the knowledge gap by characterizing and highlighting transitions in multimorbidity across different age groups. By examining the epidemiology of multimorbidity in varying age cohorts we seek to provide insights into the patterns of multimorbidity throughout the lifespan. This information will ultimately support future research, facilitate better understanding of population health, and enable more effective strategies to manage and mitigate the impacts of multimorbidity on individuals and health care systems.
Methods
All analysis was conducted in Python 3.10.5. This research was deemed exempt under 45 CFR 46.104 (4) by the Human Research Protection Program of Yale University (HIC# 2000031389).
Cohort Creation
This was a retrospective observational cohort study of all visits to the health system between 2013 and 2022. Patient data were collected across 2 sites and consisted of all patients visiting an urban academic and an urban safety net medical center in the northeastern United States. The covered area of the network has a similar demographic composition as the national population. All patients with at least 1 encounter in the health care system were included in the analysis. This includes patients at all emergency department, inpatient, or outpatient visits regardless of the specialty of the covering provider.
Data Collection
For each encounter recorded, we collected patient demographics in the form of age, sex, patient self-reported race, as well as date of death if it had occurred. For all patients with complete demographic information, we then collected the past medical history in the form of ICD-10 diagnostic codes which were present at the time of the visit. Each diagnostic code was converted into hierarchical categories by organ system using the AHRQ Clinical Classification Software coding system.14 The hierarchical levels used are shown in Appendix Table 1. For each encounter we then calculated the disease burden of the patient, defined as the number of unique AHRQ categories present at the time of the visit. In addition, to assess the multimorbidity burden of the population, we found all pair-wise and triple combinations of AHRQ diagnostic codes within the past medical history of each patient encounter.
Morbidity and Mortality Analysis
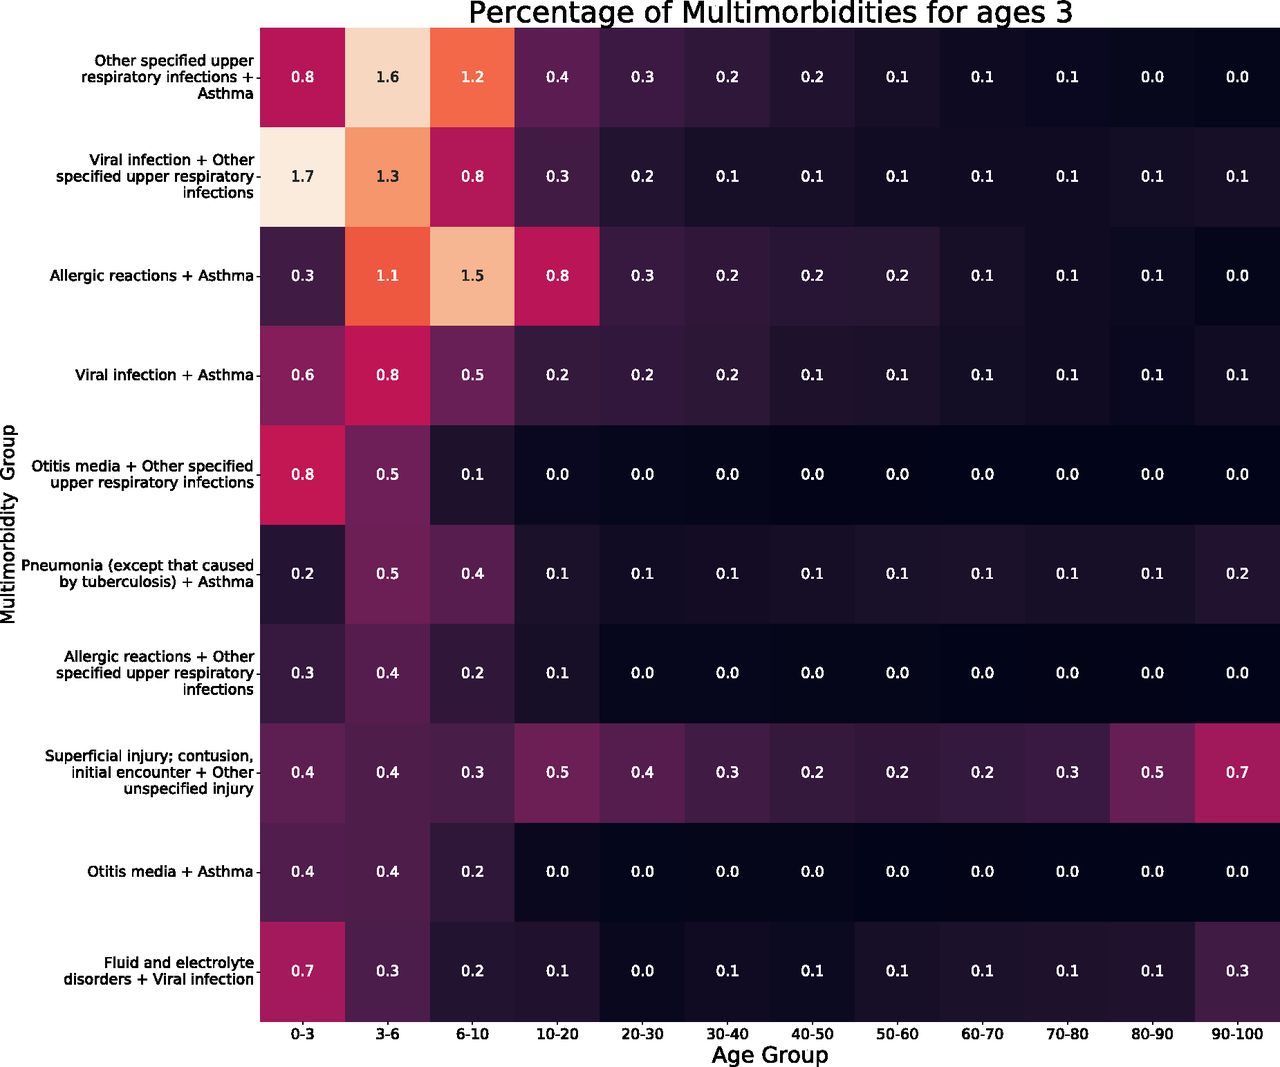
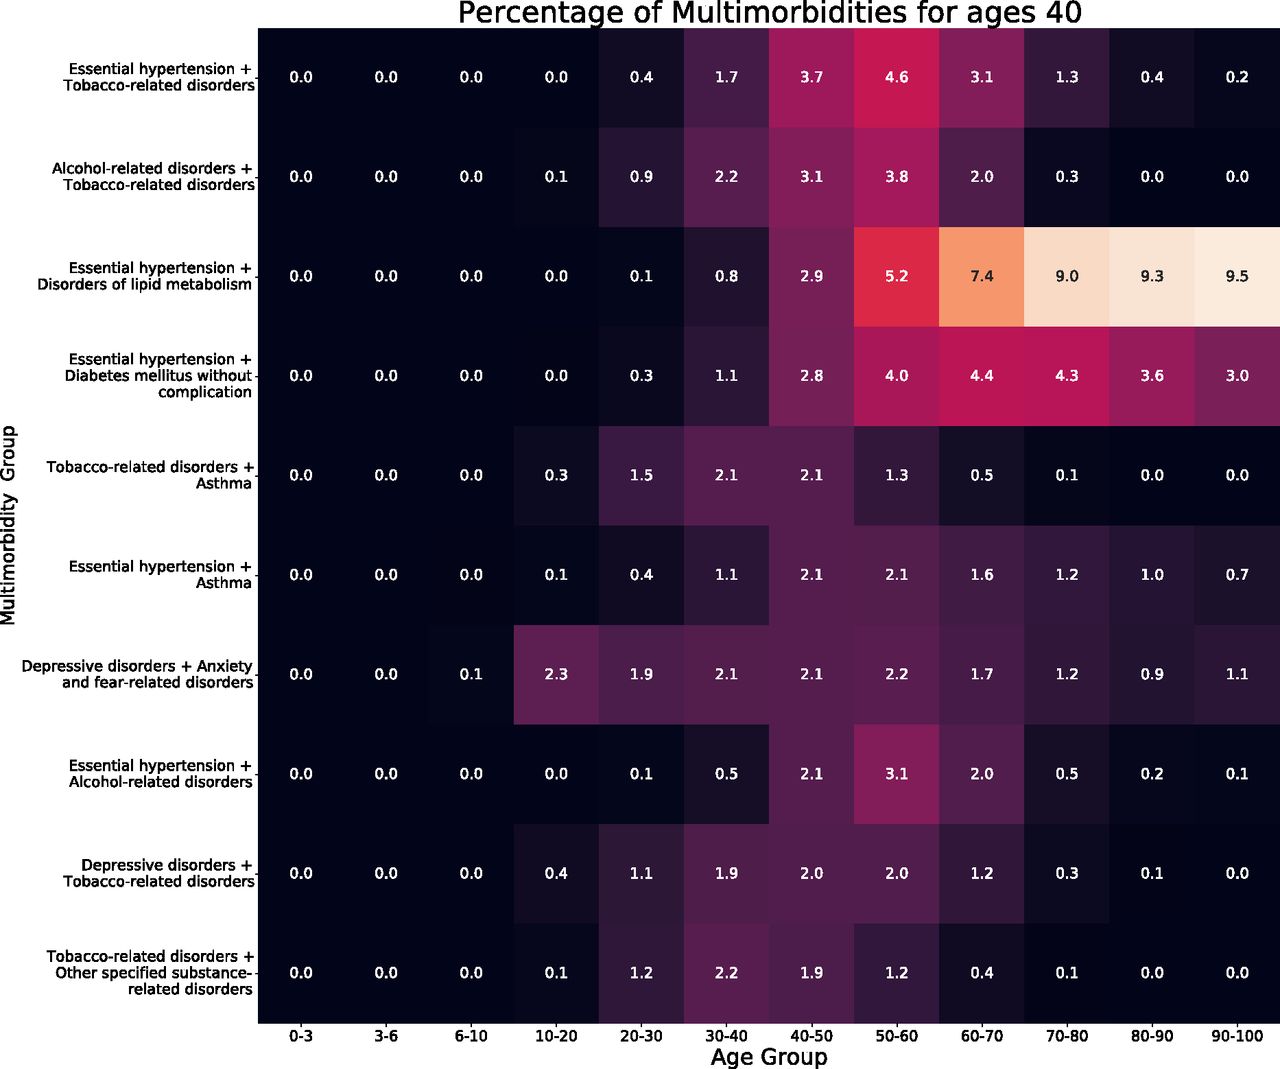
All individual codes, as well as multimorbidity pairs and triples were then grouped by patient age at the time of the encounter by decade of life. Due to known patterns of childhood and adolescence and the rapid change of multimorbidity at that age, we further subcategorization was used for patients aged 0 to 10 years into age brackets of 0 to 3 years, 3 to 6 years, and 6 to 10 years as we hypothesized there were rapid changes in the epidemiology of multimorbidity at those age ranges. For each group of patients, as well as the overall population, we found the 10 most common individual AHRQ diagnostic codes within the cohort, as well as the 10 most common pairwise or triple multimorbidity combinations. A heat map of the rates of the most common conditions was then created to show the prevalence within each age range, shown in the Appendix. In addition for within the results, Figure 1 shows the most common multimorbidities conditions at age ranges 3 to 6, 30 to 40, 50 to 60, and 80 to 90, we constructed similar heat maps showing the prevalence of the multimorbidities at those age ranges across the lifespan shown in Figure 1. In Table 2, the multimorbidity burden and 1 year survival is analyzed. For the AHRQ category pairs we calculated the average number of hospital visits per year for each patient, 1 year mortality, multimorbidity burden. As indicated in literature we examined multimorbidity burden and 1 year survival. For the most common multimorbidity combinations in the entire population, we identified the patients with that multimorbidity burden and quantified their multimorbidity by the average number of unique AHRQ categories present in each patient. Lastly, we identified the average number of hospital visits per year for each patient with a given multimorbidity, and the 1 year mortality.

Heatmaps of the top 10 multimorbidities across the lifespan at selected age groups.
Multimorbidity across the Lifespan
Finally, we analyzed the transition of multimorbidity across the lifespan through sequential age groups. For this analysis, all patients with at least 1 visit in 2 or more of the age brackets described previously were included. For a patient in successive age ranges with 2 multimorbidity pairs, a patient was said to transfer from 1 age range/multimorbidity pair to the other only if that pair was present in a visit in the first age range, and the second pair present in the second age range. Note, the multimorbidity pairs need not be different, and may represent the same multimorbidity combination following a patient throughout the lifespan. We then counted all instances of each first pair leading to a second pair for each sequential time period. Sankey diagrams were generated, specifically as a means to visualize the successive flow of patients from age-state to age-state.15 Sankey diagrams showing total counts of these 2 multimorbidity pairs were created to show the overall progression of multimorbidity through the lifespan and where multimorbidities first originate. These diagrams display the age ranges on the x-axis, with the width of flows from each diagnosis or multi-morbidity pair on the y-axis proportional to flow quantity. Flow quantity is not intended to be explicitly measured in these diagrams but rather presented visually as a means of comparison.
Results
Table 1 describes the patient population of 2,11,953 unique patients with a median age of 38.0 years old, 54.7% female, 56.8% white, with a mean number of visits per year of 0.3 (standard deviation of 0.5); 5.7% of the cohort passed away during the course of the study period; 58.9% of patients presented with a chronic disease burden of greater than or equal to 2.
Outcomes for the Overall Population and the Ten Most Common Multimorbidity Combinations
Morbidity and Mortality Analysis
Outcomes for the top 10 multimorbidities across the entire population are shown in Table 2. The most common multimorbidity was Circulatory Disorders-Endocrine Disorders with 28,603 patients. The median age of this population was 65.2 compared with the median of the overall population 38.0. Only 2 of the top 10 most common multimorbidities, External Cause of Morbidity-Injury (median age 35.6 [21.5, 57.9]), and Mental Behavioral Disorders-Mental Behavioral Disorders (median age 39.9 [27.3, 55.4]), had average ages equal to or less than the average age of the population. The multimorbidity with the highest mortality across the study period was Circulatory Disorders-Circulatory Disorders (23.1%) whereas the lowest were the External Cause of Morbidity-Injury and Mental Behavioral Disorders-Mental Behavioral Disorders, each with a 1-year mortality of 6.3%. A Sankey diagram showing the 5 most common individual diagnoses at each age is shown in Figure 2. We identify 4 main phases of diagnosis within the diagram. From ages 0 to 10, diagnoses are predominantly infectious or respiratory in nature. Ages 10 to 40 contain diagnoses predominantly related to mental health and injury. This transitions to Ages 40 to 70 where there is an emergence of alcohol use disorders and metabolic disorders (eg, lipid metabolism and diabetes). Finally, ages 70 to 90 are predominantly long-term sequelae of the most common metabolic disorders, that is, coronary atherosclerosis is often a direct consequence of disorders of lipoprotein metabolism, hypertension, and diabetes. The flow from the Sankey diagrams indicate where these diagnoses are originating. If there is more flow into a diagnosis rather than out of, it indicates more patients died in that window of time than developed it, or they no longer had a diagnoses in the top 5 of the subsequent age-group. Conversely if there is greater flow out of a diagnosis, then patients developed the diagnosis within that age window who did not have 1 of the most common diagnoses in the previous window. This is evident when looking at hypertension, the most common diagnosis is ages 50 to 60, and 60 to 70. From 50 to 60 more patients develop hypertension than die while diagnosed with the disease. This changes from ages 60 to 70 where more patients die with the diagnosis than are newly diagnosed. The flow of the Sankey diagram also identifies how it is highly unlikely for certain diagnoses to develop without prior risk factors. In the case of coronary atherosclerosis where all patients which develop it had a diagnosis in the preceding window.

Sankey diagram showing the 5 most common individual diagnoses within each age category and the flow of patients between diagnoses between age categories.
Outcomes for the Overall Population and the Ten Most Common Multimorbidity Combinations
Figure 3 again shows a Sankey diagram, this time of these 5 most common multimorbidities present within each age range. The same 4 phases of diagnosis are present as seen in Figure 2. Ages 0 to 10 are again dominated by infectious and respiratory complications. The multimorbidity view allows for more nuanced interpretation where we can see the synergistic effects pairs of diagnoses like the allergic reaction-asthma multimorbidity, evidence of atopic triad. Ages 10 to 40 are again predominantly mental behavioral disorders, demonstrating the multimorbidity of many mental health disorders. Ages 40 to 70 represent the multimorbidities present between the most common metabolic disorders in the population. Finally, ages 70 to 90 have a terminal diagnoses, combined with the diagnosis that is often a risk factor for it. For example, the essential hypertension-cardiac atherosclerosis multimorbidity.

Sankey diagram showing the 5 most common multimorbidities present within each age category and the flow of patients between multimorbidity pairs between age categories.
Discussion
Our findings here demonstrate the variations in multimorbidity across the lifespan. Importantly, they also begin to build a timeline for how diagnoses build on each other over time, such as hypertension leading to coronary artery disease. These findings align with known clinical groups, such as the allergic triad, suggesting that these methods can be further refined to build a more granular understanding of multimorbidity across age groups. By separating multimorbidity trends by age, we can begin to examine the epidemiologic patterns inherent in the boundary of care between pediatric, adult, and geriatric populations. Improving the clinical understanding of variation in multimorbidity across the lifespan will support more optimized transition from a pediatric to an adult model of care by refining what changes in multimorbidity are more consistent with adult rather than pediatric patterns of diagnoses. It will also support appropriate timing of providing supports as people age and develop geriatric syndromes by more clearly identifying when such syndromes begin to emerge. Although multimorbidity indices have been developed for adults (such as the well known Charlson Comorbidity Index16), in pediatrics12, and in geriatrics17, there has been little comparative work done to characterize the epidemiologic differences between these broad patient populations. Future work is needed to characterize age-specific disease burden. Furthermore, although one can evince a separation between pediatric, adult, and geriatric medicine that is a product of clinical separation of age groups, there are no agreed on boundaries with respect to age as they specifically pertain to the epidemiology of multimorbidity. Our results support future work to examine the clinometric delimitation between age groups which span both the lifespan or function solely within an age range.
Differentiating the diagnoses found spanning between age groups suggests that there may be value to an emphasis on diseases that present differently in pediatrics versus adult medicine versus geriatrics and are chronic in nature. Given the age of onset and presentation of “depressive disorders” and “anxiety and fear-related disorders” differs between children and young adults, and warrants education linking pediatric, adolescent, and young adult physicians to best support the management of disease from ages 10 to 40. Questions additionally remain, such as why the morbidity of “tobacco-related disorders” is not present from age 60, or why “depressive disorders” similarly is not present from age 40. Another point of interest is the presence of “other specified substance-related disorders” with “tobacco-related disorders,” reinforcing the concept of tobacco as a potential gateway drug not just with children18 but rather older adults, complicated by a link to alcohol use given the presence of the pair of “alcohol-related disorders” and “tobacco-related disorders” until the age of 60. Although hypotheses such as that the cumulative effect of nicotine leads to the presence of cardiovascular disease through mechanisms such as essential hypertension (such as kidney structure/function, coronary vasoconstriction or increased myocardial work), support the shuffling of most common diagnoses and multimorbidity pairs, more research is needed to clarify the specifics of diagnostic transitions as well as precision regarding the age groups. Identifying the onset via diagnosis of diseases which contribute to the development of future disease of a similar or related type (such as is the case with tobacco use and coronary artery disease19) will support both physicians as they seek to demonstrate the value of preventive medicine, but also clarify how diagnostic labels can contribute to the codification of risk. Ultimately, however, this research is limited by using a single urban academic medical center in the United States with an integrated children’s hospital and limited psychiatric services.
Conclusion
In summary, from our results in Table 2 and Figure 2, we can reinforce the notion that the most common diseases differ across age groups, with pediatric patients having a different pattern of disease presentation than adults. This notion is reinforced in the case of multimorbidity from Figure 3 Major trends in multimorbidity include the patterns of major chronic diseases (including mental health disorders), with asthma emerging at age 0 to 3 and persisting until age 40 to 50; depressive disorders emerging from age 10 to 20 and persisting until age 30 to 40; anxiety and fear related disorders emerging at the same age and persisting until age 40 to 50; tobacco-related disorders emerging at age 20 to 30 and persisting until age 60 to 70; musculoskeletal pain, not low back pain emerging at age 10 to 20 and persisting until age 60 to 70; essential hypertension emerging at age 30 to 40 and persisting until age 90 to 100; and disorders of lipid metabolism emerging at age 50 to 60 and persisting until age 90 to 100. These results provide a basis for the future comparison of the presence of multimorbidity in cohort populations relative to the general population, a challenge for populations of patients who are understudied due to insufficient longitudinal data.20 Furthermore, although limited to the 5 or 10 most common multimorbidities, this study offers insight into the chronicity of diseases (such as asthma, depressive disorders and anxiety and fear related disorders) which emerge during pediatric care and persist into adulthood. As family medicine physicians look to manage the children under their care or admit adolescents/young adults onto their practice from pediatricians, these patterns may help clarify practice resources (such as in respiratory and mental health) that will best support the common conditions their patients may have accrued. Future work examining the discrete measurement of age of patients accruing multimorbidities, as well as the complexity of the combinatorics supporting the creation of multimorbidity indices are initial next steps.
Appendix
Three Letter AHRQ Codes and Description


Percentage of overall top multimorbidities.
Notes
This article was externally peer reviewed.
Funding: This work was supported in part by the National Institute of Diabetes and Digestive and Kidney Diseases of the National Institute of Health (T35DK104689) and the Yale School of Medicine Fellowship for Medical Student Research.
Conflict of interest: The authors have no conflicts of interest to report.
To see this article online, please go to: http://jabfm.org/content/37/2/251.full.
- Received for publication June 7, 2023.
- Revision received October 24, 2023.
- Accepted for publication October 25, 2023.


