
Article Figures & Data
Figures
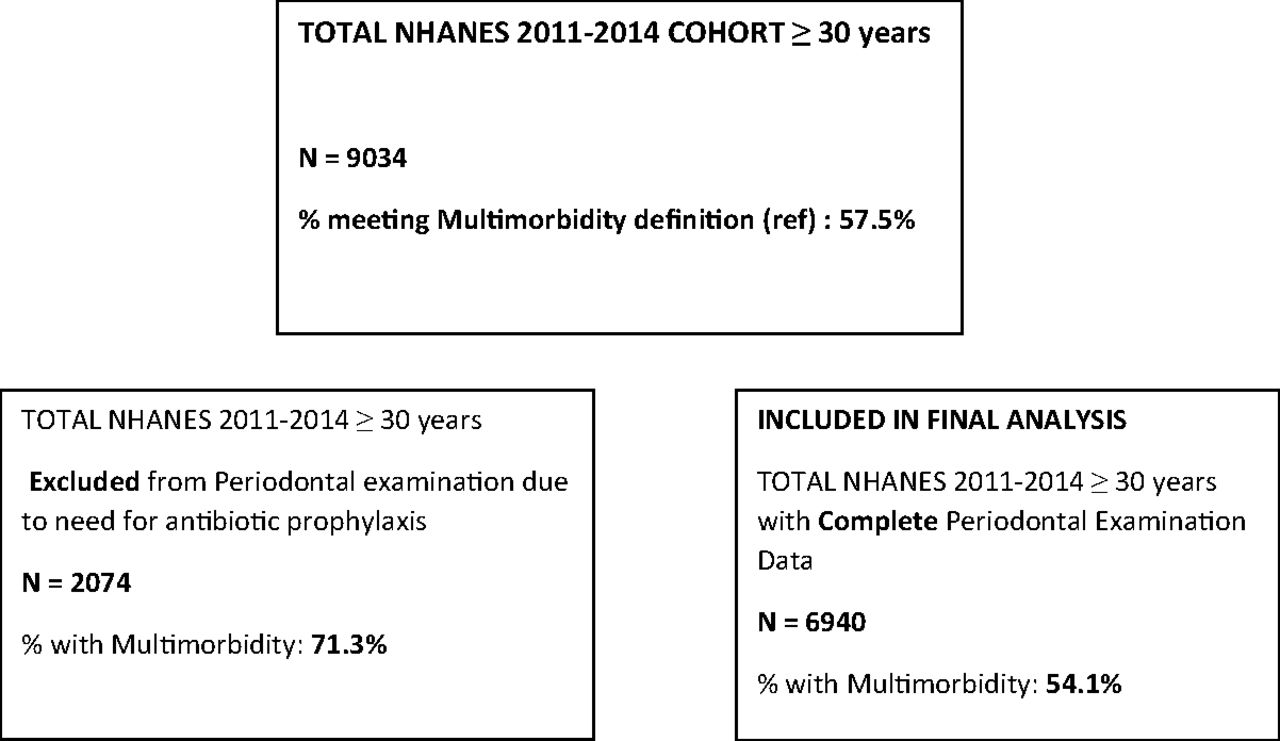
- Figure 1.
Schematic representation of differences in multimorbidity prevalence of individuals excluded from periodontal examination.

Tables
- Table 1.
Selected Covariates by Multimorbidity (in Weighted Percentages)* in Observed Data
No multimorbidity Multimorbidity Covariate Mean (SD) Mean (SD) P± Age, continuous 45.4 (0.3)± ± 55.9 (0.3) <0.0001 Sex (male) 52.2 45.6 <0.0001 Race/ethnicity Mexican American 10.2 6.4 <0.0001 Other Hispanic 6.2 5.1 Non-Hispanic White 63.7 71.6 Non-Hispanic Black 10.0 11.0 Non-Hispanic Asian 7.8 3.3 Other 2.0 2.7 Education <0.0001 <9th grade 5.0 4.9 9th to 11th grade 8.9 9.9 High school diploma or equivalent 19.4 21.3 Some college/associate’s degree 26.7 33.9 Bachelor’s degree or higher 40.0 30.1 Marital status <0.0001 Married 65.5 60.4 Widowed 2.3 7.6 Divorced 10.7 14.4 Separated 2.5 2.7 Never married 11.7 9.7 Living with partner 7.3 5.2 Monthly household income Low ($0–$1649) 15.9 20.2 <0.0001 Middle ($1650–$4599) 34.3 39.2 High (≥$4600) 49.8 40.6 Length of time since last dentist visit 0.012 0 to 6 months 49.2 53.2 6 months to 1 year 14.0 13.8 1 to 2 years 12.1 10.5 2 to 3 years 5.9 6.6 3 to 5 y ears 6.2 5.9 5+ years 11.3 9.5 Never visited dentist 1.2 0.5 Needed dental in last year and didn’t get it (yes) 15.0 18.6 0.006 Current smoker <0.0001 Every day 37.2 30.6 Some days 8.8 5.5 Not at all 54.0 63.9 Averages 2+ drinks per day (yes) 33.3 29.6 0.003 Number of prescriptions 0–1 82.0 33.9 <0.0001 2–4 15.9 39.0 5–10 2.1 24.1 ≥11 0.0 3.1 Health insurance coverage (yes) 76.6 87.5 <0.0001 General health condition <0.0001 Excellent 17.7 6.2 Very good 38.7 27.8 Good 34.8 43.3 Fair 8.3 18.8 Poor 0.5 3.9 No Periodontitis Periodontitis Covariate Mean (SD) Mean (SD) P± Age, continuous 48.7 (0.4)±± 54.5 (0.4) <0.0001 Sex (male) 42.6 57.8 <0.0001 Race/ethnicity <0.0001 Mexican American 5.9 11.5 Other Hispanic 4.8 6.8 Non-Hispanic White 74.3 58.5 Non-Hispanic Black 7.7 14.7 Non-Hispanic Asian 5.0 5.9 Other 2.2 2.6 Education <0.0001 <9th grade 2.5 8.6 9th to 11th grade 6.2 14.3 High school diploma or equivalent 16.3 26.7 Some college/associate’s degree 30.8 30.2 Bachelor’s degree or higher 44.1 20.3 Marital status <0.0001 Married 68.2 54.4 Widowed 3.7 7.5 Divorced 11.2 14.9 Separated 1.7 3.9 Never married 9.9 11.8 Living with partner 5.3 7.5 Monthly household income <0.0001 Low ($0–$1649) 13.1 26.1 Middle ($1650–$4599) 31.2 45.8 High (≥$4600) 55.7 28.1 Length of time since last dentist visit <0.0001 0 to 6 months 59.5 39.1 6 months to 1 year 14.4 13.2 1 to 2 years 10.1 13.1 2 to 3 years 5.6 7.3 3 to 5 y ears 4.7 8.0 5+ years 5.5 17.6 Never visited dentist 0.3 1.7 Needed dental in last year and didn’t get it (yes) 11.4 25.4 <0.0001 Current smoker <0.0001 Every day 24.8 41.6 Some days 6.1 7.5 Not at all 69.1 50.9 Averages 2+ drinks per day (yes) 25.6 41.0 <0.0001 Number of prescriptions <0.0001 0–1 57.9 53.2 2–4 29.3 26.9 5–10 11.7 17.3 ≥11 1.1 2.5 Health insurance coverage (yes) 87.5 74.9 <0.0001 General health condition <0.0001 Excellent 13.5 8.2 Very good 36.3 27.4 Good 37.6 42.2 Fair 11.0 18.8 Poor 1.6 3.5 Chronic condition Periodontitis Weighted % Unadjusted P Adjusted P Hypertension No 37.2 <0.0001 0.325 Yes 46.8 Arthritis No 38.6 0.002 0.615 Yes 43.8 Cardiovascular disease No 39.1 <0.001 0.020 Yes 61.9 Heart failure No 39.3 <0.001 0.001 Yes 70.1 Stroke No 39.6 0.002 0.730 Yes 56.5 Diabetes No 37.9 <0.001 <0.001 Yes 57.7 Kidney disease/failure No 39.5 0.003 0.163 Yes 55.1 Obesity No 38.4 0.004 0.093 Yes 42.5 Depression or anxiety No 39.3 0.013 0.928 Yes 47.9 Notes: Unadjusted P values are from PROC SURVEYFREQ in SAS. Adjusted P values are from weighted logistic regression models on the imputed data with the binary chronic condition variable as a predictor and adjusted for age, gender, race/ethnicity, education, income, health insurance status, smoking, and alcohol use.
Parameter OR 95% CI Basic MM No (reference) Yes 0.98 0.91 1.06 Age 30 to 35 years 40 to 49 years 0.72 0.63 0.82 50 to 64 years 1.36 1.18 1.57 ≥65 years 2.80 2.40 3.27 Sex Female (reference) Male 1.44 1.36 1.51 Race/ethnicity Non-Hispanic White (reference) Mexican American 1.18 0.99 1.42 Non-Hispanic Asian 1.49 1.19 1.88 Non-Hispanic Black 1.30 1.06 1.61 Other Hispanic 0.95 0.79 1.13 Other race 0.75 0.47 1.18 Education College degree or higher (reference) <9th grade 1.52 1.21 1.90 9th to 11th grade 1.33 1.07 1.65 High school diploma or equivalent 1.17 1.05 1.29 Some college/associate’s degree 0.82 0.74 0.90 Income High (reference) Low 1.25 1.10 1.43 Middle 1.22 1.08 1.39 Health insurance status Yes (reference) No 1.29 1.20 1.39 Smoking Not at all (reference) Every day 1.34 1.15 1.56 Some days 1.06 0.84 1.34 Alcohol: 2 or more drinks/day No (reference) Yes 1.18 1.07 1.31 Notes: Results from each imputed dataset combined using PROC MIANALYZE, odds ratios (ORs), with 95% confidence intervals (CIs) and P values. Sensitivity analysis: Model results assuming all missing smoking is “Everyday” and all missing alcohol is “Yes”.
Abbreviations: MM, multimorbidity; CI, confidence interval.
Appendix 1. Qualifying Conditions From Fortin et al. and Corresponding National Health and Nutrition Examination Survey (NHANES) Categories
Chronic condition NHANES 1. Hypertension (high blood pressure) BPQ020 2. Depression or anxiety DPQ010- DPQ090 PHQ9 score calulated 3. Chronic musculoskeletal conditions causing pain or limitation No corresponding data 4. Arthritis and/or rheumatoid arthritis MCQ160a 5. Osteoporosis OSQ060 6. Asthma, chronic obstructive pulmonary disease (COPD), or chronic bronchitis MCQ010, MCQ0160o, MCQ0160k 7. Cardiovascular disease (angina, myocardial infarction, atrial fibrillation, poor circulation in the lower limbs) MCQ160d, MCQ160e, 8. Heart failure (including valve problems or replacement) MCQ160b 9. Stroke and transient ischemic attack MCQ160f 10. Stomach problem (reflux, heartburn, or gastric ulcer) No corresponding data 11. Colon problem (irritable bowel, Crohn’s disease, ulcerative colitis, diverticulosis) No corresponding data 12. Chronic hepatitis HEQ010, HEQ030 13. Diabetes DIQ010 14. Thyroid disorder MCQ170m 15. Any cancer in the previous 5 years (including melanoma, but excluding other skin cancers) MCQ220 16. Kidney disease or failure KIQ022, KIQ025 17. Chronic urinary problem No corresponding data 18. Dementia or Alzheimer’s disease MCQ084 19. Hyperlipidemia (high cholesterol) BPQ080 20. Obesity (diagnosed through the calculation of the body mass index) BMXBMI


