
Abstract
Background: The Person-Centered Primary Care Measure (PCPCM) is a relatively new and concise yet comprehensive measure of primary care quality. The objectives of this study are to administer the PCPCM in Canada and to understand whether there is an association between the PCPCM and sociodemographic and patient experience measures.
Methods: The PCPCM was added to the routine patient experience survey administered at a multi-site academic primary care practice in Toronto, Canada. The survey was administered to patients with an e-mail on file and included questions on demographics, timely access, patient-centeredness, care continuity, and the PCPCM. Descriptive statistics were used to summarize the PCPCM. We used 1-way analysis of variance to determine whether there was an association between the PCPCM and patient demographics and patient experience measures at the team level.
Results: We analyzed 2581 survey responses. The mean PCPCM score was 3.47. The PCPCM was higher for people with better health status (P < .001), those born in Canada (P = .036), those with higher educational attainment (P = .003), and those who knew their provider for longer (P < .001). There was no significant association between PCPCM and income quintile (P = .417). The PCPCM was significantly associated with all 9 patient experience measures related to access, patient-centeredness, and care continuity (P < .001).
Conclusions: The 11-item PCPCM is a feasible and meaningful measure that reflects patient-reported access, continuity, and patient-centeredness and can be incorporated into primary care patient experience surveys to evaluate and improve quality of care.
- Ambulatory Care
- Analysis of Variance
- Canada
- Continuity of Patient Care
- Family Medicine
- Patient Reported Outcome Measures
- Patient Satisfaction
- Primary Health Care
- Quality Improvement
Introduction
Primary care is the cornerstone of health systems. Improving primary care quality has the potential to improve population health yet understanding quality in primary care has been fraught. Measurement of primary care performance has largely relied on the piecemeal assessment of individual components of care or guideline-recommended services for specific conditions.1,2 Although more comprehensive measures of primary care quality exist, they tend to be long and rarely used outside of the research setting.3,4 Critics have decried excessive measurement as being not only time-consuming and costly, but also ineffective.5,6,7(p3)
The Person-Centered Primary Care Measure (PCPCM) is a relatively new concise yet comprehensive measure of quality.8 The PCPCM is a patient-reported single 11-item outcome measure that is collected via patient survey and evaluates key domains of primary care (accessibility, advocacy, community context, comprehensiveness, coordination, family context, goal-oriented care, health promotion, integration, relationship, and shared experience) (Online Appendix, Exhibit 1). Unlike other patient satisfaction or patient experience measures, the PCPCM is a patient's perception of whether or not primary care was present and to what extent. It was developed based on what patients, primary care clinicians, and health care payers consider valuable components of primary care and incorporates the core components of primary care outlined by Barbara Starfield and others.9 The PCPCM demonstrated reliability and concurrent validity within an online sample and clinical sample in the United States (US) and has been endorsed by both the US National Quality Forum and the US Center for Medicaid and Medicare Services after a rigorous review process.10 However, the measure has not been implemented in many primary care settings in the US or globally. It is also unclear how the PCPCM varies by patient sociodemographic characteristics and how it relates to more traditional measures of patient experience, which is important to understand when considering the strengths or possible blind spots of the PCPCM.
We implemented the PCPCM in a multi-site primary care practice in Canada as part of routine patient experience measurement. Our study sought to understand how the PCPCM performed in our setting, the variation by patient sociodemographic characteristics, and the association between the PCPCM and measures of access, continuity, and patient-centredness at the team and physician level.
Methods
Context and Setting
St. Michael's Hospital Academic Family Health Team (SMHAFHT) serves roughly 49,000 rostered patients across 6 clinics located in downtown Toronto, Canada. The team includes approximately 80 staff physicians as well as 40 resident physicians and 60 other health professionals such as nurses, dietitians, and social workers. The patient population is diverse and includes urban professionals and young families as well as marginalized groups including new immigrants, refugees, those who are homeless, and people struggling with mental health and addictions. The vast majority of patients are permanent residents of Ontario and insured through the Ontario Health Insurance Plan (OHIP) which provides first dollar coverage for all physician visits and medically necessary tests. SMHAFHT has a robust Quality Improvement program, measures and reports on more than 30 quality indicators, and has successfully made improvements in areas such as cancer screening and after-hours access.11⇓–13
Patient Experience Survey
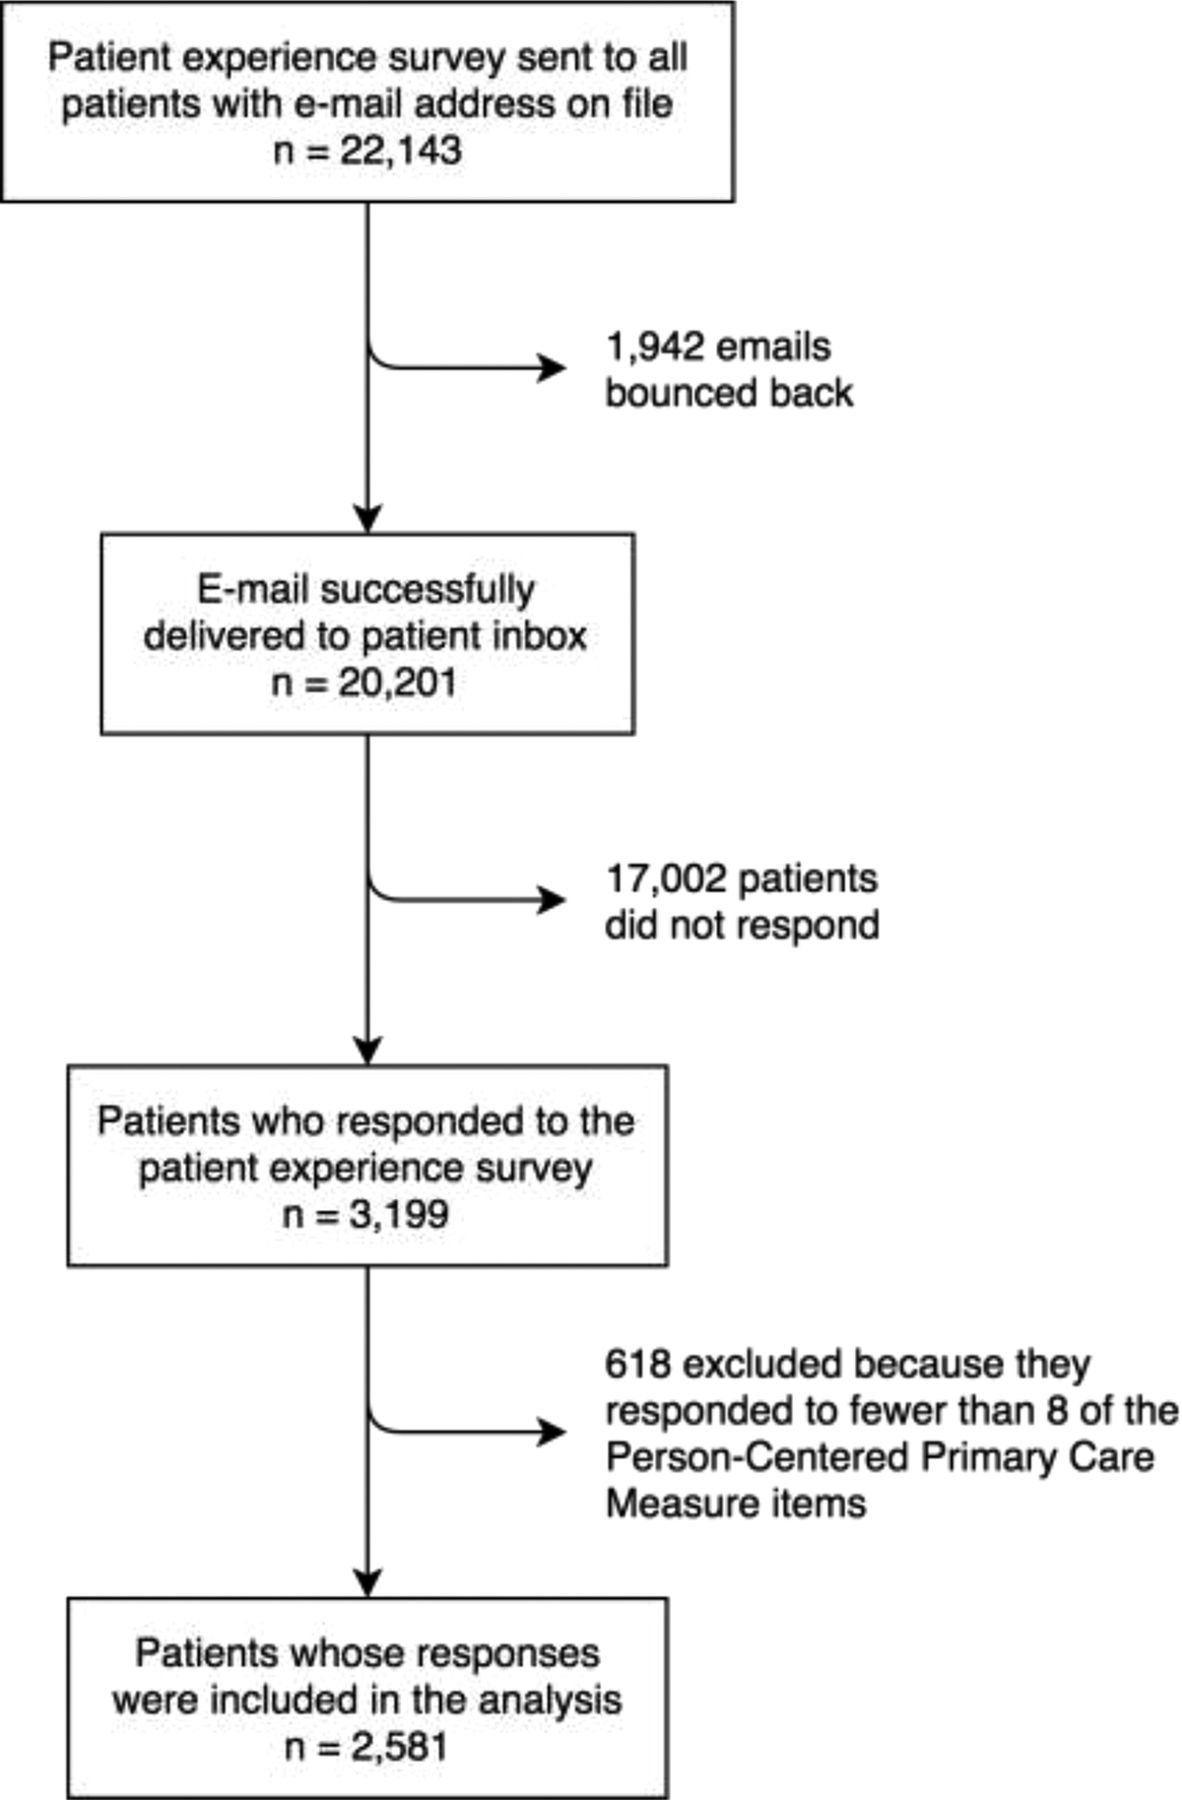
SMHAFHT has been routinely conducting a patient experience survey since 2014. All patients with an e-mail on file receive an e-mail in their birth month inviting them to complete the survey. One reminder is sent 2 weeks later. The survey is in English, administered via Qualtrics, and anonymous. Children were eligible and parents responded as a proxy. It includes 47 items including questions pertaining to timely access, patient-centredness, care continuity, knowledge of after-hours services, and demographics. Most survey items were asked on either a 4- or 5-item Likert scale. There are 2 open-ended questions soliciting broad feedback. Beginning in January 2019, the 11 items that comprise the PCPCM were added as a block at the end of the patient experience survey and noted as optional. The PCPCM and practice patient experience survey were developed with input from the public and patients, respectively. Results of this study will be shared with the practice's patient advisors.
Study Design and Population
We conducted a cross-sectional study to understand the team-level association between the PCPCM score and (i) patient demographics and (ii) patient experience measures. We also conducted a provider-level analysis for patient experience measures. We included all patient responses from the 2019 patient experience survey. In their review of the PCPCM, the US National Quality Form and the US Center for Medicaid and Medicare Services stated that a minimum of 150 responses were required to evaluate the performance of a clinic with 5 or more physicians (as was the case at each clinic included in our study); to evaluate the performance of an individual physician, a minimum of 30 responses are required. As such, for the provider-level analysis, we included providers if they had at least 30 patients who responded to the 2019 survey and excluded patient surveys with invalid responses. Using this process, the PCPCM has been shown to be able to discern performance variation among practices and clinicians. This initiative was formally reviewed by institutional authorities at Unity Health Toronto and deemed to neither require Research Ethics Board approval nor written informed consent from participants.
Variables and Data Analysis
Consistent with the original validation of the instrument, we calculated the PCPCM score for participants who answered at least 8 PCPCM items. The PCPCM score was computed by taking the sum of the item responses divided by the number of responses. Scores can range from a low of 1.0 to a high of 4.0, with higher scores indicating patients reporting a greater frequency of experiencing the domains of primary care addressed by the items.
All demographic and patient experience measure variables were treated as multicategorical variables. Patient demographics analyzed included: age, gender, self-reported health status, immigration status, education, income quintile, clinic, provider type, and years with provider. Patient experience measures are outlined in Table 1. For the team-level analysis, we generated the overall PCPCM score as well as the responses to each of the 11 PCPCM items for each sociodemographic strata. We used 1-way analysis of variance (ANOVA) to determine whether there was an association among the mean PCPCM score and various patient demographics and patient experience measures. Significance was determined by P < .05.
Demographic Characteristics of Respondents and Person-Centered Primary Care Measure (PCPCM) Score Stratified by Sociodemographic Variables
For the provider-level analysis, we used linear regression and calculated the R-squared (R2) between the PCPCM score (dependent variable) and 9 patient experience measures (independent variable) to understand how much of the total variation in the PCPCM can be explained by patient experience measures. IBM SPSS Statistical Software v.26 was used for descriptive statistics and ANOVA tests. Microsoft Excel Version 16.16 was used to calculate the R2.
Results
We analyzed data for 2581 survey respondents (See Online Appendix, Exhibit 2). Approximately one-third of respondents were between 50 and 64, 60% were female, 13% reported their health as fair or poor, 25% immigrated in the past 10 years, 14% had less than a college degree, and 28% had been with their provider 10 or more years (Table 1). Over 90% of respondents identify a staff physician as their primary care provider (Table 1).
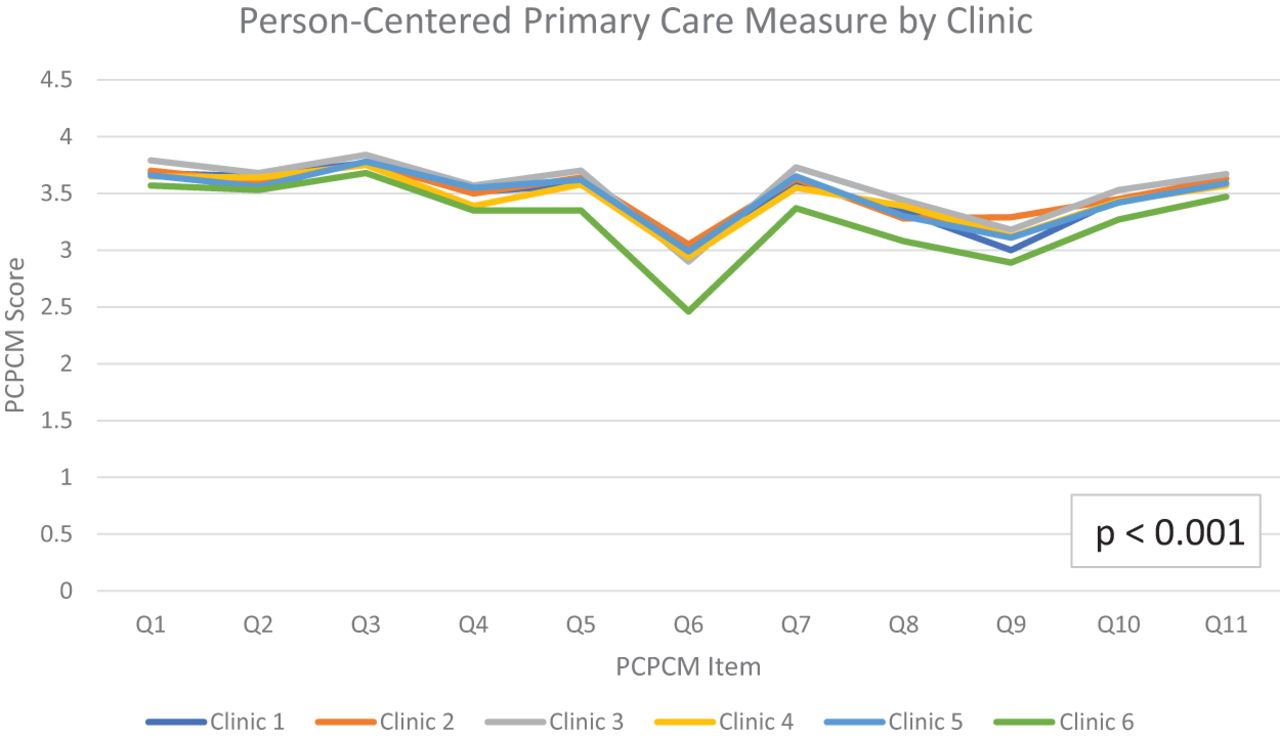
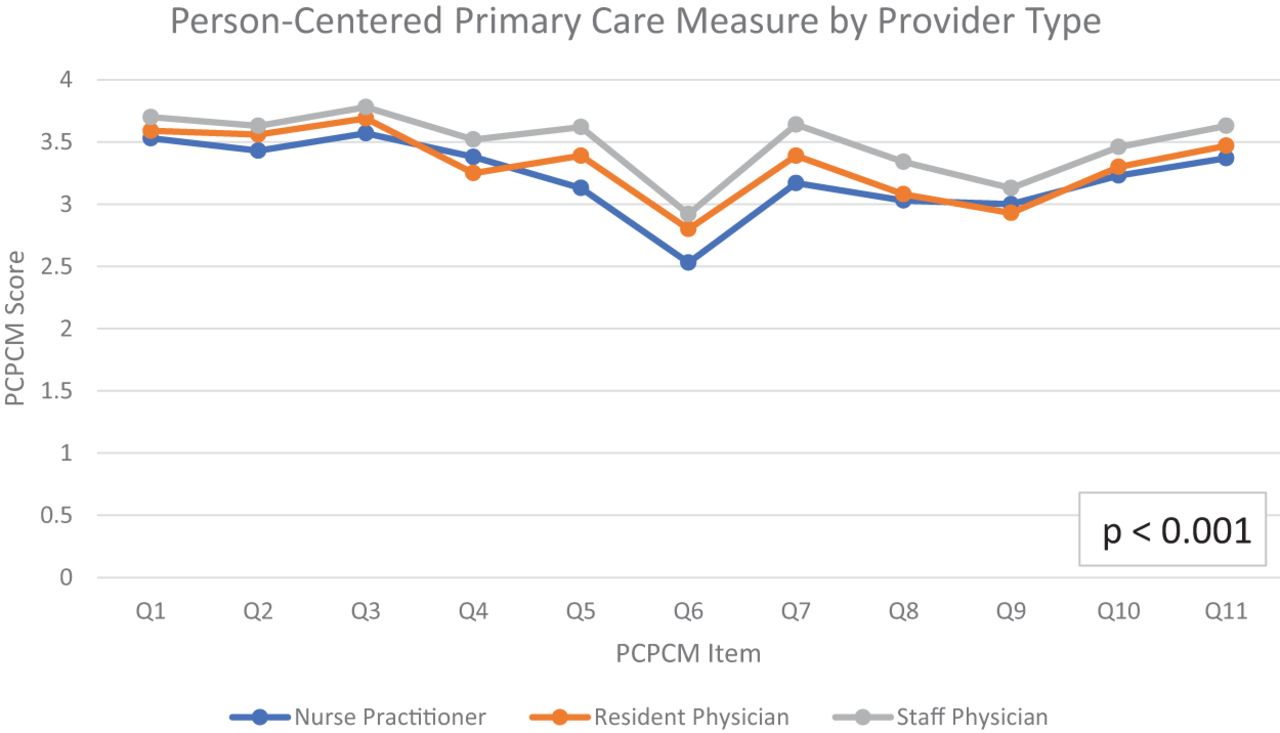
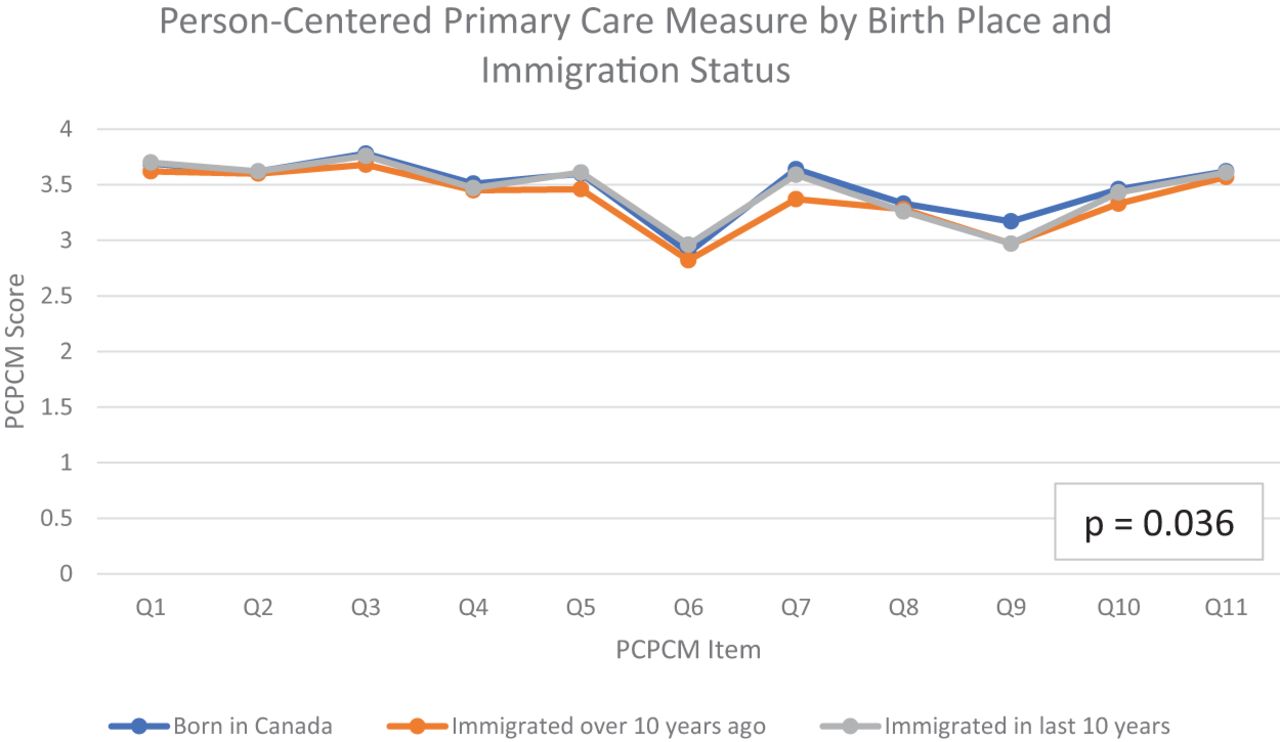
The PCPCM score for the sample (n = 2581) was 3.47. There was a significant difference in PCPCM score by age, gender, health status, immigration status, education, clinic, provider type, and the number of years a patient had known their provider (Table 1). The score was higher for men, those with better self-reported health, those born in Canada, people with higher educational attainment, having a staff physician as their primary care provider, and having known their provider for more than 20 years.
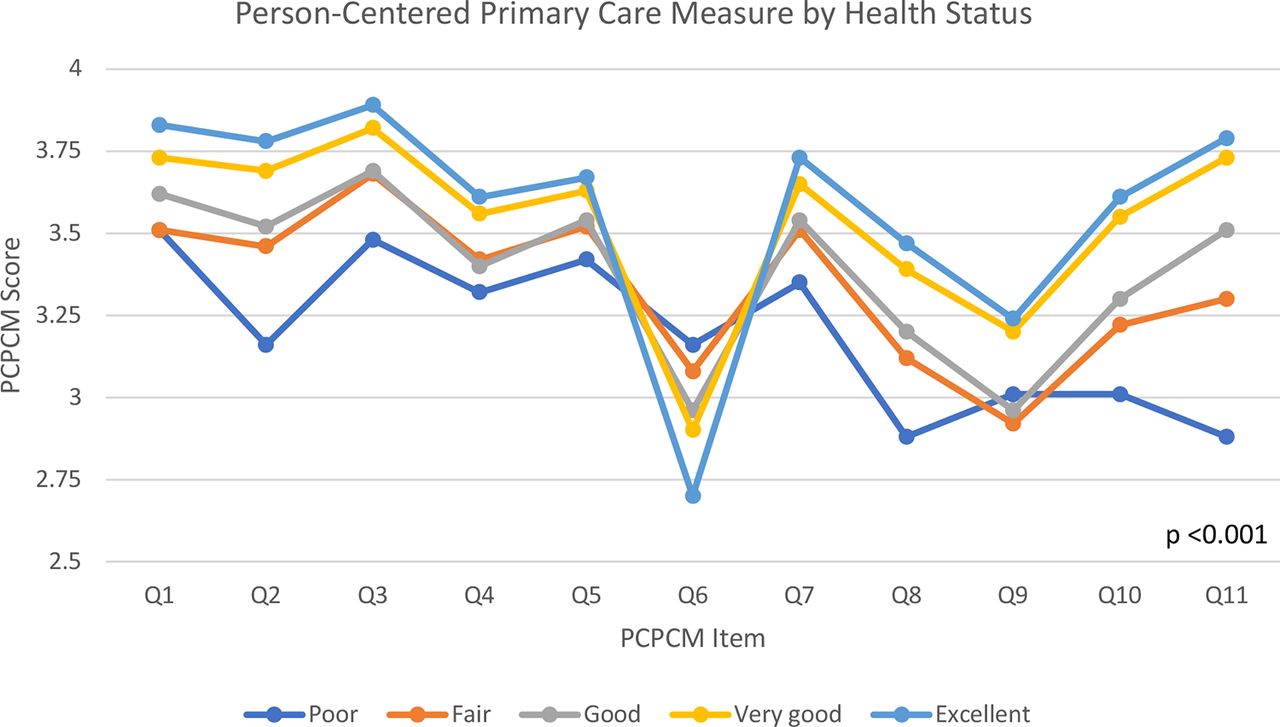
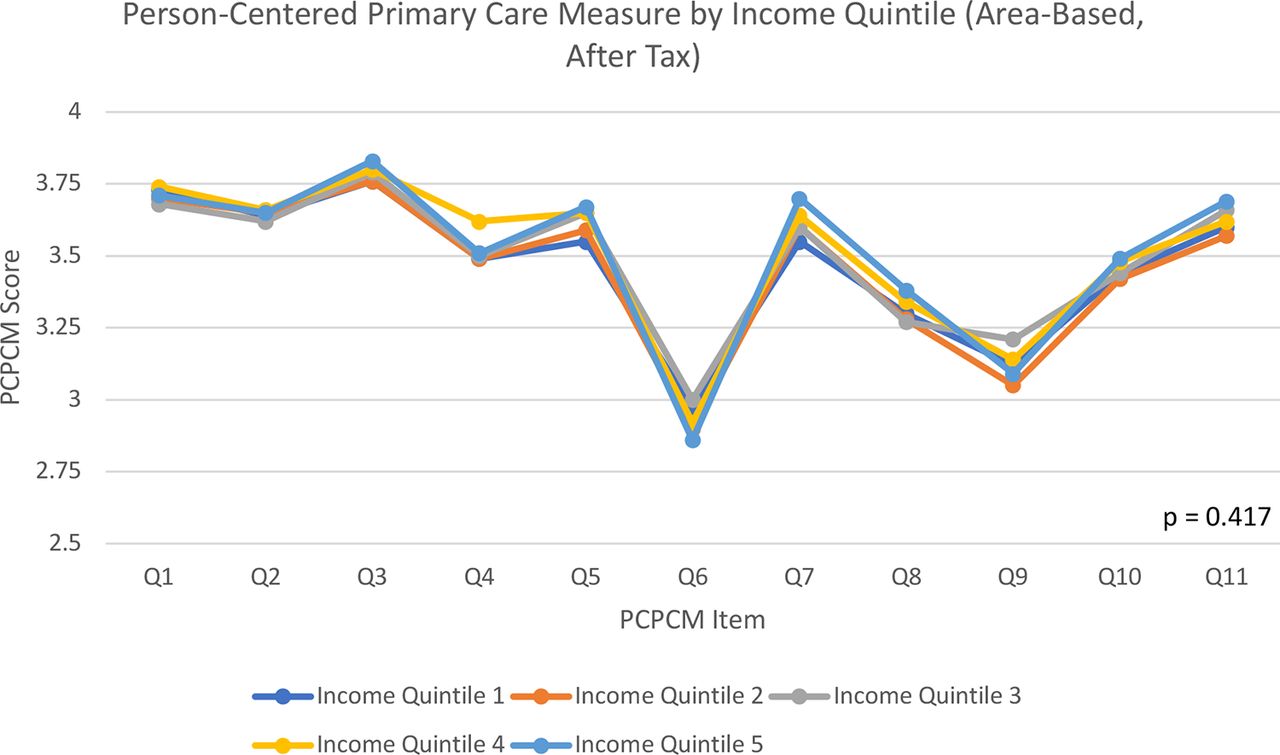
In most cases, the group with the highest mean PCPCM also had higher scores for each of the 11 items with a consistent gradient between categories. For example, those who had known their provider longer had a higher mean PCPCM score, but also higher scores for each of the 11 PCPCM items (Figure 1a). The pattern observed for health status was different. Although those who self-reported excellent health status had the highest mean PCPCM score, they reported lower scores for item 6, “My doctor and I have been through a lot together” (Figure 1b). Notably, there was no significant difference in the mean PCPCM score by income quintile and curves for each income quintile overlapped 1 another (Figure 1c). Figures of the PCPCM stratified by the other sociodemographic variables are provided in the Online Appendix, Exhibit 2.
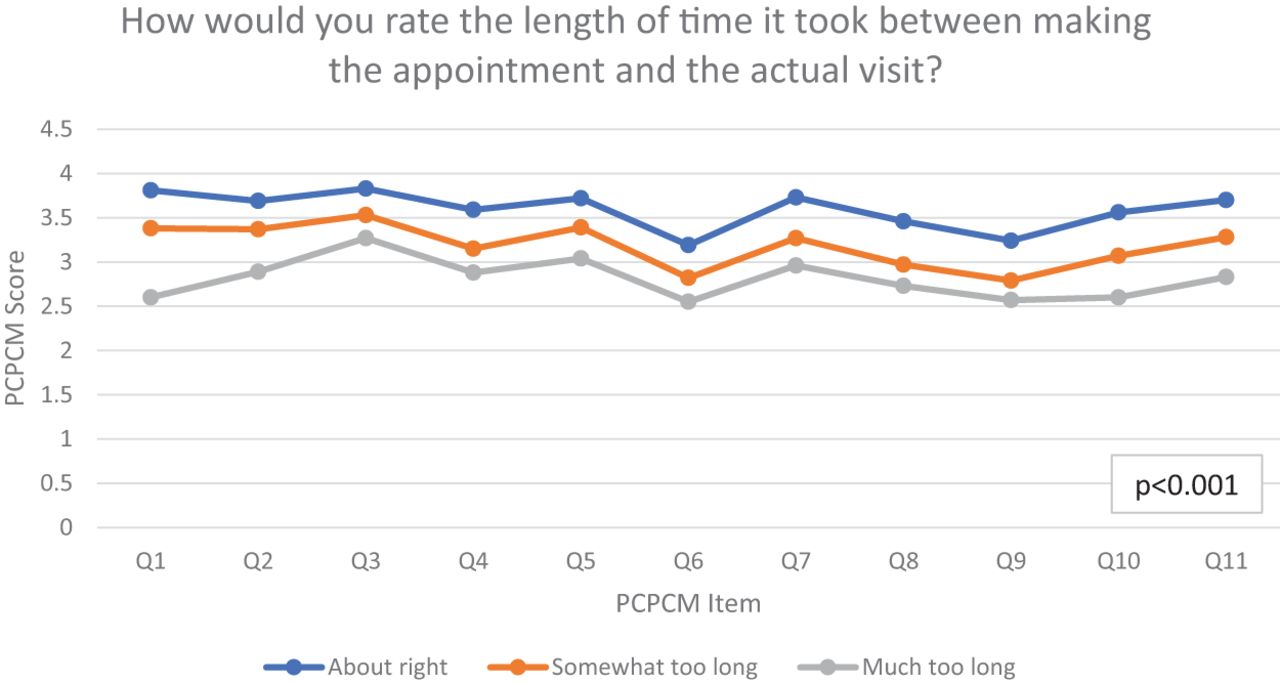
There was a significant association between overall PCPCM score and all 9 patient experience measures (Table 2). Having same day or next day access when sick, “about right” length of time between making the appointment and the actual visit, receiving answers to questions or concerns on the same day, easy access to evening, weekend, or holiday care, being able to speak with their preferred provider, having the opportunity to ask questions about treatment, having providers spending enough time, and involving patients in decisions about care were associated with a higher PCPCM score.
Person-Centered Primary Care Measure (PCPCM) Score Stratified by Patient Experience Measures
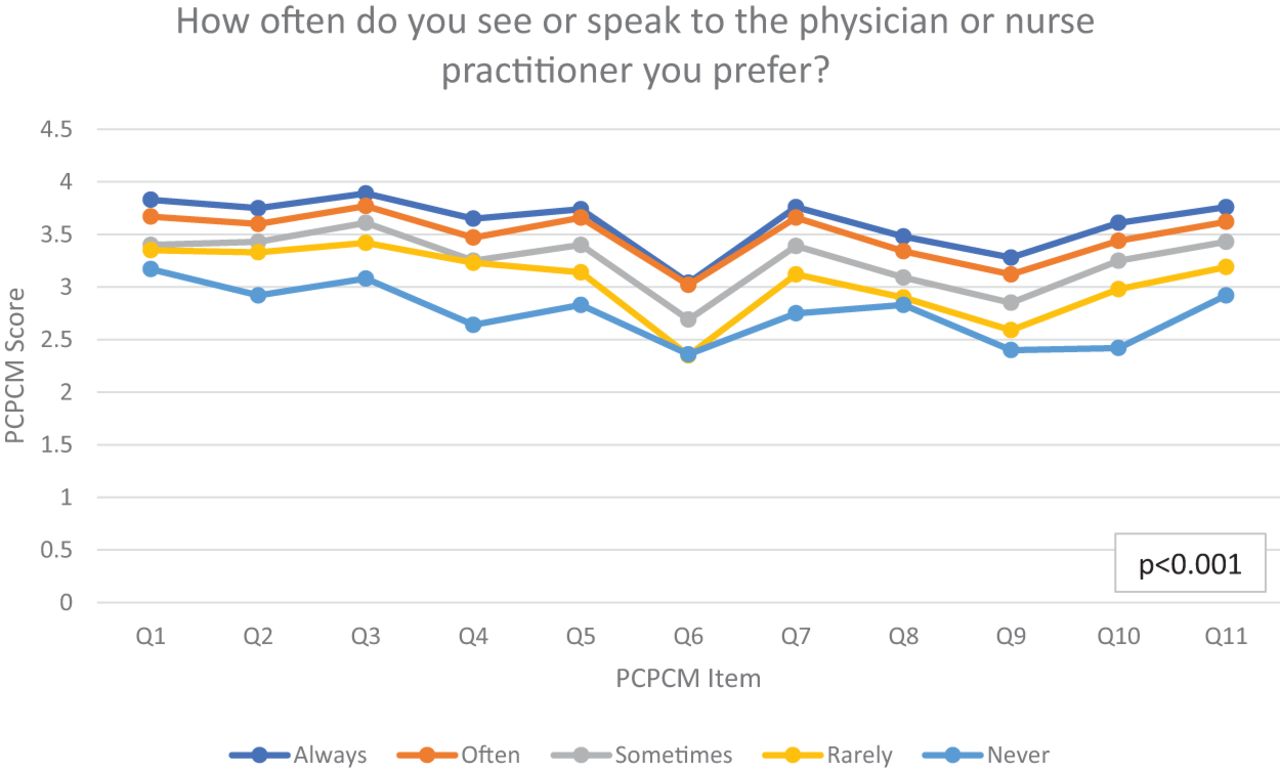
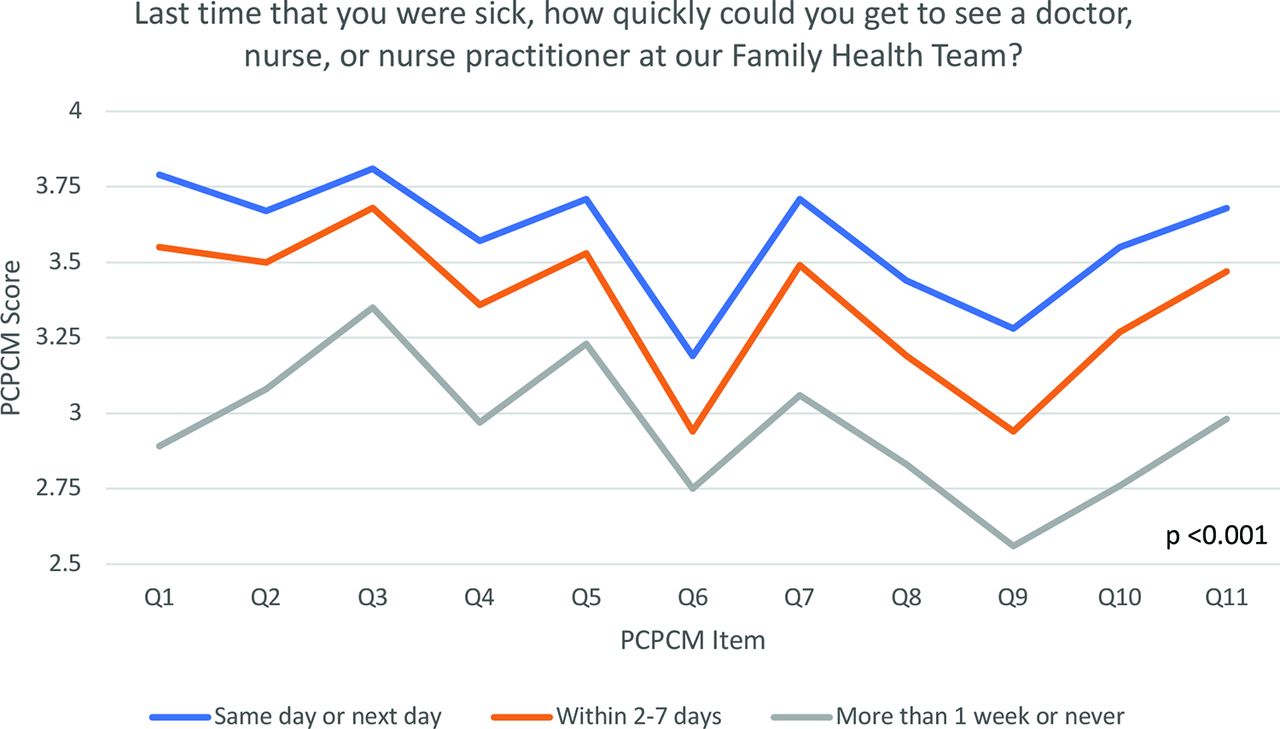
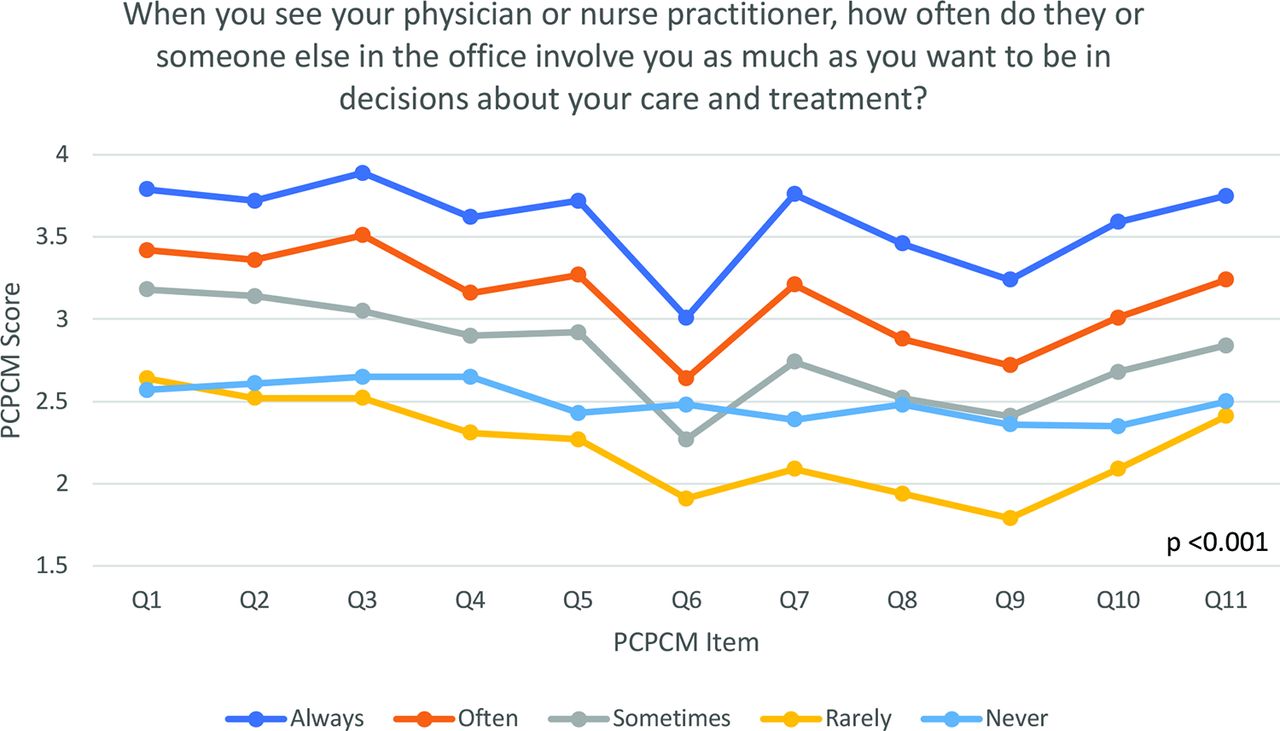
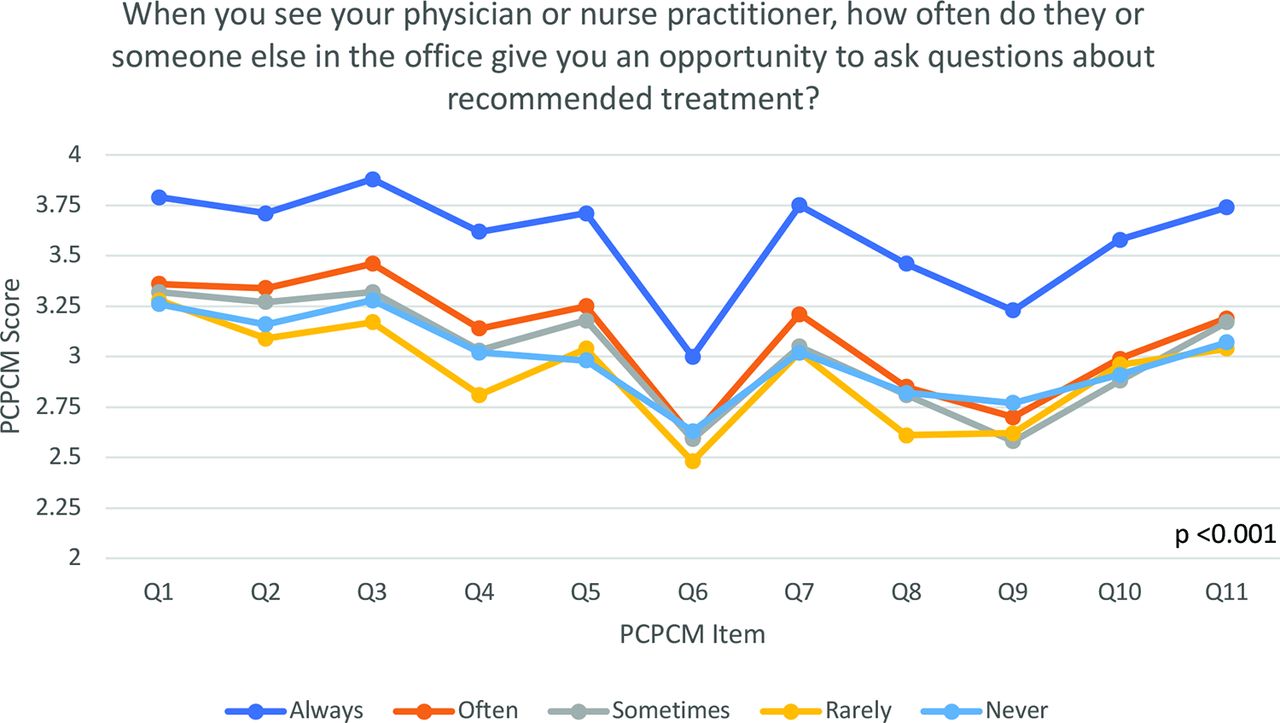
Figure 2a depicts a typical pattern. Patients who reported same or next day access when sick provided a higher rating for each PCPCM item compared with those who reported seeing a provider within 2 to 7 days who in turn provided a higher rating compared with those who reported it taking more than 1 week to see a provider. Figure 2b and Figure 2c illustrate similar patterns but with more overlap among those reporting less involvement in care or opportunity to ask questions. Figures of the PCPCM stratified by the other patient experience measures are provided in the Online Appendix, Exhibit 3.
We included responses for 36 providers in the analysis that tested the association between PCPCM score and patient experience measures at the individual provider level (Table 3). The R2 was below 3.5 for all patient experience measures with 2 exceptions: spending enough time with the patient (R2 = 0.5) and the length of time it took between making the appointment and the actual visit (R2 = 0.4).
Individual Provider Level Person-Centered Primary Care Measure (PCPCM) by Patient Experience Measures
Discussion
For the last decade, primary care leaders have been calling for more meaningful measurement to understand quality in practice—measures that capture whole-person, relationship-based care instead of care of specific diseases or individual body parts.14⇓–16 The PCPCM not only includes the key domains of primary care of access, coordination, comprehensiveness, and continuity but also additional aspects of primary care, such as integration of care, attention to social drivers of health, and awareness of patient health goals.8 Our findings confirm that the PCPCM is a promising new measure of quality in primary care at the team-level that aligns with more traditional patient experience measures and shows appropriate variation by sociodemographic characteristics. We incorporated the PCPCM questions in a routine practice patient experience survey and found a significant association between the overall PCPCM score and patient responses to specific questions on timely access, continuity, and patient-centredness at the team level but not as consistent an association at the physician-level. Team scores were higher for patients who had a longer relationship with their provider and patients who reported a staff physician as their provider. They were also higher for men, those with better self-reported health, those born in Canada, and those with higher educational attainment reinforcing the need for improvement efforts that target specific populations.
The overall PCPCM score in our practice was 3.47 and considered strong. It was substantially higher than the 2.75 (n = 367) score reported from an online survey of Canadians and 2.83 score (n = 1140) reported from an online survey of Americans.8 However, 19% of those in the online survey of Americans did not report having a single provider for their care.8 The overall score in our sample was similar to the score of 3.53 (n = 323) from a high-performing clinical primary care sample in the US.
Knowing your provider for longer was significantly associated with a higher PCPCM score. This finding fits with evidence demonstrating the association between relational continuity and better patient satisfaction, improved medication adherence, lower mortality, and decreased health care costs.17,18 Our finding may also be related to patients choosing to stay with a provider that they find accessible, knowledgeable, and patient-centered. In contrast, the curves for PCPCM by health status were unusual. Those who self-reported excellent health status had the highest PCPCM score, despite not reporting going through a lot with their provider while those with poor health status reported going through more with their provider but rated other aspects of care lower. These findings are consistent with other studies showing those with poorer self-reported health have poorer patient experience which may relate to differing needs and expectations for those who are chronically ill.19
Our findings differ from what Etz et al. found in their initial evaluation. With their combined clinical primary care sample in the US, there was no difference in the PCPCM by age or gender.8 Although the PCPCM was higher for those who knew their physician longer, this association was not clinically significant. Their findings may differ because of the sample size and method of survey distribution. Ronis et al. evaluated the PCPCM in a pediatric resident continuity clinic. They found no association between the PCPCM score and most demographic variables, including parent- or child- age, parent education level, and parents' assessment of their child's health.20 However, they did find a significant association between the PCPCM and parent gender.
Remarkably, the PCPCM did not vary significantly by income quintile, despite well-documented income-related inequalities in health including access to care and health outcomes.21 Studies have shown that people with lower income report a poorer health care experience regarding access and quality of care. For example, Okunrintemi et al. found that lower income was associated with greater difficulty accessing care, experiencing poor communication, experiencing delays in care, and reported poor provider satisfaction.22 Our practice has a long history of serving the sick and poor and it is possible that our model of care mitigates the usual inequities seen with income. Alternatively, it may be that we were unable to capture differences because we used area-based income quintiles rather than individual-level income measures,23 or that the measure itself does not adequately capture disparities related to income. Further studies are needed to explore this relationship between PCPCM and income.
PCPCM scores that are statistically different from one another for a particular sociodemographic characteristic can highlight potential areas for improvement. However, statistical significance does not necessarily indicate clinical significance. To determine whether or not a numeric difference in PCPCM scores are clinically significant, the standard deviation can be used.24 If the numeric difference is at least 20% of the standard deviation, it is considered clinically significant. If the numeric difference is 50% of the standard deviation, it is a medium amount of clinical significance. If the numeric difference is 80% of the standard deviation or larger, it is a large amount of clinical significance. Thus, a larger numeric difference between PCPCM scores in relation to the standard deviation may help to prioritize improvement efforts.
Our study has both strengths and limitations. Given the survey was only sent to those patients with an e-mail address, there is the potential for a response bias. Our response rate was low compared with general population surveys but similar to response rates for other patient-reported measures.25 Regardless, we had well over the 150 responses required for evaluating clinic-level quality, as endorsed by the US Center for Medicaid and Medicare Services. Other strengths include the incorporation of the PCPCM into a routine patient experience survey and the stratification of the PCPCM by multiple sociodemographic and patient experience variables. However, survey respondents may not be representative of all patients in the practice given the response rate and that the survey was distributed by e-mail. It is also possible that patients would have responded differently to the PCPCM questions if these had been asked independent of the other patient experience items. Lastly, we report findings from 6 clinics that are part of a high-performing primary care organization. Replication of these results in other Canadian primary settings will be important to establish the measure's generalizability.
Conclusion
Our study demonstrates that the PCPCM is a feasible and meaningful measure that reflects patient-reported access, continuity, and patient-centeredness and can be incorporated into patient experience surveys to help teams evaluate and improve quality of care. For practices, a relatively low PCPCM score or a high numeric difference between PCPCM scores relative to the standard deviation could signal the need for further evaluation with more traditional patient-reported measures of primary care to identify areas for improvement. If the measure was used for accountability by payors, there would need to be consideration for case-mix adjustment given its variation by age, gender, health status, immigration status, education, and the number of years a patient has known their provider. More research is needed to understand whether it can help distinguish provider-level performance, whether the score is amenable to quality improvement efforts, and whether it relates to clinical outcomes.

Person-Centered Primary Care Measure (PCPCM) by years with provider.

Person-Centered Primary Care Measure (PCPCM) by health status.

Person-Centered Primary Care Measure (PCPCM) by income quintile.

Person-Centered Primary Care Measure (PCPCM) by same day/next day access.

Person-Centered Primary Care Measure (PCPCM) by involvement in care.

Person-Centered Primary Care Measure (PCPCM) by opportunity to ask questions.
Acknowledgments
Thank you to Stephen Zyzanski who provided assistance on statistical analysis, Mohammad AlHaj who managed and provided the patient experience survey data, and Sarah Reves who provided data from ongoing studies with the PCPCM.
Appendix
Items and Response Categories for the Person-Centered Primary Care Measure (PCPCM)

Patients Who Responded to the Practice's Patient Experience Survey and Were Included in the Analysis.

Person-Centered Primary Care Measure (PCPCM) Stratified by Sociodemographic Variables.

Person-Centered Primary Care Measure (PCPCM) by Clinic.
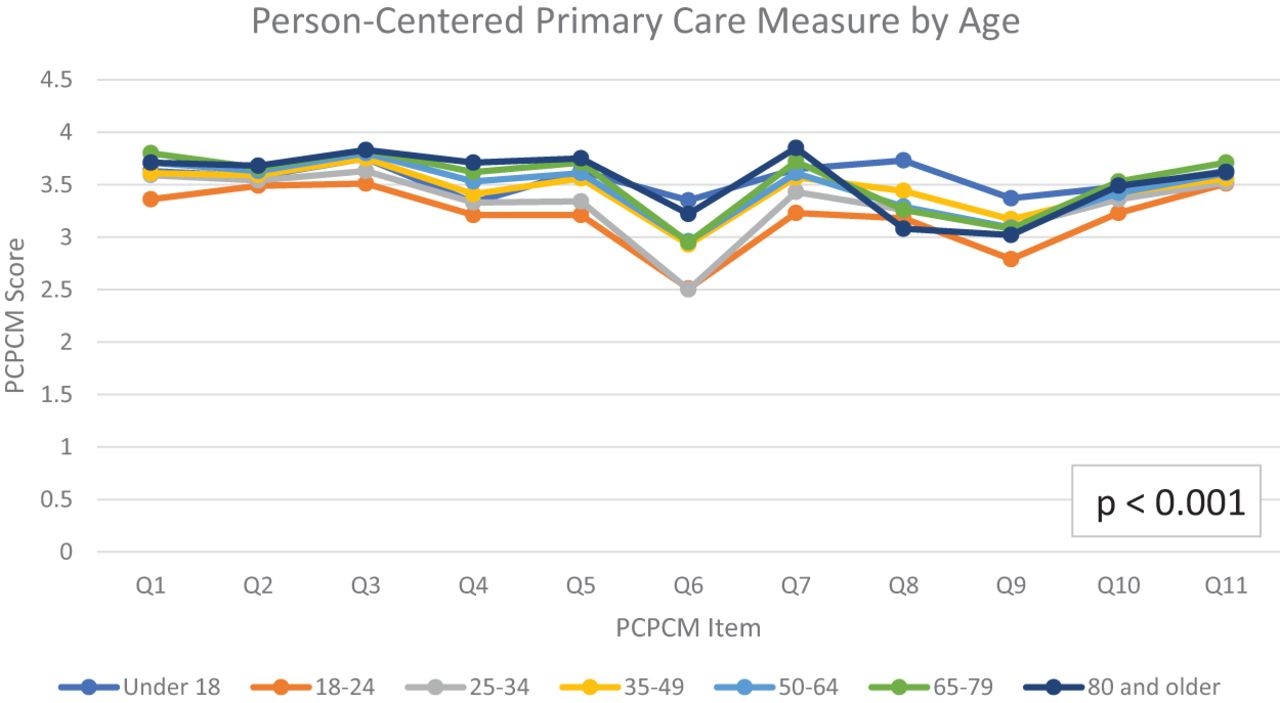
Person-Centered Primary Care Measure (PCPCM) by Age.
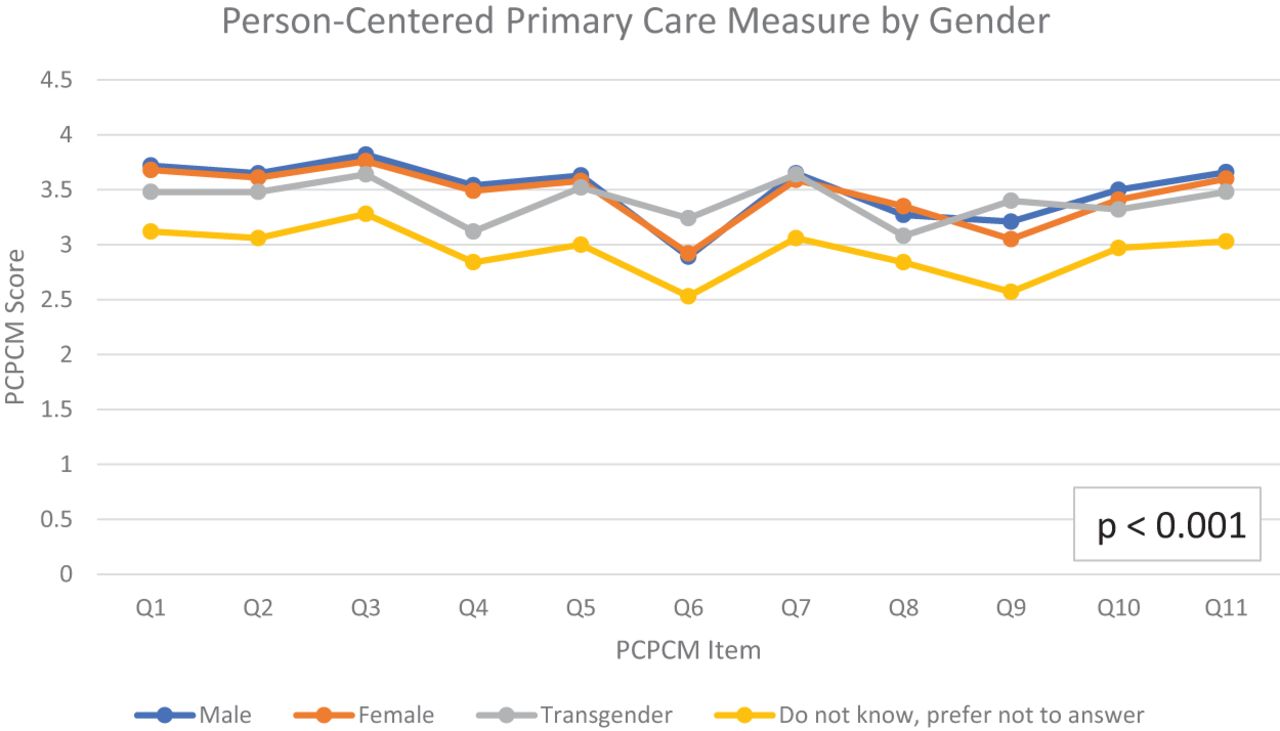
Person-Centered Primary Care Measure (PCPCM) by Gender.

Person-Centered Primary Care Measure (PCPCM) by Provider Type.

Person-Centered Primary Care Measure (PCPCM) by Birth Place and Immigration Status.

Person-Centered Primary Care Measure (PCPCM) by Education.
Person-Centered Primary Care Measure (PCPCM) Stratified by Patient Experience Measures.

Person-Centered Primary Care Measure (PCPCM) by Length of Time between Making Appointment and Visit.

Person-Centered Primary Care Measure (PCPCM) by Access by Phone.
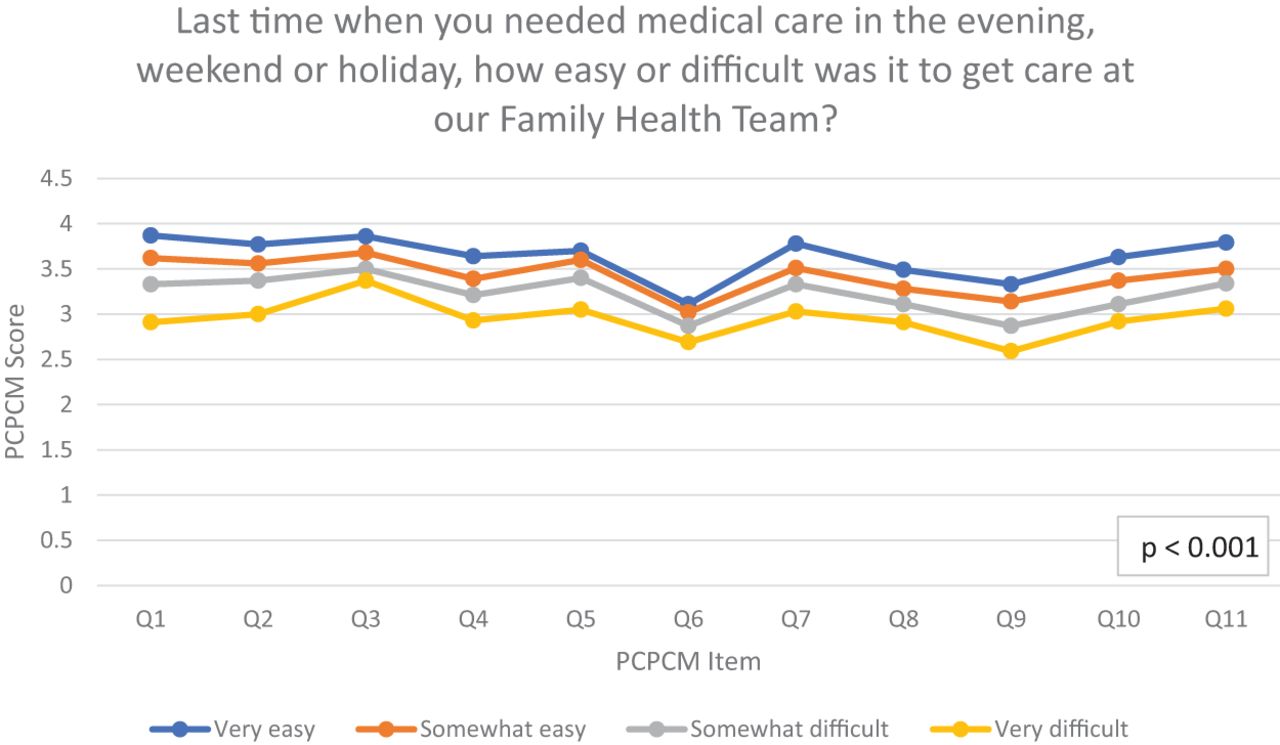
Person-Centered Primary Care Measure (PCPCM) by Access to Evening, Weekend, or Holiday Care.
Person-Centered Primary Care Measure (PCPCM) by Continuity with Preferred Provider.

Person-Centered Primary Care Measure (PCPCM) by Time Spent with Provider.
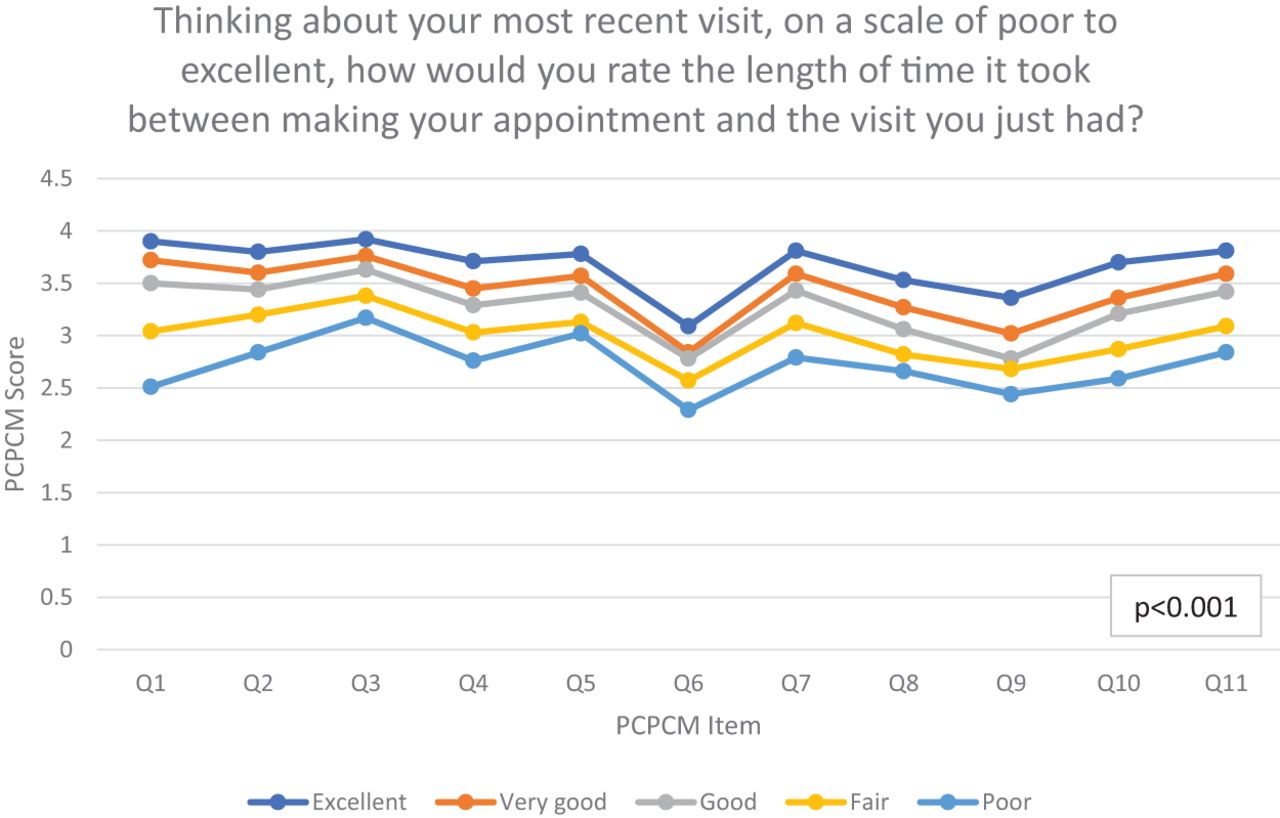
Person-Centered Primary Care Measure (PCPCM) by Length of Time between Making Appointment and Most Recent Visit.
Notes
This article was externally peer reviewed.
Conflicts of interest: None.
Funding: Drs. Kiran and Glazier are supported as Clinician Scientists by the Department of Family and Community Medicine at the University of Toronto and at St. Michael's Hospital. Dr. Kiran is the Fidani Chair of Improvement and Innovation in Family Medicine at the University of Toronto. Funds from the Fidani Chair supported some of this work.
To see this article online, please go to: http://jabfm.org/content/35/4/751.full.
- Received for publication October 26, 2021.
- Revision received January 25, 2022.
- Accepted for publication January 31, 2022.


