
Article Figures & Data
Figures


Tables
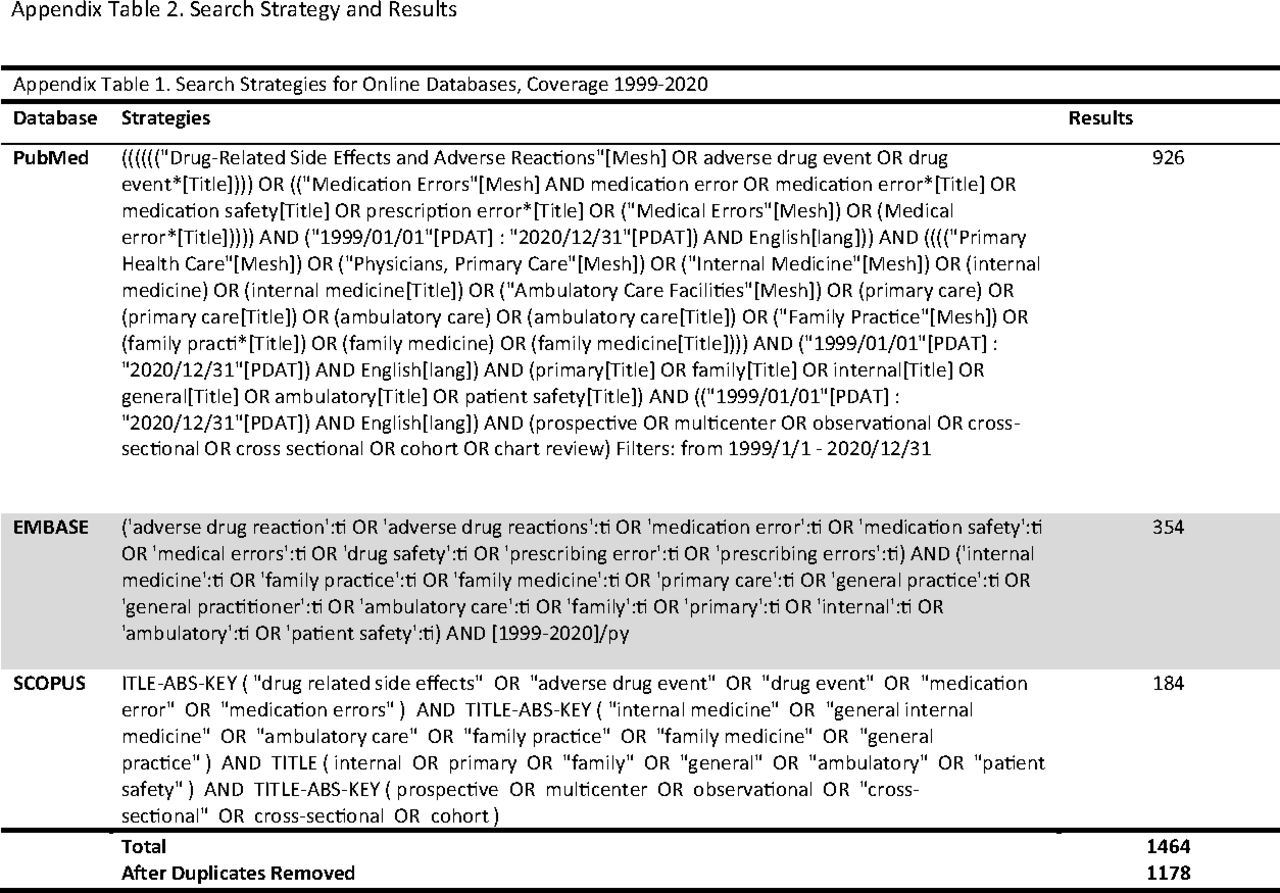
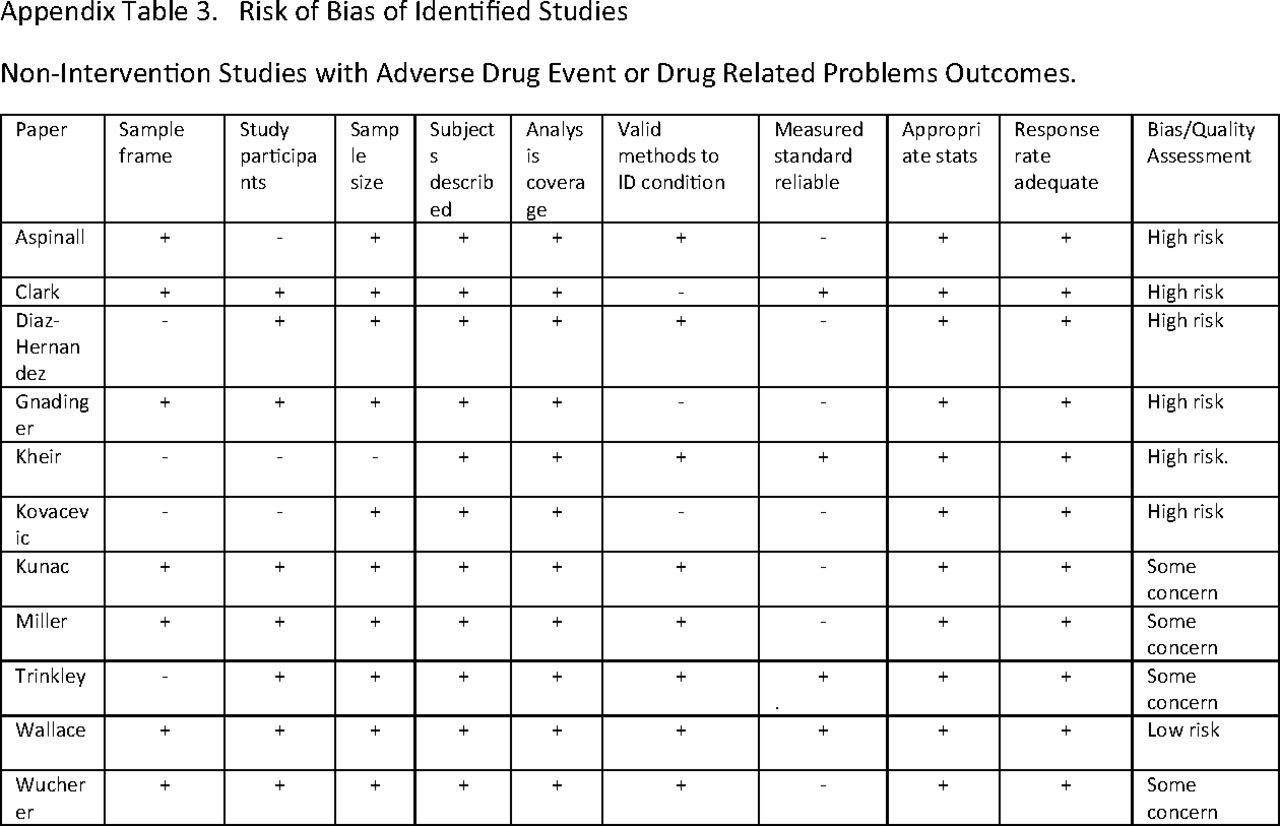
Lead Author (Year) Setting Number of Patients or Prescriptions High-Risk Subpopulation? Definition of Medical Error Error Rate Other Outcomes Abramson15 (2011) PC in NY 2432 paper prescriptions at baseline and 2079 electronic at 1 year No PIP—IOM definition of prescribing errors 16.0% Abramson16 (2012) PC in NY 1629 prescriptions at 3 months postimplementation, 1738 at 1 year No PIP—IOM definition of prescribing errors 4.5% Al-Busadi17(2020) Oman PC 377 patients Ages 65+ PIP—Beers, STOPP 12.7%-17.2% Almeida18 (2019) Brazilian PC 227 patients ≥ 60 years of age PIP—Beers 53.7%-63.4% Amos19 (2015) Italy PC 865,354 patients Ages 65+ PIP—own definition (Maio) 28% had at least one PIP 8%, 10%, and 14% of individuals were prescribed at least one medication that “should always be avoided,” is “rarely appropriate,” and has “some indications but [is] often misused,” respectively. Aspinall20 (2002) Pennsylvania Veterans Affairs PC 198 patient/provider pairs No, but limited to a VA outpatient population ADE—provider or patient report 26% 83 ADEs reported in active surveillance versus 1 in passive reporting Aubert21 (2016) Swiss university PC 1002 patients Ages 50-80 PIP—STOPP
PPO—STARTPIP 6.7%, PPO 27.5% > 65 years, 5.6% PIP, 32.2% PPO Avery22 (2013) England PC 6048 prescriptions for 1777 patients No PIP—own definition 4.9% Awad23 (2019) Kuwait PC 478 patients, 2645 prescriptions Ages 65+ PIP—Beers, STOPP, FORTA, MAI 44.3%-53.1% Barry24 (2016) Northern Ireland PC 6826 patients Medicine for dementia dispensed PIP—STOPP 64.4% Ble25 (2015) UK PC 13,900 patients Ages 65+ PIP—Beers 38.4% any, 17.4% long-term Bregnhoj26 (2007) Danish GP patients 212 patients, 1621 prescriptions Age of 65+, taking 5 or medications PIP—MAI 94.3% Brekke27 (2008) Norwegian GP patients 85,836 patients Ages 70+ PIP—own definition 18.4% Bruin-Huisman28 (2017) Dutch GP patients 4537 patients per year Ages 65+ PIP—STOPP
PPO—START34.7% PIP, 84.8% PPO Cahir29 (2014) Irish PC 931 patients Ages 70+ PIP—STOPP 42% PIP Patients with ≥ 2 PIP indicators were twice as likely to have an ADE (adjusted OR 2.21), have a significantly lower mean HRQoL utility (adjusted coefficient −0.09), and nearly a 2‐fold increased risk in the expected rate of A&E visits (adjusted IRR 1.85). Castillo-Paramo30 (2014) Spanish PC 272 patients Ages 65+ PIP—STOPP
PPO—START37.5%-50.7% Chen31 (2005) England PC 37,940 patients No PIP—own definition 0.19% drug-drug, 0.49% drug-disease Two thirds of PIP medications on PC medication list were started by hospital doctors Clark32 (2007) Scotland PC 2513 ADR reports in year 2000 and 1455 ADR reports in 2001 No ADE—own definition The “top 10” medications accounted for 1715 of 2817 (60.9%, 95% CI 59.1, 62.7) ADE reports but only 2.2 million out of a total of 128 million primary care prescriptions (1.7%). Corona-Rojo33 (2009) Mexico public health centers 1400 patients Ages 70+ PIP—own definition 53% Dhabali34 (2011) Malaysia University PC 17,288 patients No PIP—own definition 5.3% Dhabali35 (2012) Malaysia University PC 23,733 patients No PIP—own definition 0.87% Diaz Hernandez36 (2018) US federally funded PC 2218 patients Ages 65 + with at least one chronic condition who received pharmacy services with 2 or more medications and experienced a medication error or an ADE Potential ADE and ADE—own definition, several sources Medication errors 12.5/100, potential ADE 9.4/100, ADE 5.0/100 Doubova Dubova37 (2007) Mexico PC 624 patients Ages 50+ with nonmalignant pain syndrome who received prescriptions of nonopioid analgesics PIP—own definition 80% Fiss38 (2011) German PC 744 patients Ages 50+ who regularly took one or more drugs, rural areas of Germany, GP home visits PIP—Beers 18% Gnadinger39 (2017) Switzerland PC 197 cases of medication incidents 180 physicians (GP and pediatricians) at 144 practices No “Medication incidents” self-described 2.07 per GP per year = 46.5 per 100,000 contacts. Goren40 (2017) Turkish PC 1206 patients Ages 65+ PIP—own definition 33% They detected 29 (0.9%) A, 380 (11.8%) B, 2494 (77.7%) C, 289 (9%) D, and 18 (0.6%) X risk rating category PIPs Guthrie41 (2011) UK PC 139,404 patients “Particularly vulnerable” defined by age, pre-existing disease, or pre-existing coprescription. PIP—STOPPPPO—START 13.9% Jayaweera42 (2020) US PC 111,461 PCPs who specialized in family medicine, internal medicine, general practice, and geriatric medicine Medicare Part D patients PIP—Beers 4.9% PIP varied widely across PCPs with the bottom quartile at 1.2% and the top quartile at 10.1% Kheir43 (2014) Qatar PC 52 patients, 175 DRPs were identified with an average of 3.4 DRPs per patient No DRP—own definition 3.4 DRPs per patient The most commonly reported DRPs were nonadherence to drug therapy (31%), need for education and counseling (23%),and ADRs (21%) Khoja44 (2011) Saudi Arabia PC 463 prescriptions from public clinics and 2836 from private clinics No “Prescription errors”—own definition 18.7% Type B errors were detected in 8.0% versus 6.0% of drugs prescribed by public and private clinics, respectively, and type C errors were found in 2.2% versus 1.1% drugs prescribed by public and private clinics, respectively Komagamine45 (2018) Japan hospital PC 671 patients 65+ PIP—Beers 54.8% in patients exempt from payment, 36.0% for others Kovacevic46 (2017) Serbian PC 388 prescriptions “Elderly” with polypharmacy DRP—own definition 98.2% with at least one DRP Kunac47 (2014) New Zealand PC 376 voluntary reports No Medication errors—own definition 14.7% of reports listed a patient harm Miller49 (2006) Australian PC 8215 patients Each GP was asked to record whether or not each of 30 patients had experienced an ADE in the preceding 6 months No ADE—own definition; frequency of hospitalization 852 patients (10.4%) had experienced ADE A GP severity rating for the most recent ADE was provided for 551 patients. Over half (53.9%) were rated as having a “mild” event(s), with a third rated as “moderate.” A “severe” rating was given for 55 patients (10.0% of those with an ADE or 6.7 per 1000 patients sampled). Responses to the question on hospitalization were received for 223 patients in survey 2. Of these, 7.6% (95% CI, 3.6 to 11.6) had been hospitalized as a result of the most recent ADE (9.7 per 1000 patients in the total sample). Preventability was judged for 327 patients in survey 3. GPs classified the ADE as preventable for 23.2% (95% CI, 17.4 to 29.1), made up of 19.9% of “mild” events, 25% of “moderate” and 32% of “severe” events Oliveira50 (2015) Brazilian family health units 142 patients Ages 60+ PIP—Beers, STOPP 33.8%-51.8% Perez51 (2018) Ireland PC 38,229 patients Ages 65+ PIP—STOPP 45.3%-51.0% Ryan52 (2009) Ireland PC 500 patients Ages 65+ and at least 1 medication PIP—Beers and IPET 13% Ryan53 (2009) Ireland PC 1329 patients Ages 65+ and at least 1 medication PIP—Beers, STOPP
PPO—START18.3%-21.4%
22.7%177 (61.8%) of the potential PIPs identified were of “high severity” Stocks54 (2015) UK PC 949,552 patients No PIP—own definition 5.26% Trinkley55 (2017) Ohio University PC 1160 patients A pharmacist performed a comprehensive EHR review and conducted a telephone interview with each of the respective participants at 7-21 days (first screen) and 30- 60 days (second screen) following a medication change No ADE—own definition Of the 701 participants and 1368 unique medication changes, 226 (32%) suspected ADEs were identified; 30% of the suspected ADEs were deemed to be “definite” or “probable” following causality assessment, 21% of the 68 ADEs were preventable, and 40% were ameliorable All ADEs were considered significant; however, only 2 were serious or life-threatening Wallace56 (2017) Ireland PC 605 patients for ADE interview; 662 patients for EQ-5 Days-3L questionnaire; 806 patients for chart review Ages 70+ PIP—Beers, STOPP
ADE—own definition
HRQoL—Euro Quol-5 Dimensions (EQ-5 Days)-3L40% STOPP
26% Beers
74% ≥ 1 ADEIn multivariable analysis ≥2 Beers 2012 PIP was not associated with ADEs (adjusted incidence rate ratio 1.00 [95% CI 0.78, 1.29]), poorer HRQoL (adjusted coefficient −0.05 [95% CI −0.11, 0.003]), A&E visits (adjusted OR 1.54 [95% CI 0.88, 2.71]), or emergency admission (adjusted OR 0.72 [95% CI 0.41, 1.28]). At baseline, the prevalence of ≥ 1 PIP was 40% (n = 243), with 362 (60%) participants prescribed no PIP, 142 (24%) 1 PIP, and 101 (16%) ≥ 2 PIPs Wauters57 (2016) Belgium PC 503 patients in the Belfrail-Med cohort Ages 80+ PIP—STOPP
PPO—STARTPIP 56%
PPO 67%Increase risk of hospitalization (HR 1.26) and mortality (HR 1.39) for underuse but not overuse Wucherer58 (2017) Germany PC 446 patients Ages 70+ with positive screening for dementia DRP—PIE-Doc®-System 92.8% Problems related to administration and compliance were the most common group of DRPs (59.9% of registered DRPs; n = 645), followed by problems with drug interactions (16.7%; n = 180), problems with inappropriate drug choice (14.7%; n = 158), problems with the dosage (6.2%; n = 67), and problems with ADEs (2.5%; n = 27) Abbreviations: A&E, accident & emergency; ADE, adverse drug event; ADR, adverse drug reaction; Beers, Beer's criteria; DRP, drug-related problem; EHR, electronic health record; FORTA, fit for the aged; GP, general practitioner; HRQoL, health-related quality of life; IOM, Institute of Medicine; MAI, medication appropriateness index; PC, primary care; PCP, primary care physician; PIP, potentially inappropriate prescribing; PPO, potential prescribing omission; START, screening tool to alert to right treatment; STOPP, screening tool of old people's prescriptions.
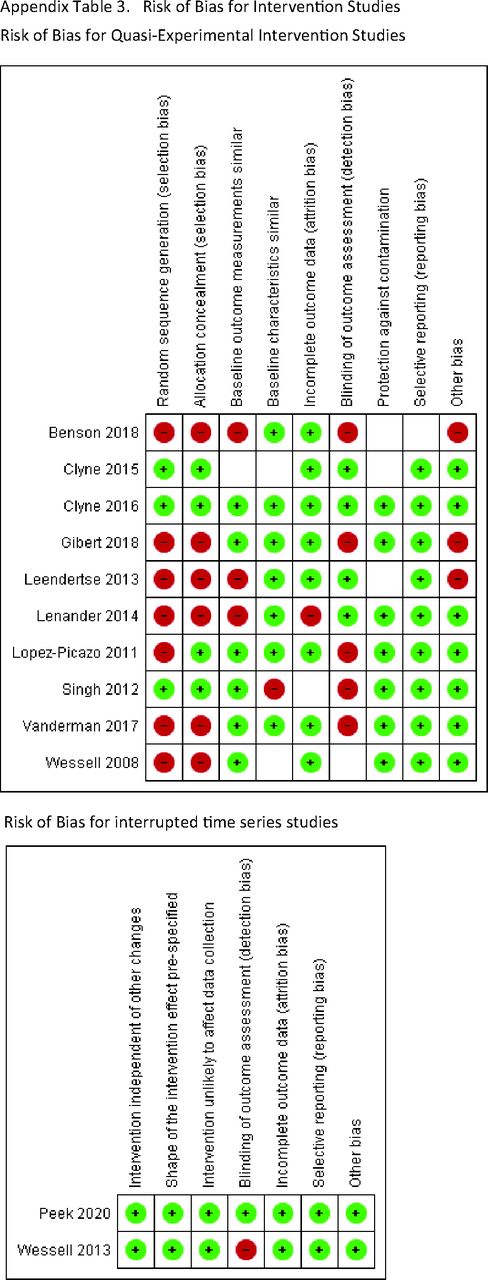
Lead Author (Year) Setting Number of Patients or Prescriptions High-Risk Subpopulation Definition of Medical Error Intervention Error Rate Other Outcomes Benson59 (2018) Australian GP patients 493 patients Polypharmacy (5+ medications), diabetes, adherence concerns, asthma/chronic obstructive pulmonary disease, inadequate response to therapy, suspected adverse reaction, patient request, pain management, recent hospital discharge, and medication with a narrow therapeutic index DRP—own definition Feedback by pharmacist to GP 1124 DRPs in 493 consultations, 685/984 (70%) recs accepted. 94% of patients had at least 1 DRP Pharmacists made a total of 984 recommendations in relation to the 1140 DRPs identified, of which 685 (70%) were recorded as actioned by the GP
Harms not measuredClyne60 (2015) Ireland PC 196 patients Ages 70+ PIP—own definition Intervention GP participants received a complex, multifaceted intervention
Control practices received simple, patient-level PIP feedbackBaseline PIP: 1.31 drugs/patient intervention group, 1.39 in control group
Completion PIP: 100% to 52% in the intervention group,100% to 77% in the control group (P = .02)
0.7 PIP per patient intervention, 1.18 control (P = .02)Harms not measured Clyne61 (2016) Ireland PC 196 patients—follow-up of primary study Ages 70+ PIP—own definition Pharmacist feedback as above. 51% patients with PIP in the intervention group, 76% in the control group (P = .01). The mean number of PIP drugs in the intervention group was 0.61, 1.03 in the control group (P = .01) Harms not measured Gibert62 (2018) France PC 172 patients Ages 75+ who were taking at least 5 drugs PIP—STOPP GPs taught to use STOPP criteria on their own patients GP's intervention decreased the number of PIMs according to STOPP criteria to 106 and was beneficial for 44.9% of the patients (n = 44). The mean MAI score of all medications and PIMs decreased by 14.3% (P < .001) and 39.1% (P < .001) respectively Harms not measured Howard63 (2014) UK PC 72 general practices 2038 patient records reviewed Taking one of 8 classes of potentially hazardous medications Potentially hazardous prescribing—own definition Intervention practices received simple feedback plus a pharmacist-led information technology complex intervention (PINCER) lasting 12 weeks Pharmacists recommended 2105 interventions in 74% (95% CI 73, 76; 1516/2038) of cases and 1685 actions were taken in 61% (95% CI 59, 63; 1246/2038) of cases;control group not reported Harms not measured Leendertse64 (2013) Netherlands PC 364 intervention and 310 control patients Patients with a high risk on medication-related hospitalizations based on old age, use of 5 or more medicines, nonadherence and type of medication used Medication-related hospital admissions, ADE, survival, quality of life (EQ5D/Visual Analog scale). The intervention consisted of a patient interview and evaluation of a pharmaceutical care plan. The patient's own pharmacist and GP carried out the intervention.
The control group received usual care and was cared for by a GP other than the intervention GP6 (1.6%) admissions in intervention group, 10 in control group (3.2%), p = NS The secondary outcomes were not statistically significantly different either Lenander65 (2014) Sweden PC 209 patients Ages 65+ and 5+ medications DRP—own definition The pharmacist reviewed all medications (prescription, nonprescription, and herbal) regarding recommendations and renal impairment, giving advice to patients and GPs. Each patient met the pharmacist before seeing their GP.Control patients received their usual care No significant difference was seen when comparing change in DRPs between the groups Groups not balanced at beginning of trial.
Harms not measuredLopez-Picazo66 (2011) Spain PC 81,805 patients of 265 family physicians No Potentially serious drug interactions—own definition Specially designed software analyzed EHR data and generated reports. Physicians and their patients randomized into 4 groups: control, report, sessions, and face-to-face personal interviews Overall, a baseline mean of 6.7 interactions per 100 patients, which was reduced to 5.3 interactions after follow-up
No difference between the control and report groupsHarms not measured Peek67 (2020) UK PC 47,413 patients in 43 general practices Have 1 or more risk factors for any of the 12 medication safety indicators at the start of the intervention 12 medication safety indicators (10 relating to potentially hazardous prescribing and 2 to inadequate blood-test monitoring) developed for PINCER SMASH comprised (1) training of clinical pharmacists to deliver the intervention; (2) a web-based dashboard providing actionable, patient-level feedb ack; and (3) pharmacists reviewing individual at-risk patients and initiating remedial actions or advising general practitionerson doing so At baseline, 95% of practices had rates of potentially hazardousprescribing (composite of 10 indicators) between 0.88% and 6.19%. The prevalence of potentially hazardous prescribing reduced by 27.9% (95% CI 20.3% to 36.8%, P < .001) at 24 weeks and by 40.7% (95% CI 29.1% to 54.2%, P < .001) at 12 months Harms not measured Singh68 (2012) New York PC 1125 patients preintervention; 1050 patients postintervention Ages 65+ ADE—own definition This was a cluster randomized trial in which 12 practices were each randomized to one of 3 states (4 practices each): (1) team resource management intervention;
(2) team resource management intervention with PEA; (3) no intervention (comparison group).In the “Intervention with PEA” group there was a statistically significant decrease in the overall rate of preventable ADEs after the intervention compared to before (7.4 per 100 patient-years vs 12.6, P = .018) and in the rate of moderate or severe (combined) preventable ADEs (1.6 vs 6.4, P = .035). Examples of preventable errors include missed allergy, wrong dosage, errors of dispensing, administration errors, and failure to order or complete laboratory monitoring.Harms not measured.Groups were not balanced at baseline Vanderman69 (2017) Veterans Affairs PC in North Carolina 1539 patients preinterv ention; 1490 patients postintervention Ages 65+ PIP—Beers Computerized physician order entry in Epic EHR PIP rate 12.6% preintervention, 12.0% post (p = NS) Top 10 PIPs 9.0% to 8.3%, (P = .016)
Harms not measuredWessell70 (2008) South Carolina PC 124,802 patients Ages 65+ PIP—Beers Quarterly performance reports, on-site visits, and annual meetings for 4 years Always inappropriate 0.41% to 0.33%, rarely appropriate medication decreased from 1.48% to 1.30% Harms not measured Wessell71 (2013) 20 PC sites in 14 US states 49,047 patients High-risk medication use based on 44 indicators PIP—own definition Local performance review, quarterly reports, and academic detailing Improved 3/5 measures by 2.9% to 4.0%; 2/5 measures unchanged over 2 years Harms not measured Abbreviations: ADE, adverse drug event; Beers, Beer's criteria; DRP, drug-related problem; EHR, electronic health record; GP, general practitioner; MAI, medication appropriateness index; PC, primary care; PEA, practice enhancement associate; PIM, potentially inappropriate medication; PIP, potentially inappropriate prescribing; STOPP, screening tool of old people's prescriptions.


