
Abstract
Background: The aim of this systematic review is to summarize the best available evidence regarding individual risk factors, simple risk scores, and multivariate models that use patient characteristics, vital signs, comorbidities, and laboratory tests relevant to outpatient and primary care settings.
Methods: Medline, WHO COVID-19, and MedRxIV databases were searched; studies meeting inclusion criteria were reviewed in parallel, and variables describing study characteristics, study quality, and risk factor data were abstracted. Study quality was assessed using the Quality in Prognostic Studies tool. Random effects meta-analysis of relative risks (categorical variables) and unstandardized mean differences (continuous variables) was performed; multivariate models and clinical prediction rules were summarized qualitatively.
Results: A total of 551 studies were identified and 22 studies were included. The median or mean age ranged from 38 to 68 years. All studies included only inpatients, and mortality rates ranged from 3.2% to 50.5%. Individual risk factors most strongly associated with mortality included increased age, c-reactive protein (CRP), d-dimer, heart rate, respiratory rate, lactate dehydrogenase, and procalcitonin as well as decreased oxygen saturation, the presence of dyspnea, and comorbid coronary heart and chronic kidney disease. Independent predictors of adverse outcomes reported most frequently by multivariate models include increasing age, increased CRP, decreased lymphocyte count, increased lactate dehydrogenase, elevated temperature, and the presence of any comorbidity. Simple risk scores and multivariate models have been proposed but are often complex, and most have not been validated.
Conclusions: Our systematic review identifies several risk factors for adverse outcomes in COVID-19–infected inpatients that are often available in the outpatient and primary care settings: increasing age, increased CRP or procalcitonin, decreased lymphocyte count, decreased oxygen saturation, dyspnea on presentation, and the presence of comorbidities. Future research to develop clinical prediction models and rules should include these predictors as part of their core data set to develop and validate pragmatic outpatient risk scores.
- C-Reactive Protein
- Clinical Prediction Rule
- Comorbidity
- COVID-19
- Prognosis
- Risk Factors
- Systematic Review
- Meta-Analysis
Introduction
In December 2019, the first cases of novel coronavirus disease, later to become known as COVID-19, were reported.1 Since this outbreak, the world has found itself facing a pandemic with total global cases exceeding 11 million as of October 21, 2020,2 including more than 8 million confirmed cases in the United States.3 Symptoms of COVID-19 include cough, fever, dyspnea, chills, myalgias, and loss of taste and smell. However, many individuals remain asymptomatic or have mild symptoms and do not seek testing, so the number of total cases is estimated to be approximately 10 times higher than the number of confirmed cases.4,5 Currently the treatment is primarily supportive for patients with nonsevere illness,6 with respiratory support, remdesivir, and dexamethasone for more severely ill patients.7,8
COVID-19 has an infection mortality ratio estimated to be approximately 0.5–1.0%,9 and an accurate prognosis is important to help clinicians decide on the most appropriate site of care (hospital vs home) and the intensity of follow-up and monitoring for both inpatients and outpatients. However, our understanding of clinical risk factors and biomarkers that increase the likelihood of serious illness or death remains incomplete and in some cases is contradictory. Previous studies have found that risk factors for severe illness or mortality include increasing age, male sex, and comorbidities such as diabetes, renal failure, asthma, chronic obstructive pulmonary disease, hypertension and cardiovascular disease.10 A variety of biomarkers have also been reported to be associated with severe disease or mortality including c-reactive protein (CRP), lactate dehydrogenase (LDH), imaging findings, and the white blood cell count parameters.11
However, some of these biomarkers or imaging studies are not rapidly or widely available in outpatient settings, and physicians are increasingly having to make decisions via telehealth or in outpatient clinics. Whereas the availability of tests varies in different countries and in different outpatient settings (urgent care vs primary care vs telehealth vs emergency department), tests like the complete blood count, c-reactive protein (CRP), d-dimer, and procalcitonin are increasingly available.12⇓⇓–15 The goal of this systematic review and meta-analysis is to summarize the best available evidence regarding individual risk factors, simple risk scores, and multivariate models that use patient characteristics, vital signs, comorbidities, and laboratory tests in inpatients, as a guide to testing their predictive utility in outpatient and primary care settings.
Methods
This systematic review was registered with the PROSPERO registry, registration number CRD42020193336. It was declared not human subjects research by the University of Georgia Institutional Review Board.
Inclusion Criteria
Risk factors were limited to demographics, vital signs, oxygen saturation, comorbidities, and laboratory tests judged to be available in at least some outpatient settings (white blood cell count and differential, c-reactive protein, d-dimer and procalcitonin). Studies were included that reported the association between at least 1 of these risk factors and at least 1 marker of serious illness in cohorts of adults with a confirmed diagnosis of COVID-19. Adverse outcomes for all patients were defined as death, intensive care unit (ICU) stay, or need for mechanical ventilation. Included studies also had to report sufficient data for calculation of relative risk, including the number of patients with and without the risk factor for both good and bad outcomes.
Studies were excluded if they enrolled cohorts of only children. They were also excluded if the study focused on a specialized population such as pregnant women, individuals with cancer, HIV-positive individuals, or postoperative patients. Studies that included less than 50 patients were also excluded from the meta-analysis. There were no limitations set on the country or language of the publications. Studies from preprint servers were also included.
Search Strategy
A search of the Medline database was used with multiple terms for COVID-19 such as “betacoronavirus,” “coronavirus,” “COVID-19”, and “SARS-CoV-2” as well as terms for prognostic studies such as “risk factor,” “validation,” “prediction rule,” and “prognosis.” All terms were linked by Boolean terms and the search is shown in Appendix A. The limits “has abstract” and “human” were applied to the search. In addition, the WHO COVID-19 Database and the MedRxIV preprint server were searched to identify additional published and preprint studies using similar keywords.
Data Abstraction
All abstracts were reviewed for inclusion by the lead author (MHE) and at least 1 other coauthor. For any abstract that was of interest, the full article was obtained and reviewed by the lead author and at least 1 other coauthor. Studies meeting inclusion criteria were reviewed in parallel and variables describing study characteristics, study quality, and risk factor data were abstracted. Risk factor data included the number of individuals with and without the risk factor and how many observed the outcome of interest. We included continuous and categorical data. All discrepancies were discussed and resolved by consensus. If a study reported a simple risk score, clinical prediction rule, or multivariate model, data regarding them was abstracted separately.
Data Preparation
Similar risk factors (eg, lymphocyte count < 0.8 and < 1.0) were grouped where it was felt to be clinically reasonable by the lead investigator, a physician. Outcomes were similarly grouped into 3 outcome categories: (1) death, (2) severe disease (intensive care unit admission, mechanical ventilation, or disease progression), and (3) severe disease or death. Where different units were reported, results were converted to a common set of units (eg, milligrams per liter for c-reactive protein). Original risk factors and outcome categories are available for the full data set and are available on request from the investigators.
In studies that did not report mean and standard deviation of continuous variables, these values were estimated using median and interquartile range. The mean was approximated by adding the lower (q1) and upper bound (q3) to the median (m) and dividing but the constant of 3. The standard deviation was estimated by subtracting q1 from q3 dividing by η(n), which was determined using the sample size and Table 2 in the publication by Wan et al.16 These values were calculated with the equation, η(n) = 2E(Z(3Q+1)) for Q ≤ 50, using the statistical software R. In cases in which the sample size was large and Q was ≥ 50, 1.35 was used as the η(n).
Characteristics of Included Studies
Association between Categorical Variables and Mortality or Severe Disease in Patients with COVID-19
Assessment of Study Quality
The Quality in Prognostic Studies (QUIPS)17 tool was adapted and used to determine the quality of included studies. Definitions of low, moderate, and high risk of bias were prespecified for each domain. The full adapted tool is included in Appendix C. Quality was assessed in parallel by at least 2 researchers and all discrepancies were discussed and resolved by consensus.
Analytic Strategy
Data were imported into STATA (version 15.1; College Station, TX) and the metan procedure was used to perform the random effects meta-analysis of relative risks (categorical variables) and unstandardized mean differences (continuous variables). Forest plots were created for each risk factor, stratified by outcome (eg, death, severe disease). The number of studies and patients for each summary estimate were also noted. To perform random effects meta-analysis of continuous variables, median and interquartile ranges were converted to estimates of mean and standard deviation before calculation using the method of Wan et al.16
Results
A summary of our search process is outlined in Figure 1. Our initial search of PubMed was performed in May 2020, and a bridge search was performed on June 30, 2020. A total of 551 records were identified, and 56 full-text articles were screened for inclusion. Ultimately, 22 studies were included in the quantitative synthesis.

PRISMA flow diagram of the search process.
The characteristics of included studies are summarized in Table 1. One study was set in the United States, 1 in Korea, and the remainder were set in China. All studies included adult inpatients with previously confirmed COVID-19 and reported outcomes of death, severe disease, or both; there were no studies of outpatient prognosis. The median or mean age ranged from 38 to 68 years with the majority of the participants being male in 16 of 22 studies. Mortality rates ranged from 3.2% to 50.5%.
Study quality was assessed for all included studies using the QUIPS tool. All 22 studies were considered to have moderate risk of bias for study participation because only inpatients were included, limiting generalizability to patients cared for outside the hospital. Eight studies included patients who were still hospitalized at the time of data collection and were therefore considered to have high risk of bias for study attrition and ascertainment of the final outcome. Three studies did not provide a multivariate analysis and were considered to have high risk of bias for study confounding. All results and analytic strategies seemed to be clearly reported and were not considered to be a source of bias. Detailed results of the quality assessment including the adapted QUIPS tool are shown in Appendix C.
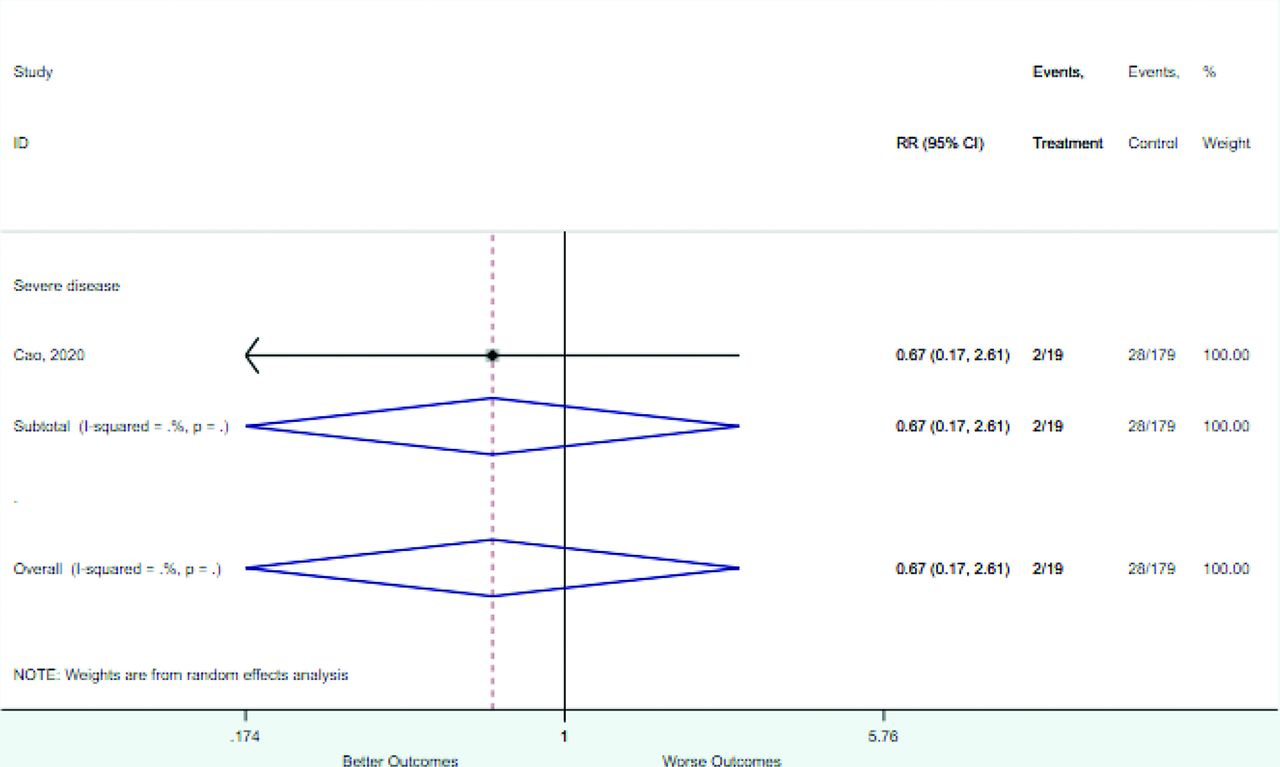
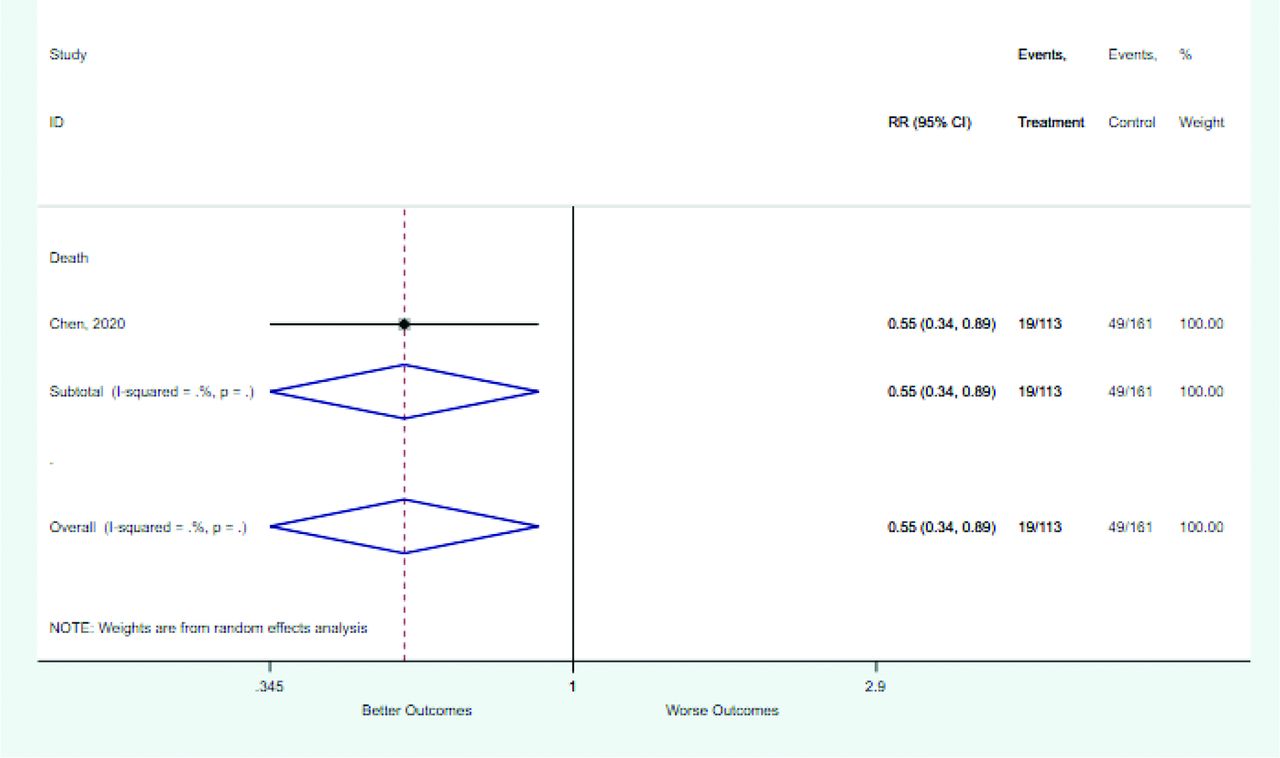
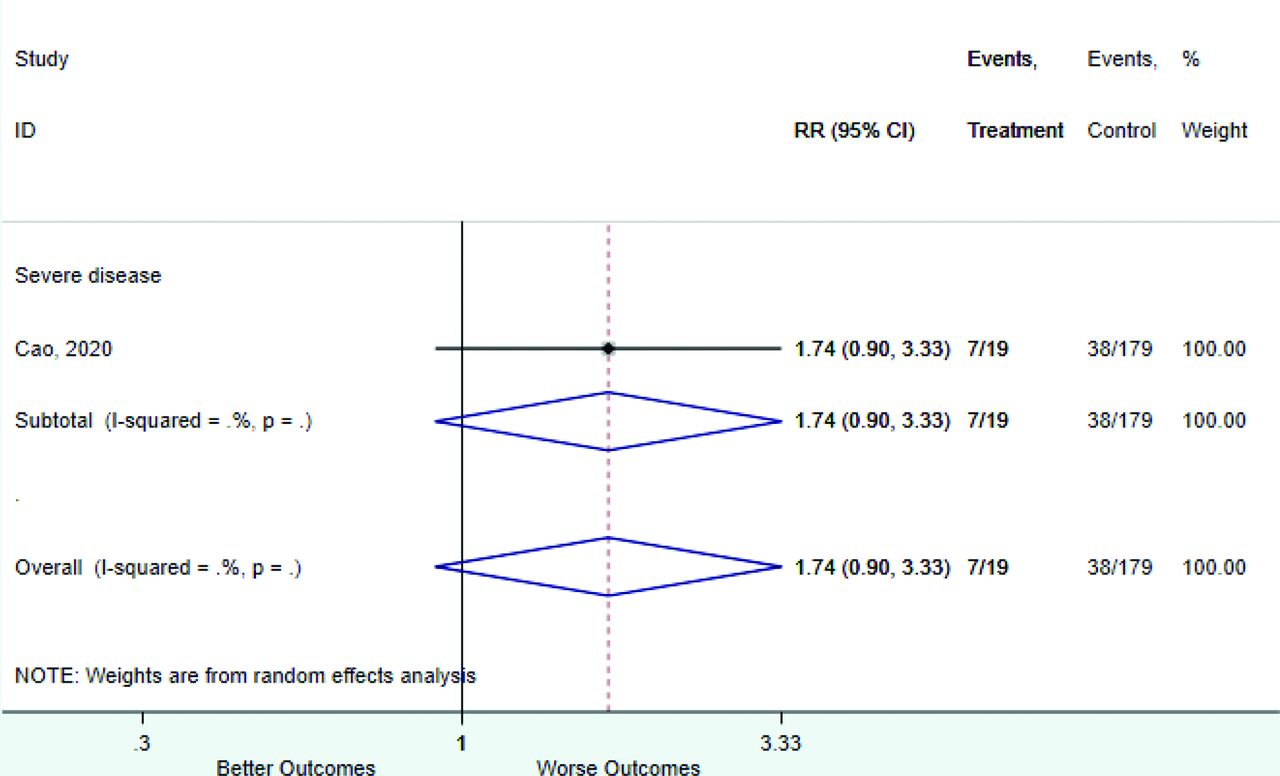
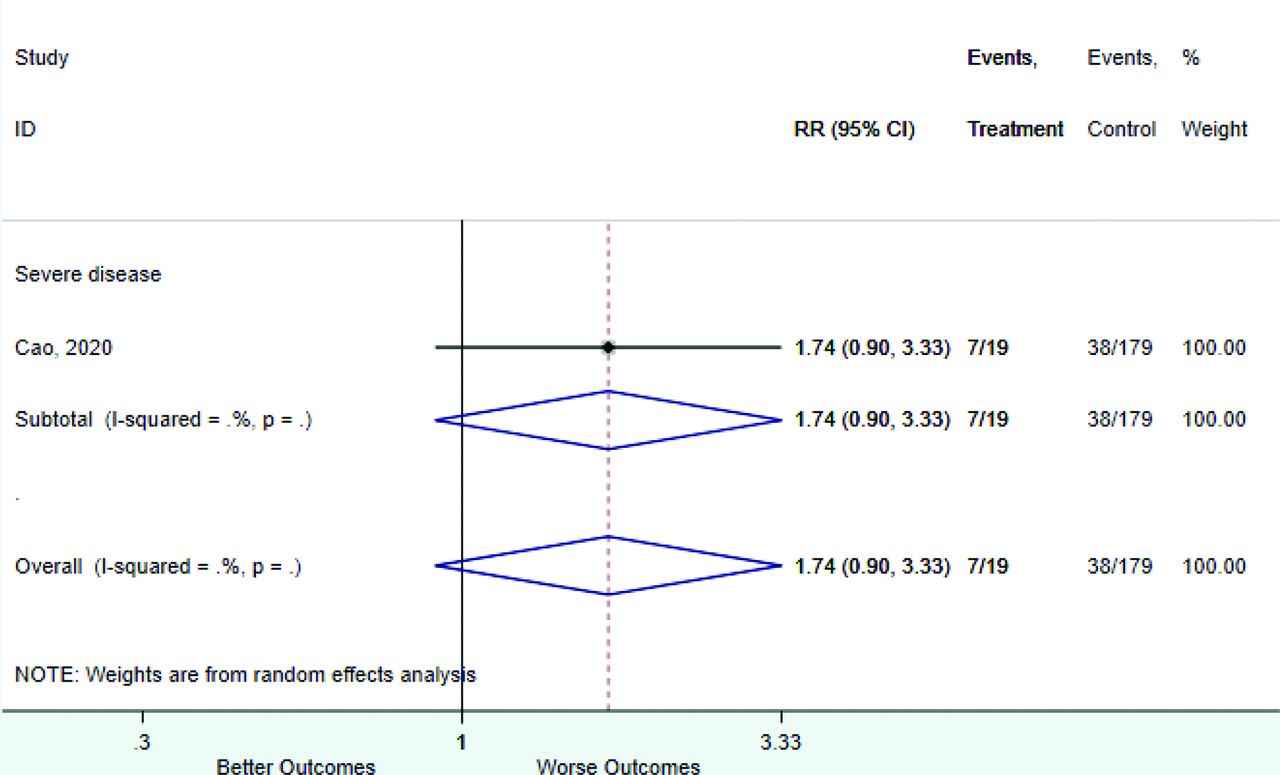
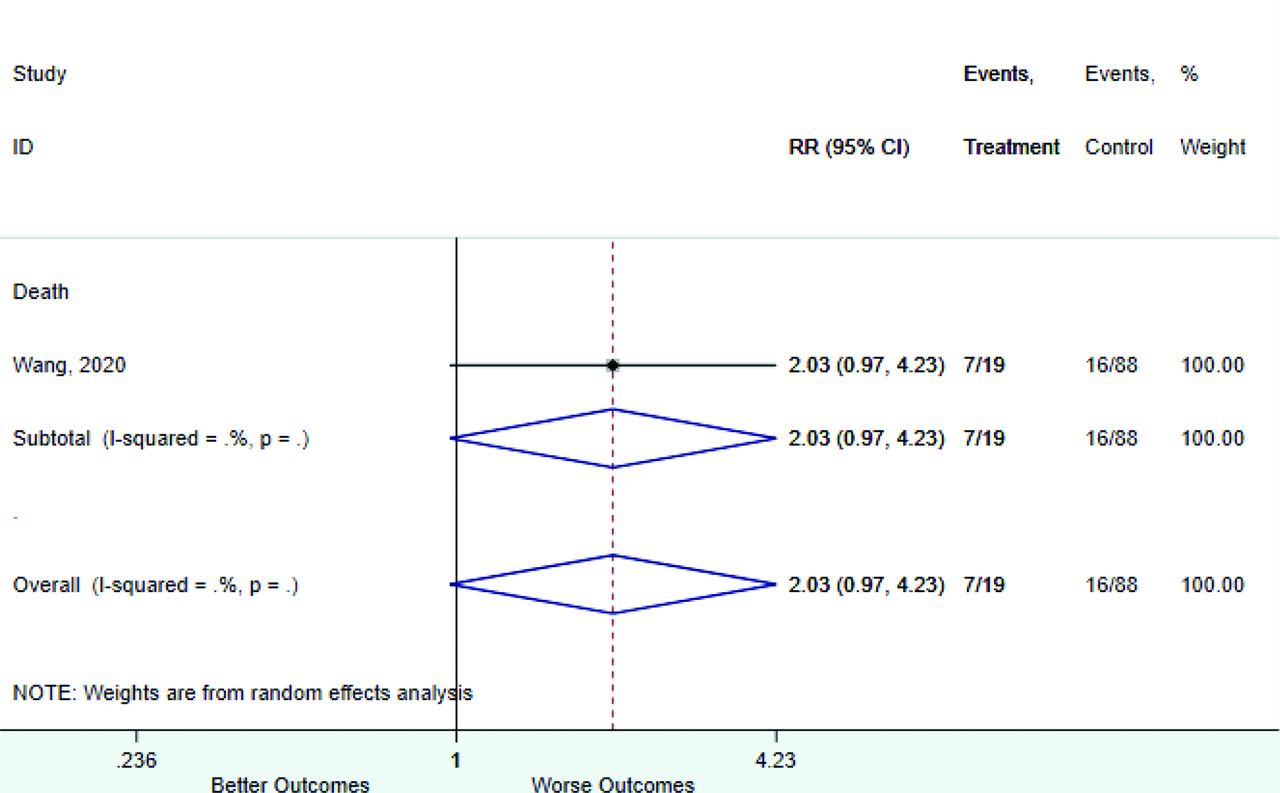
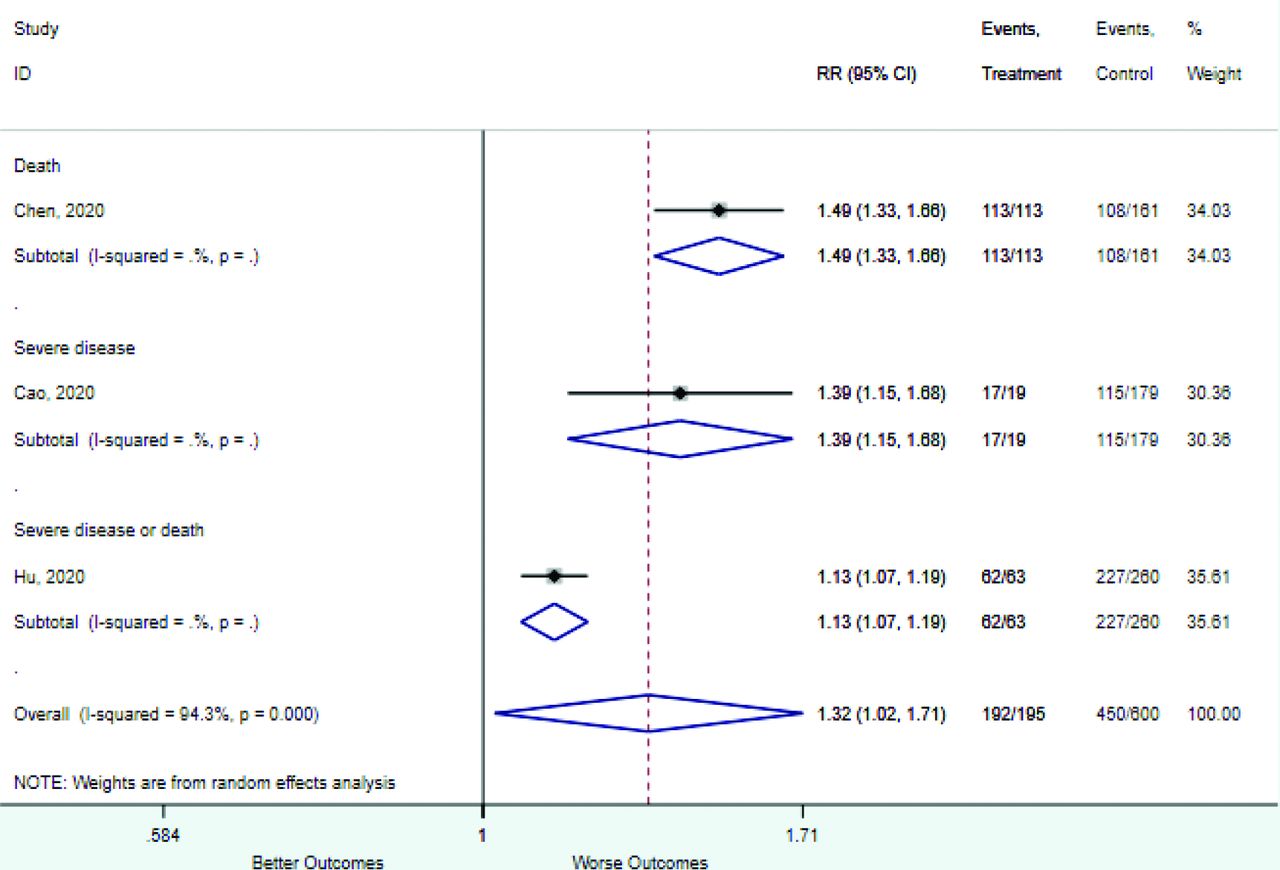
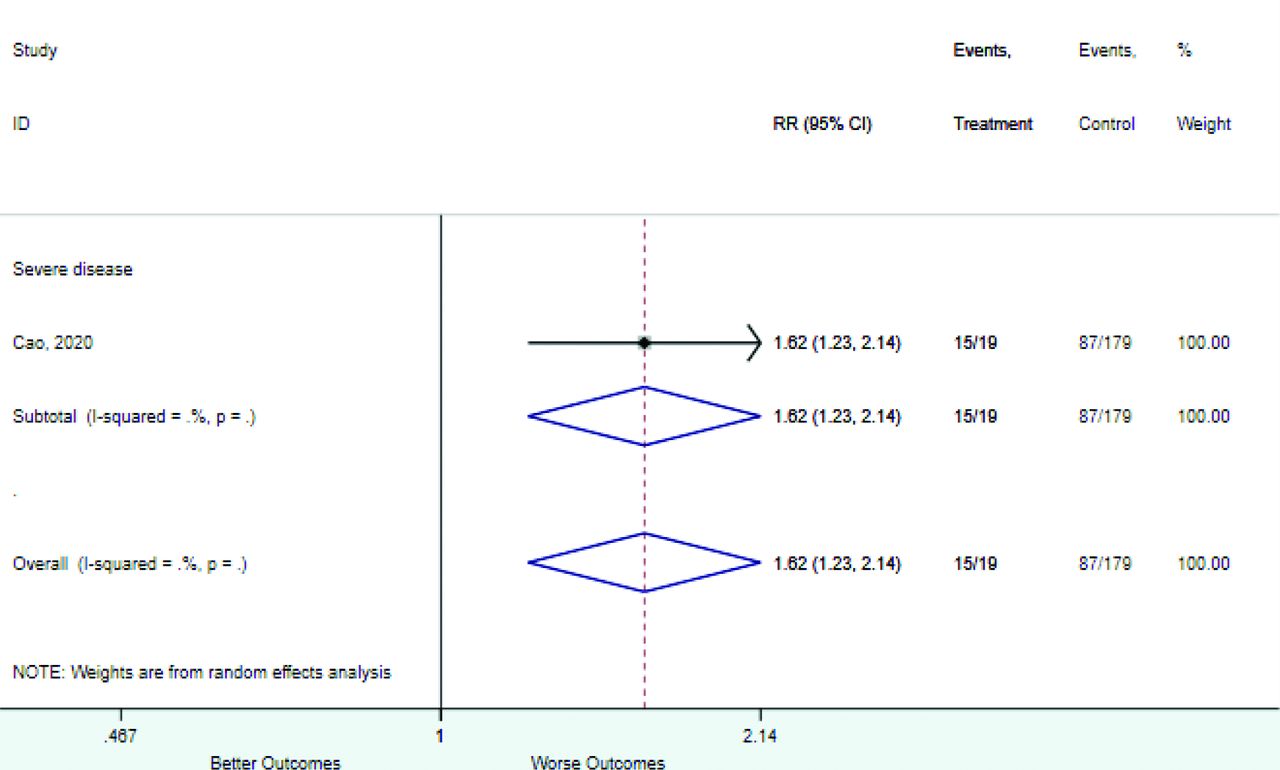
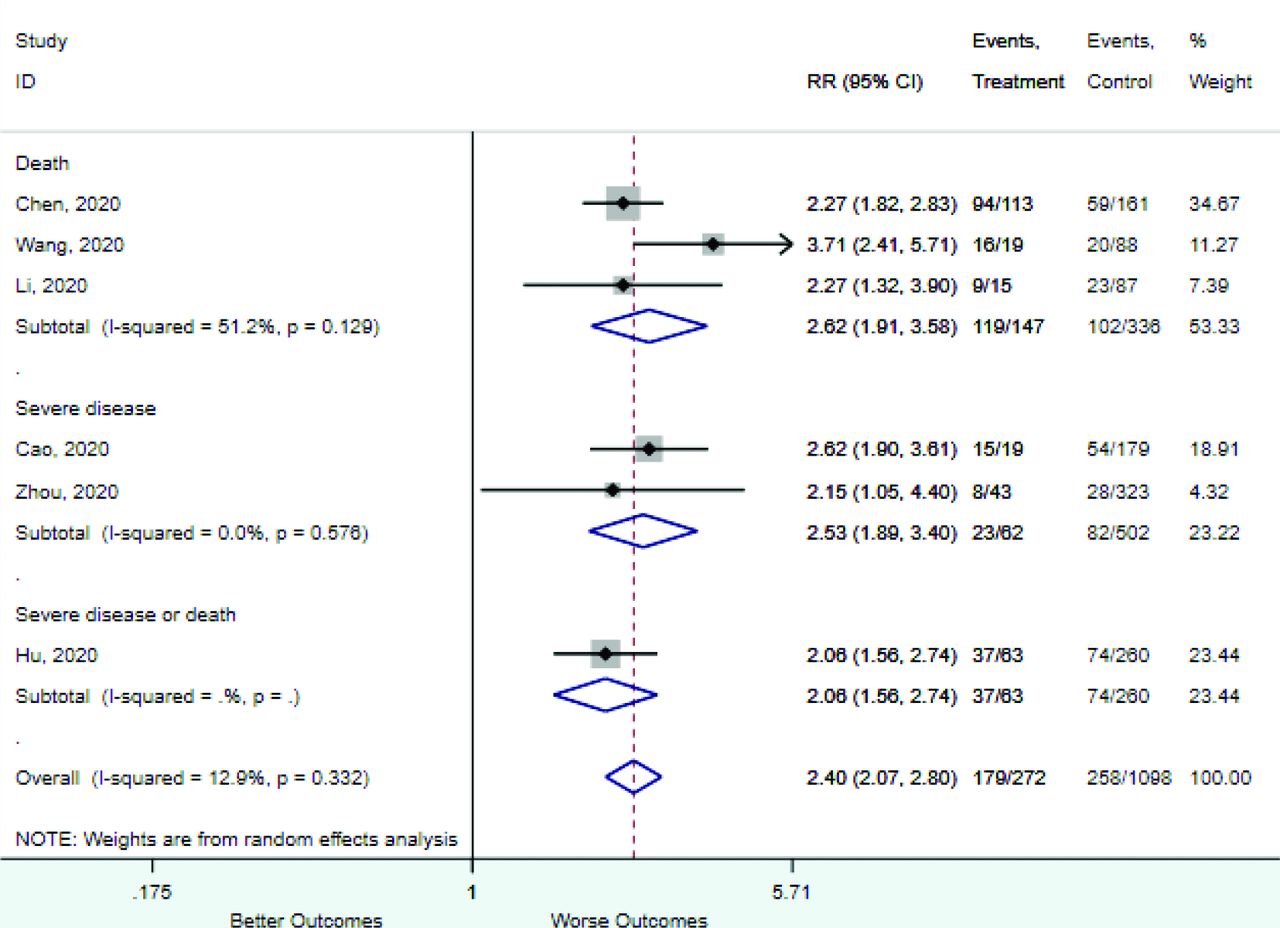
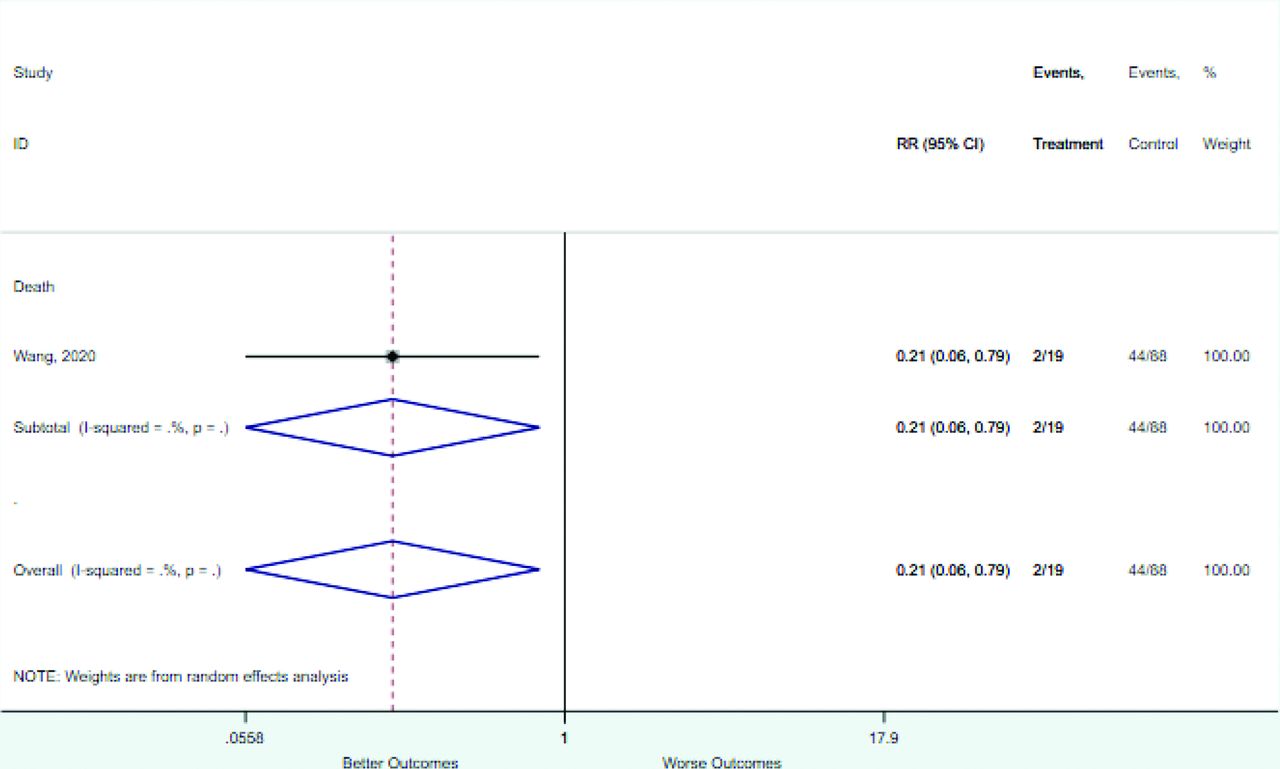
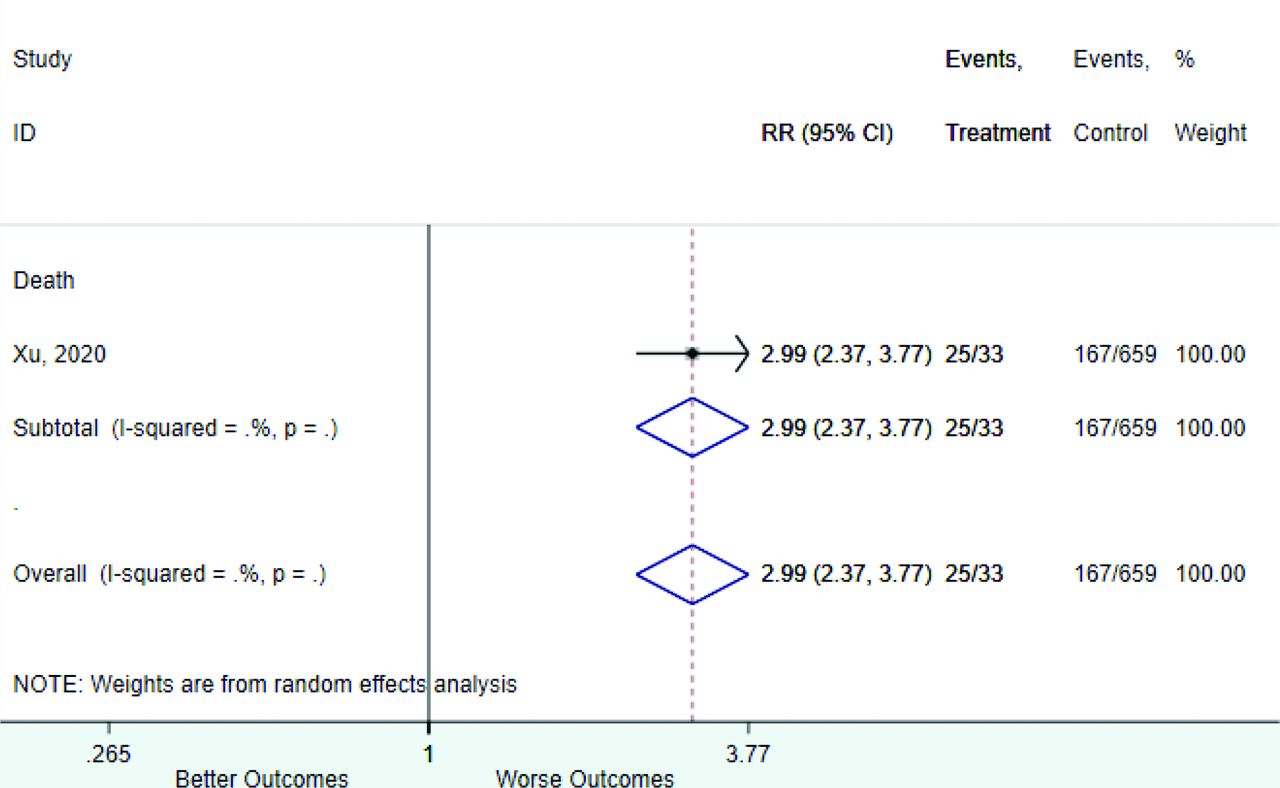
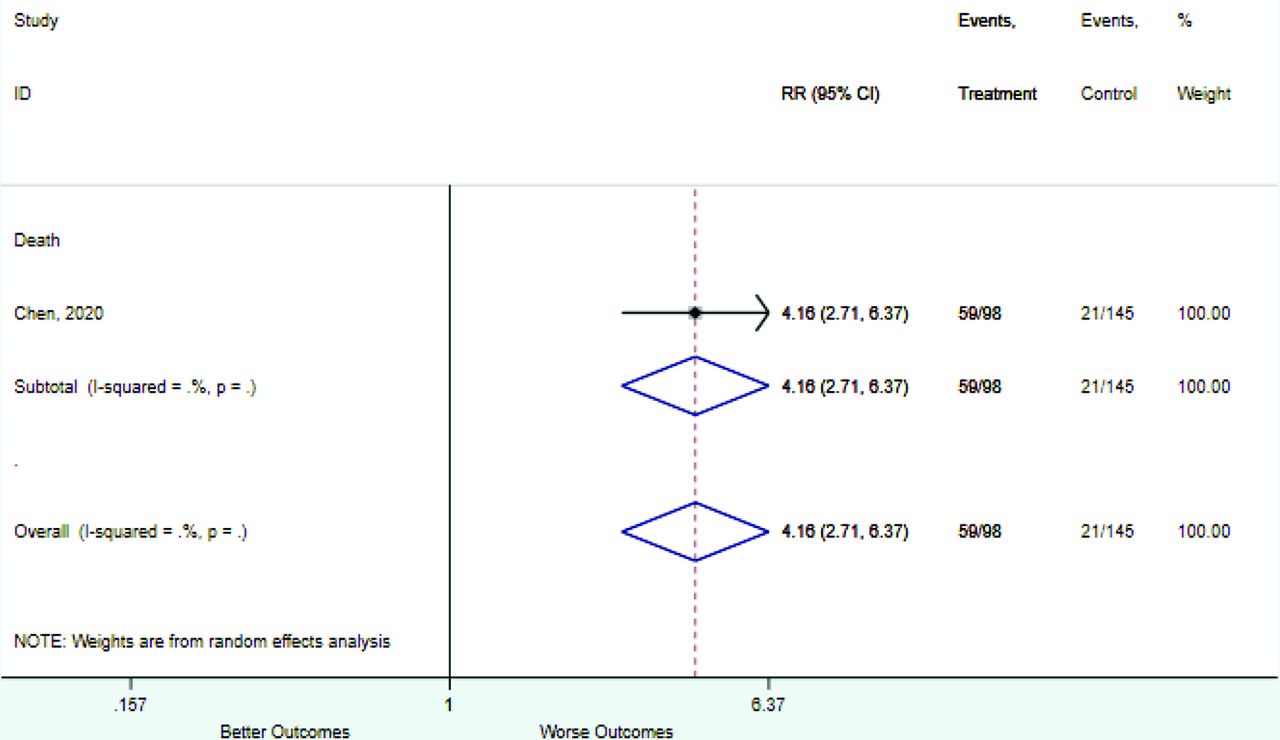
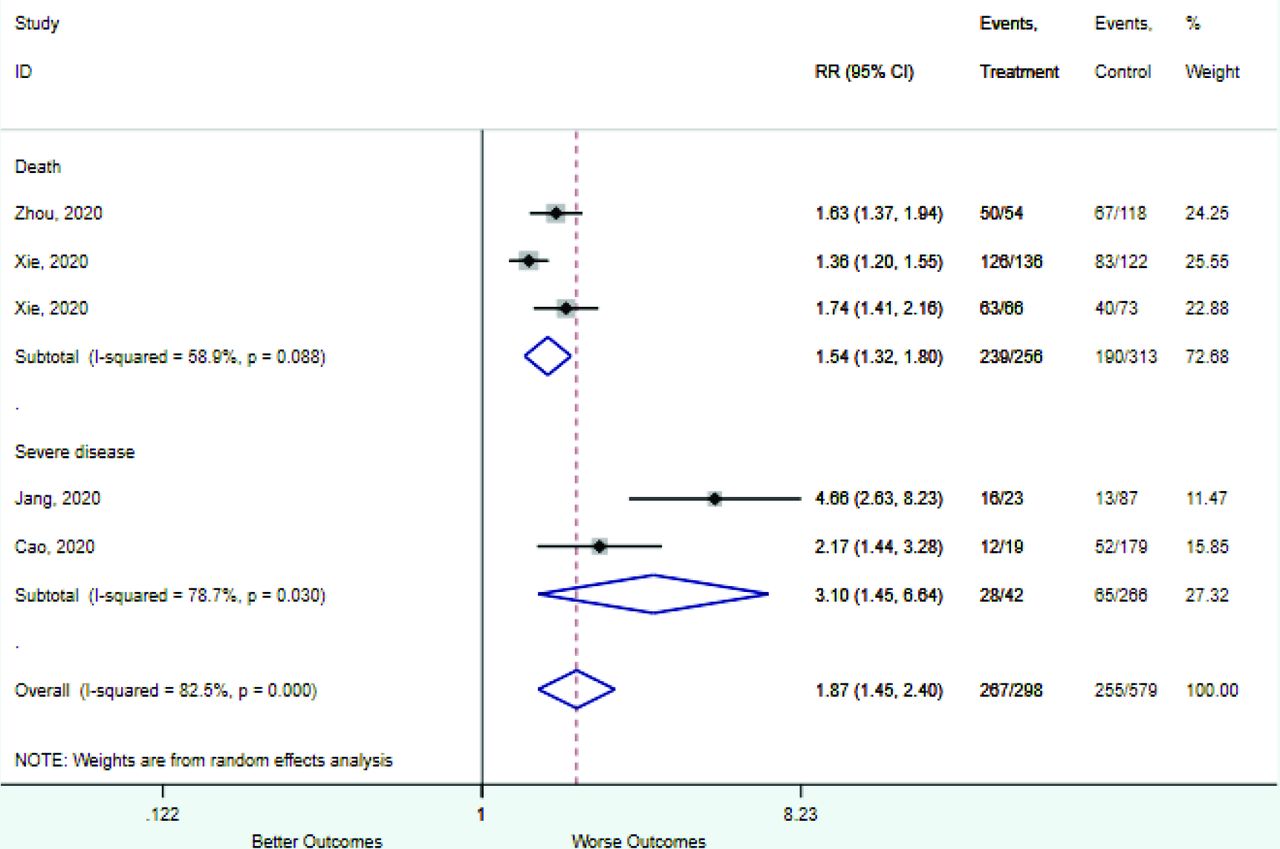
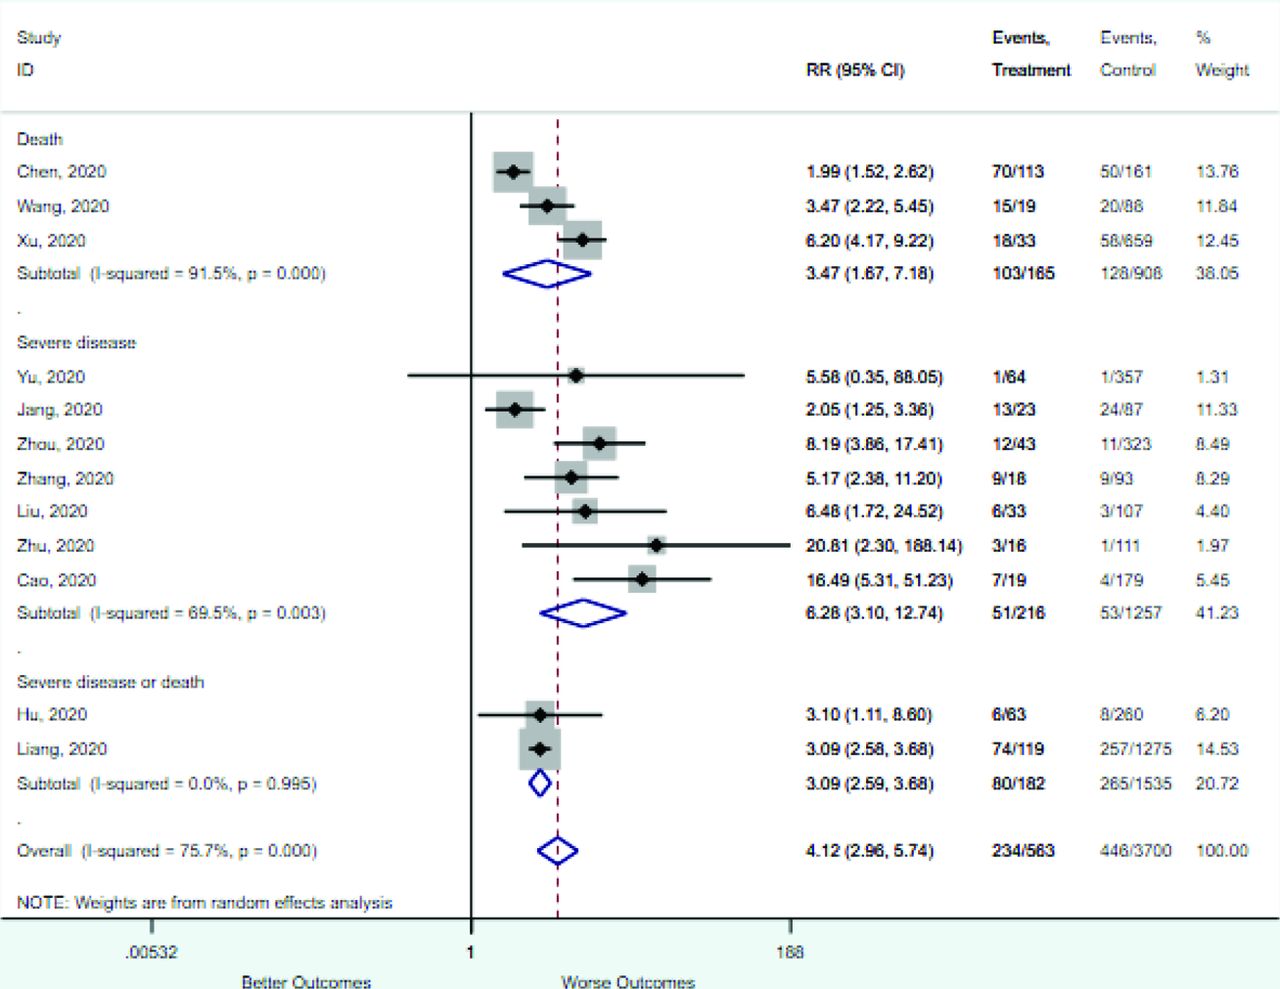
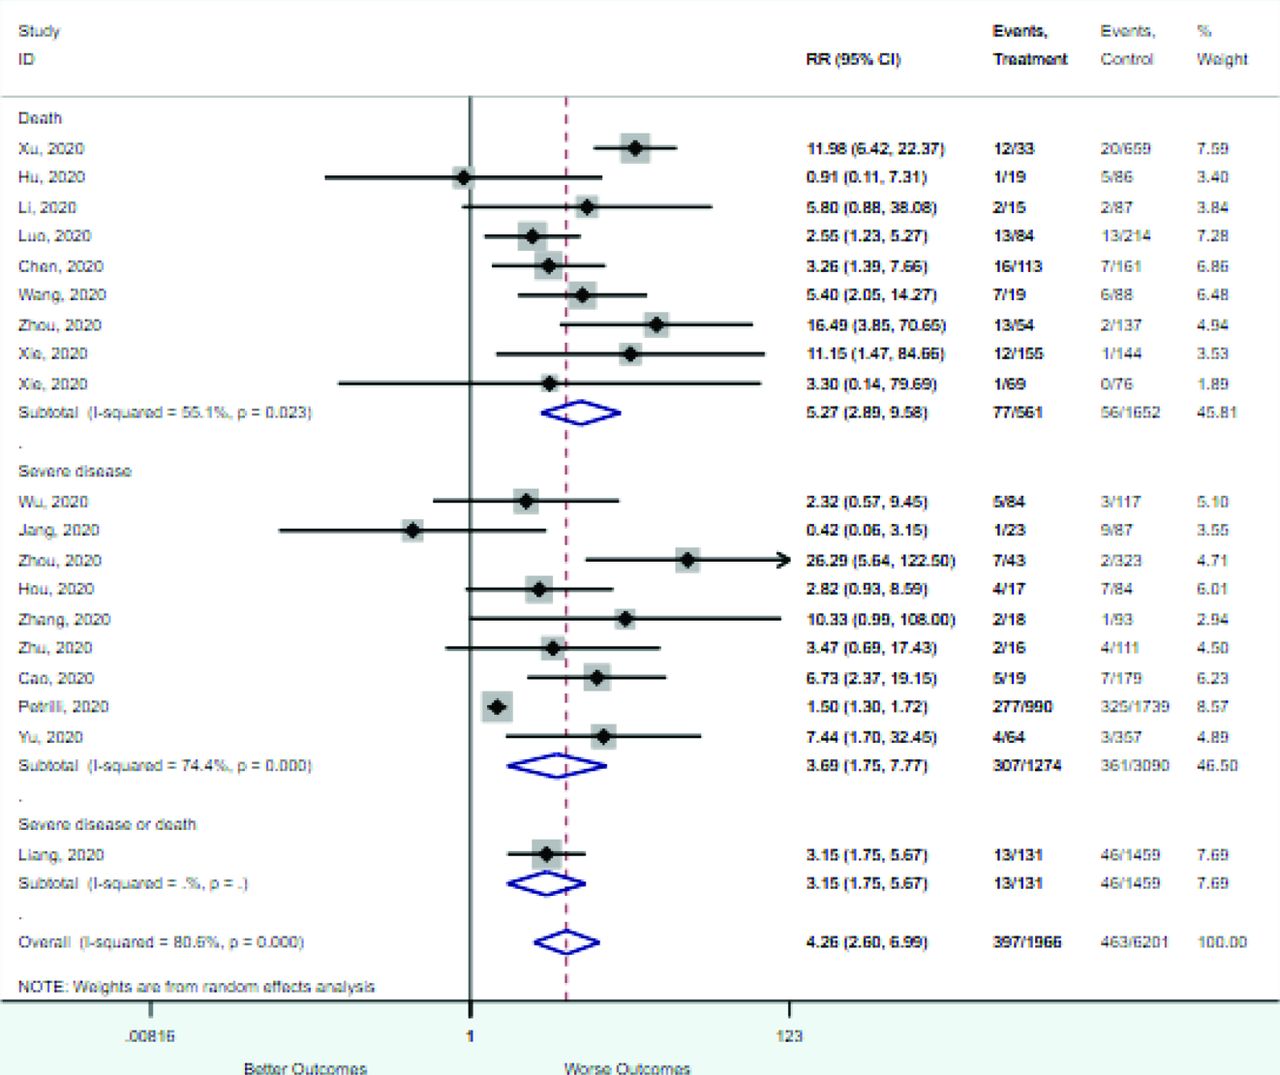
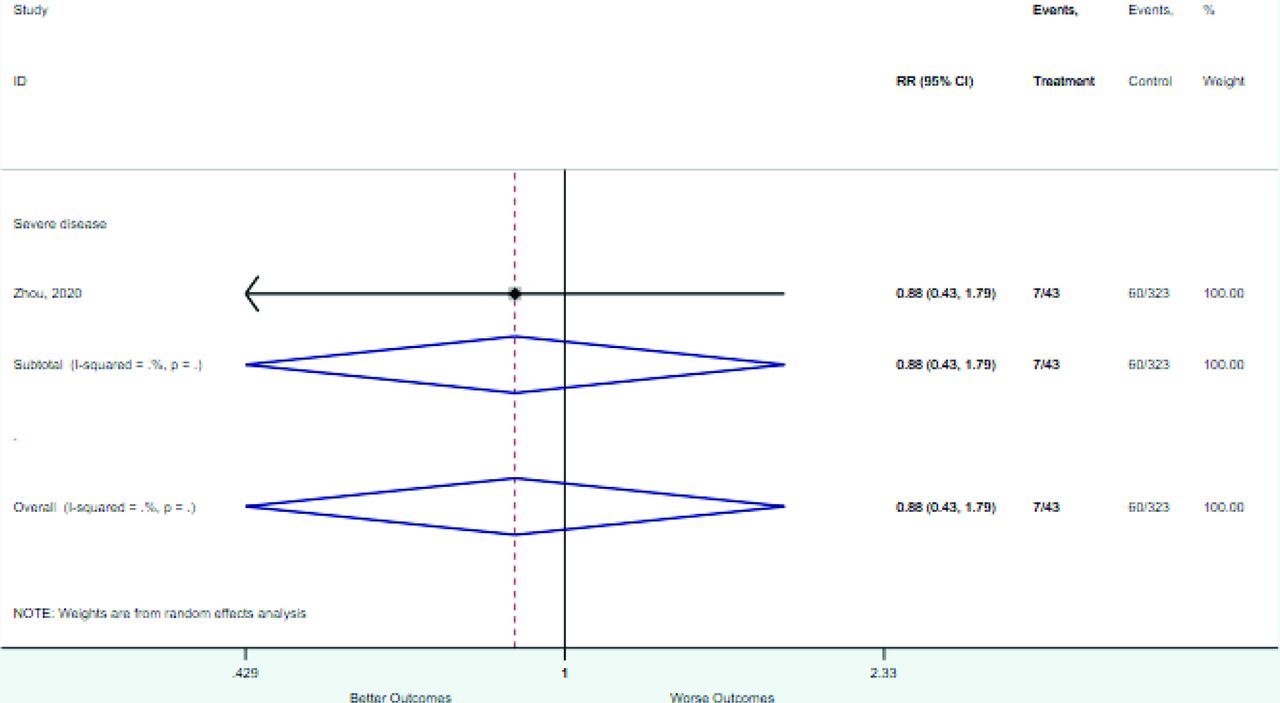
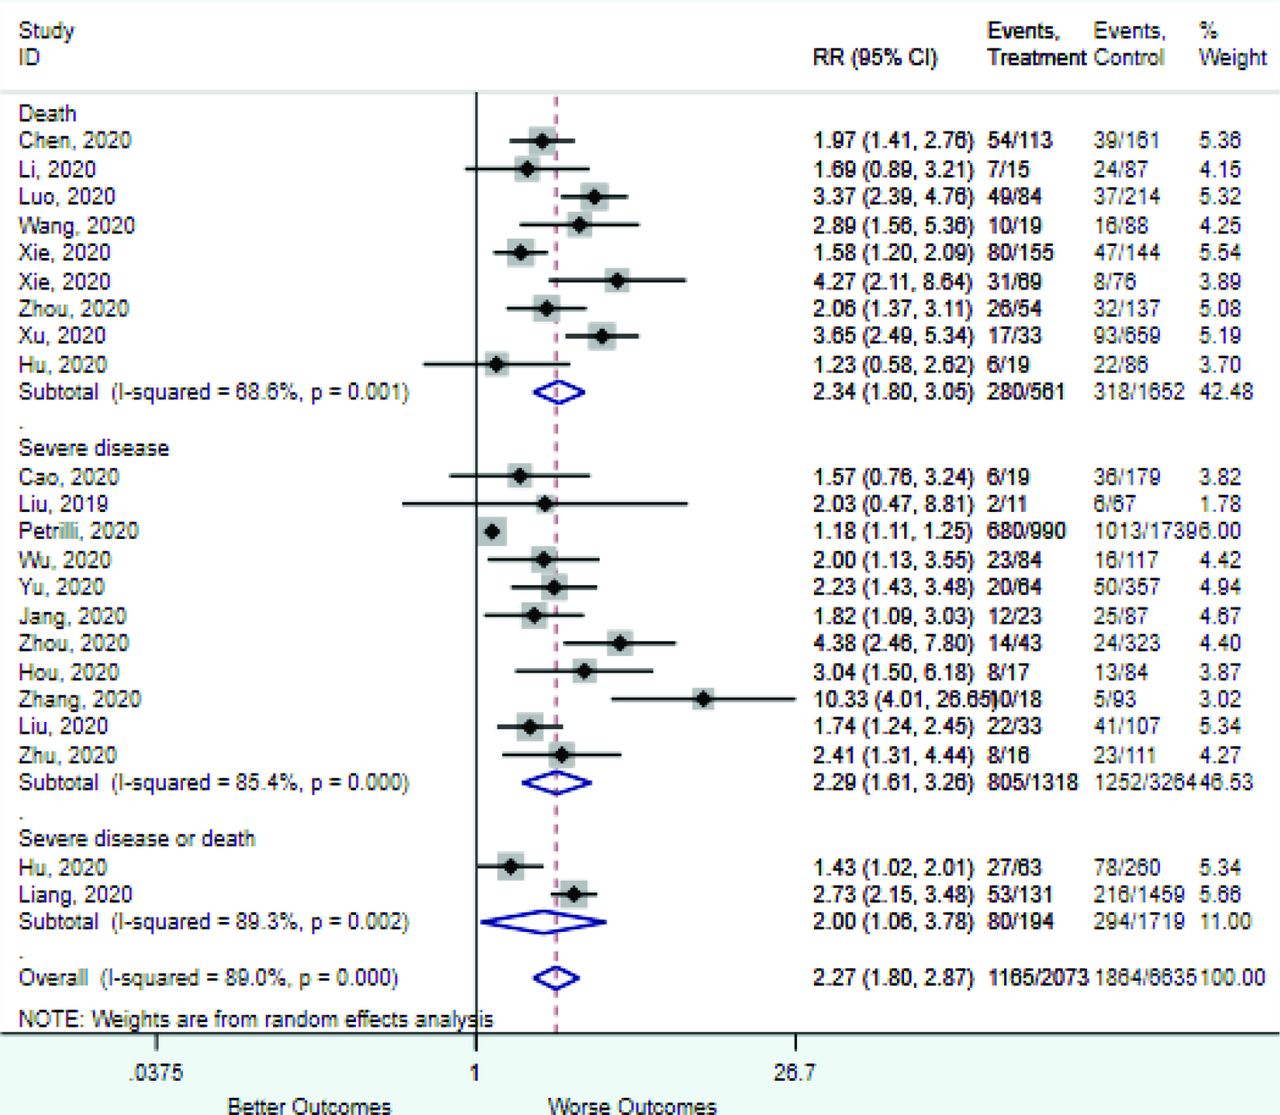
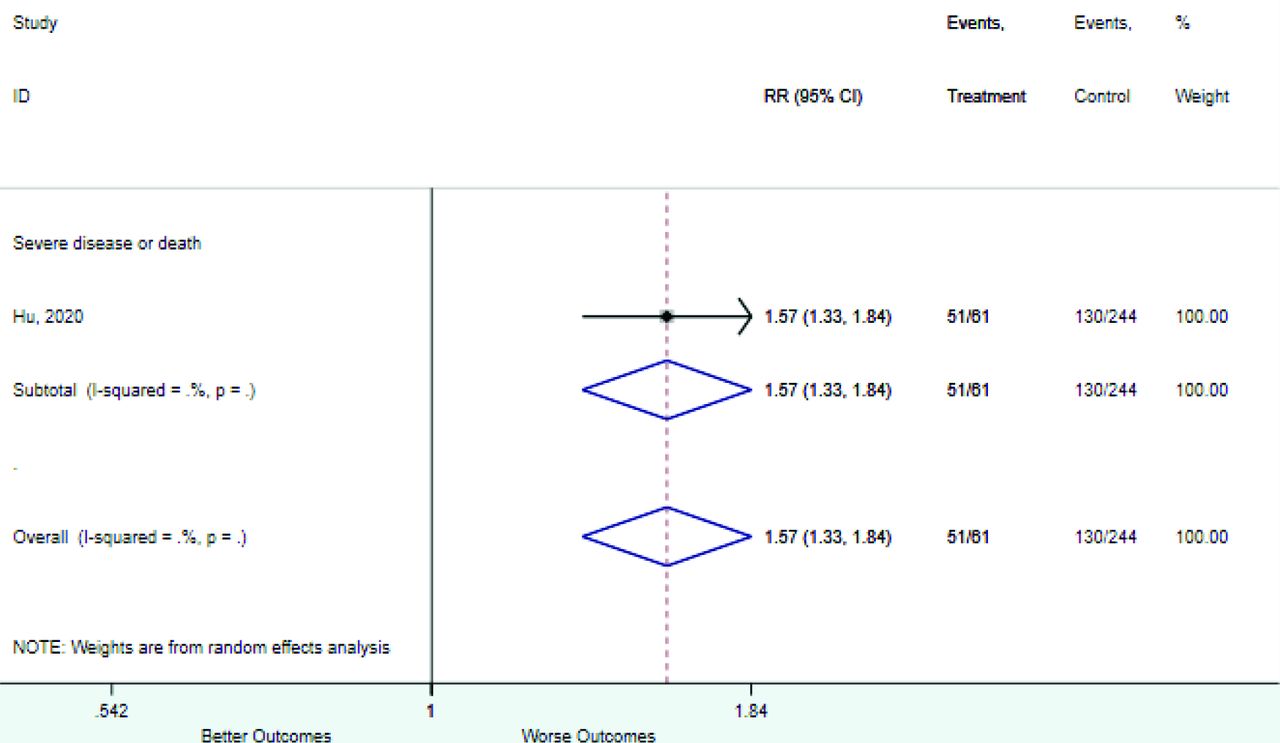
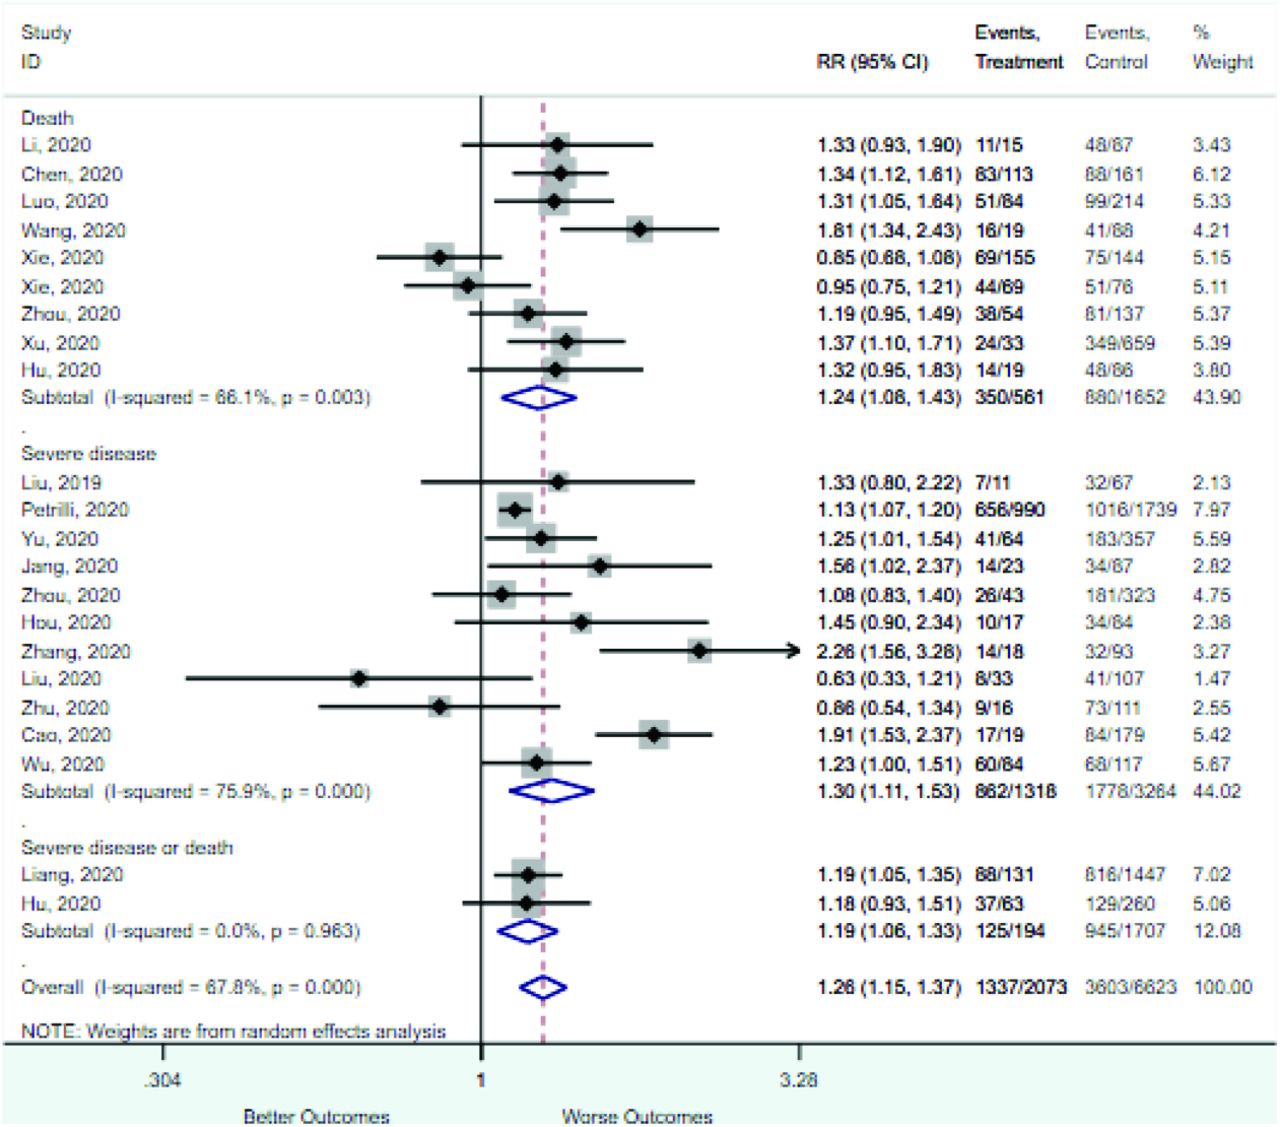
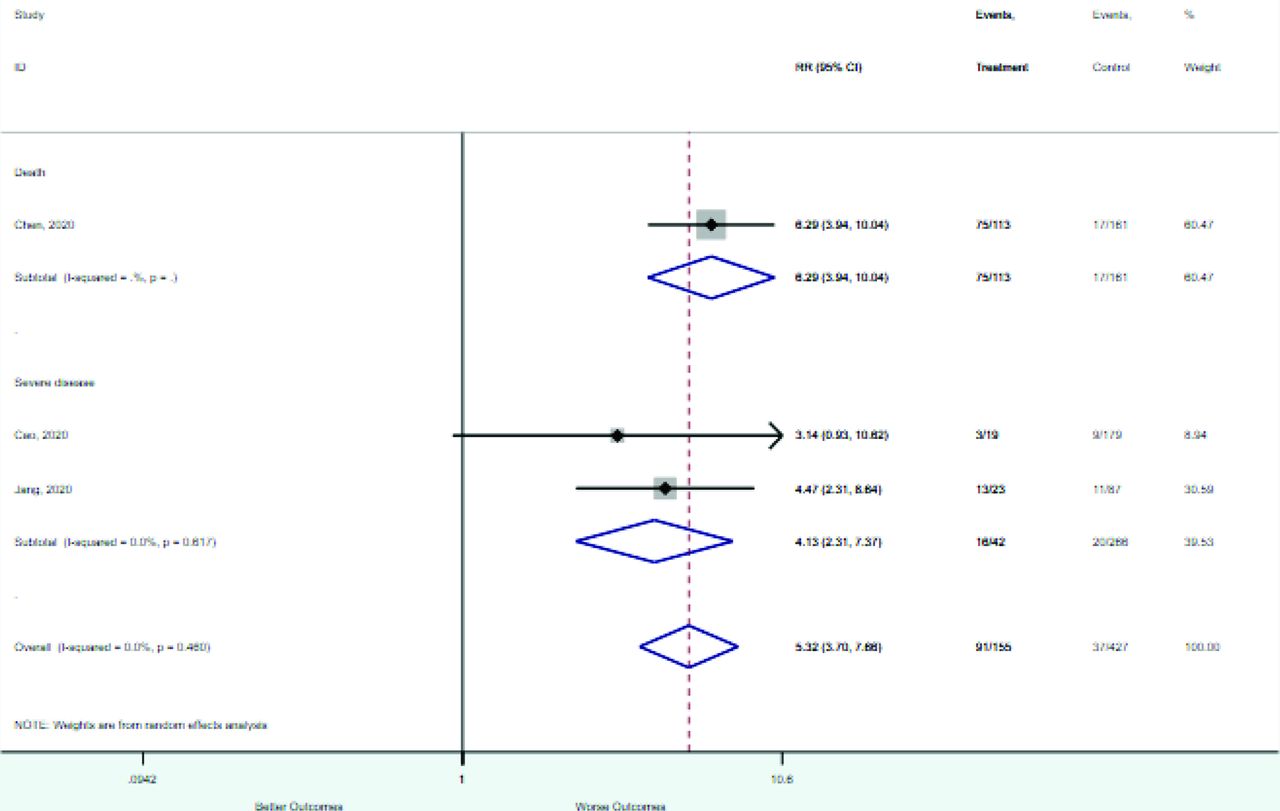
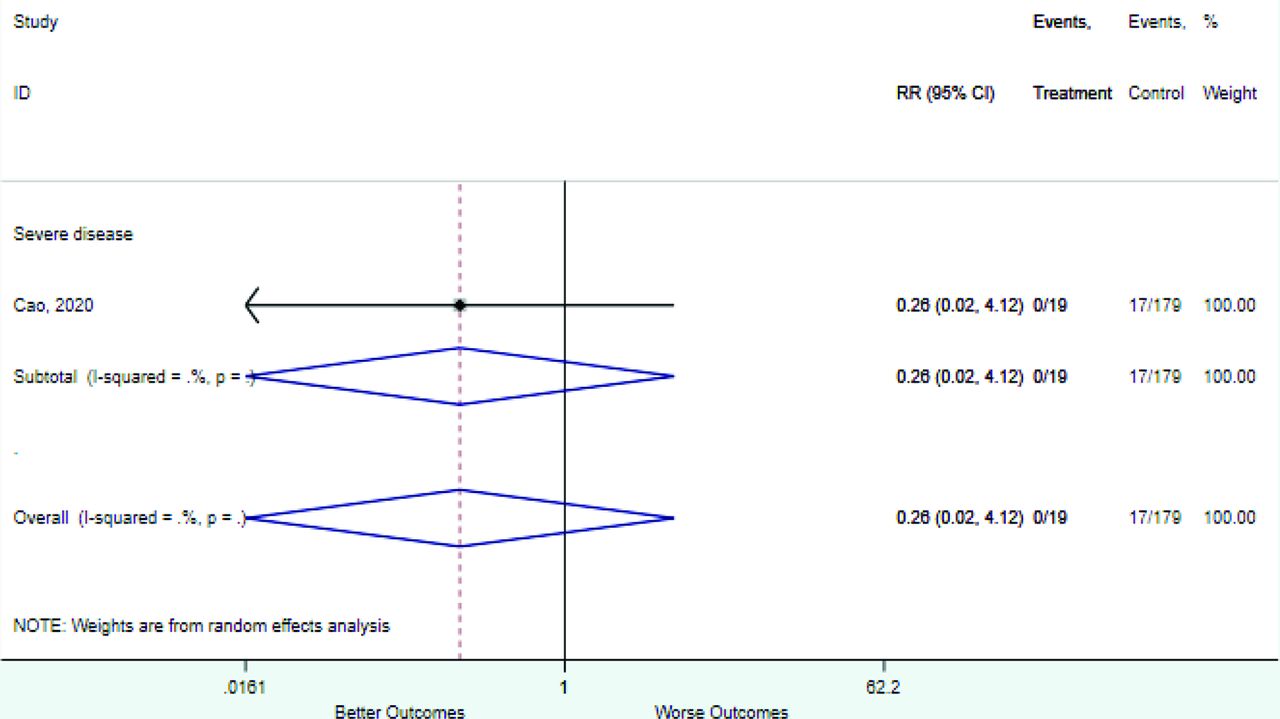
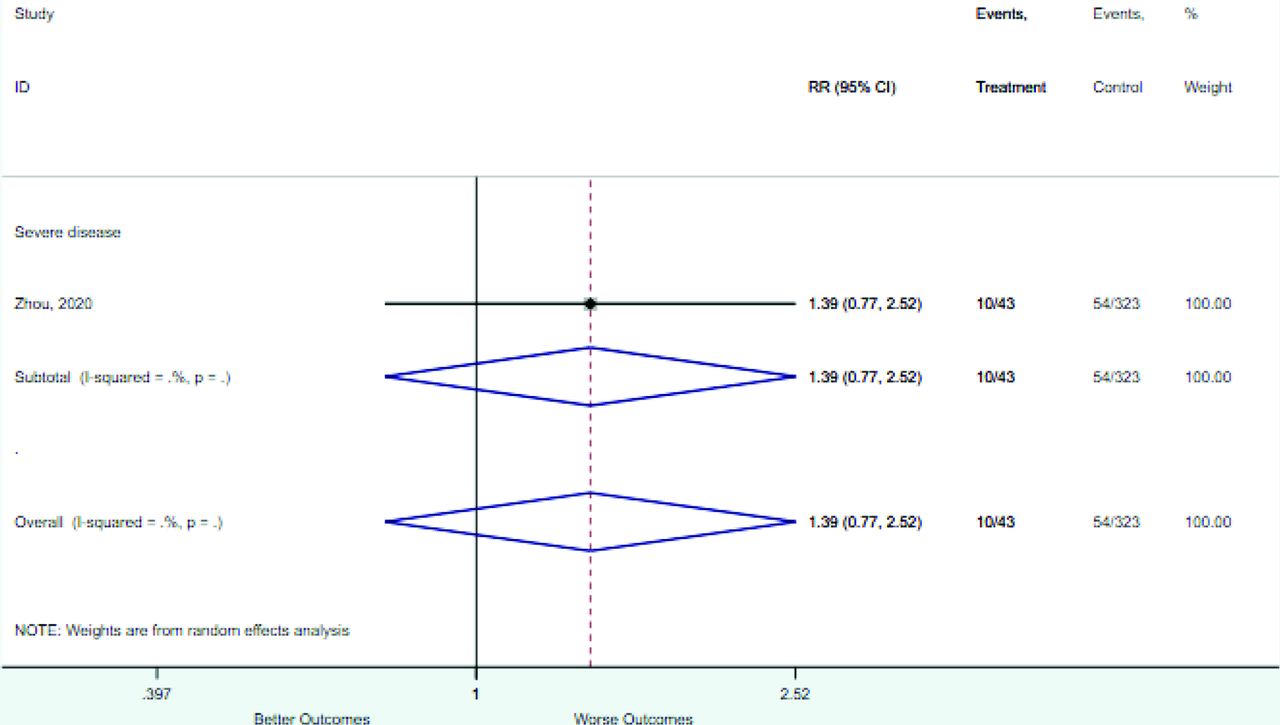
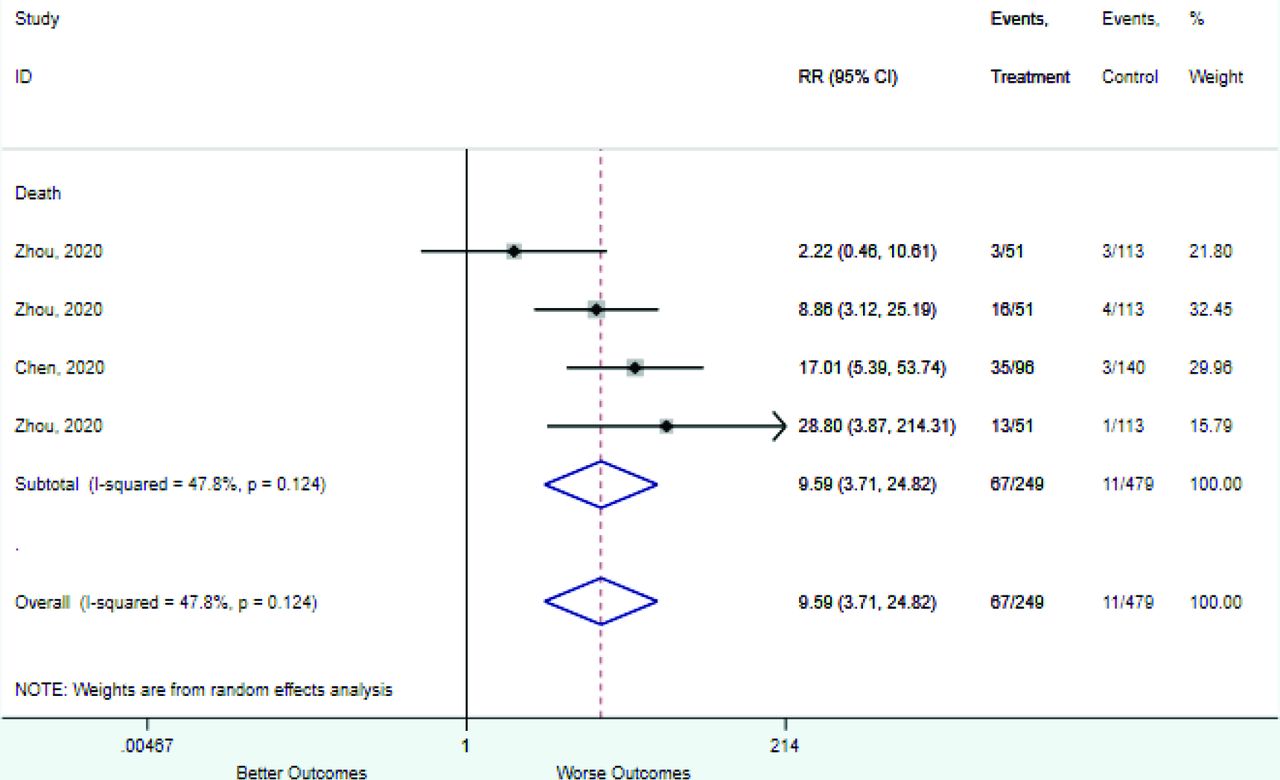
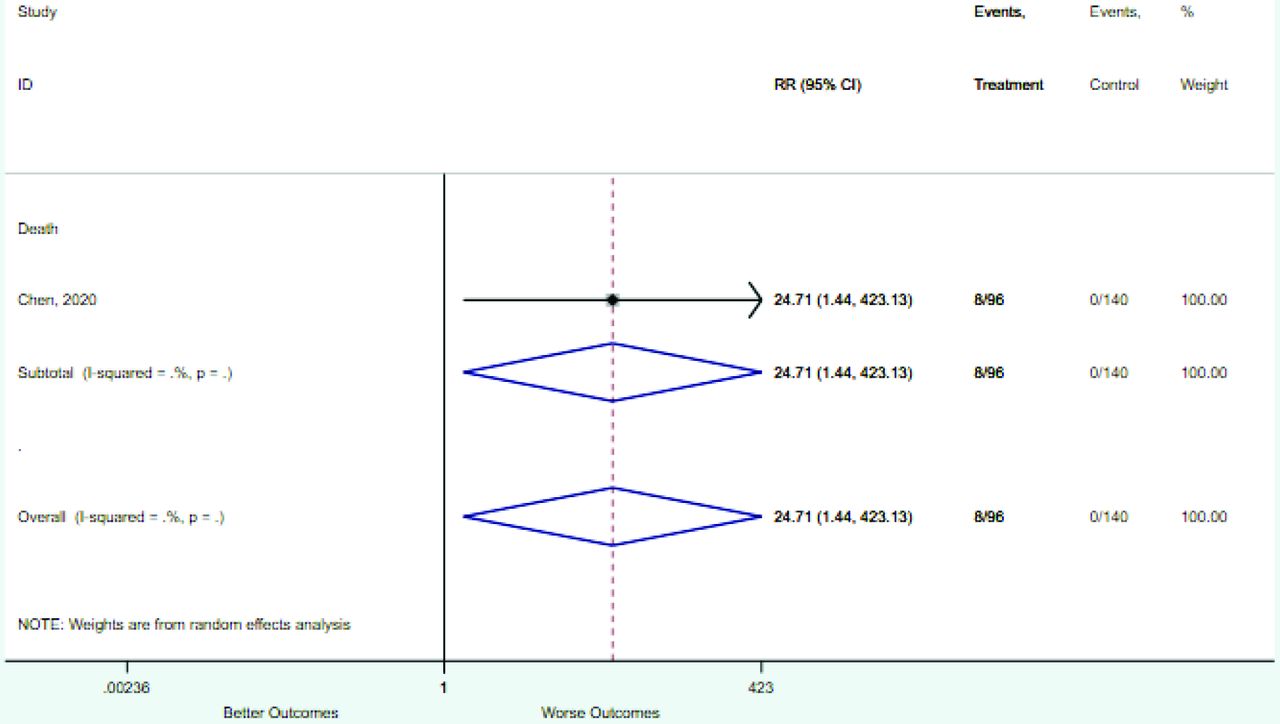
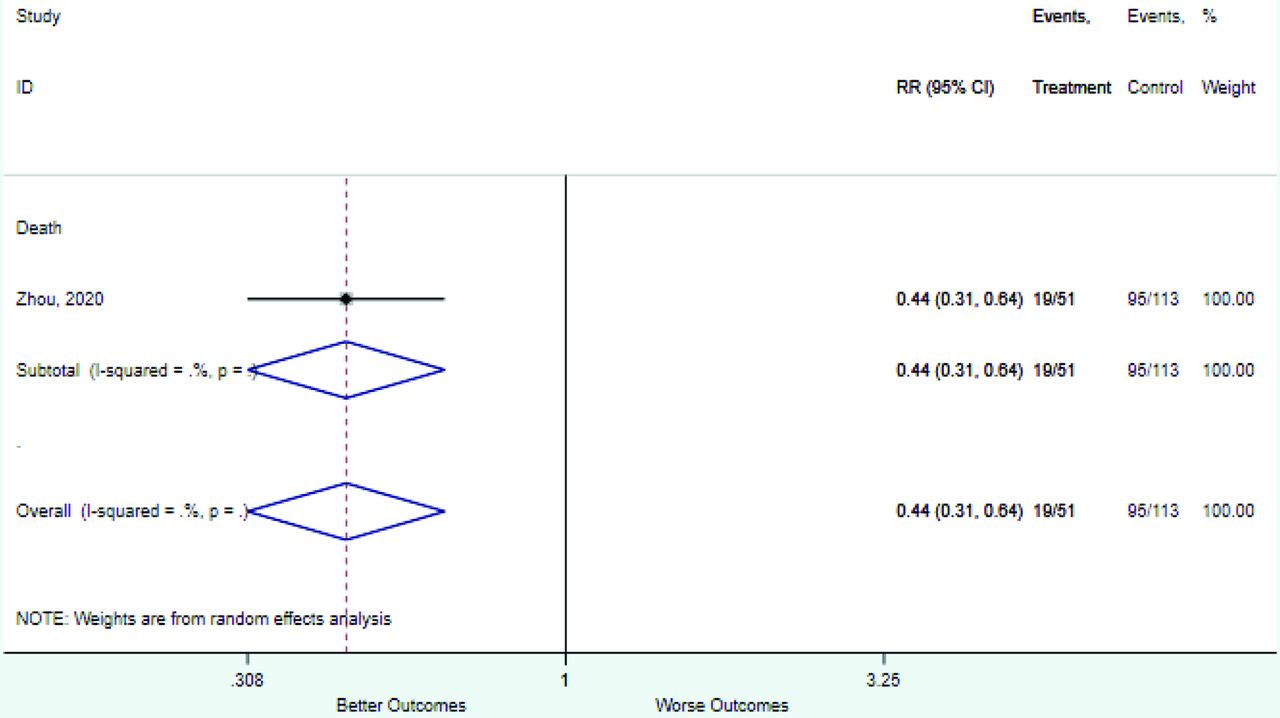
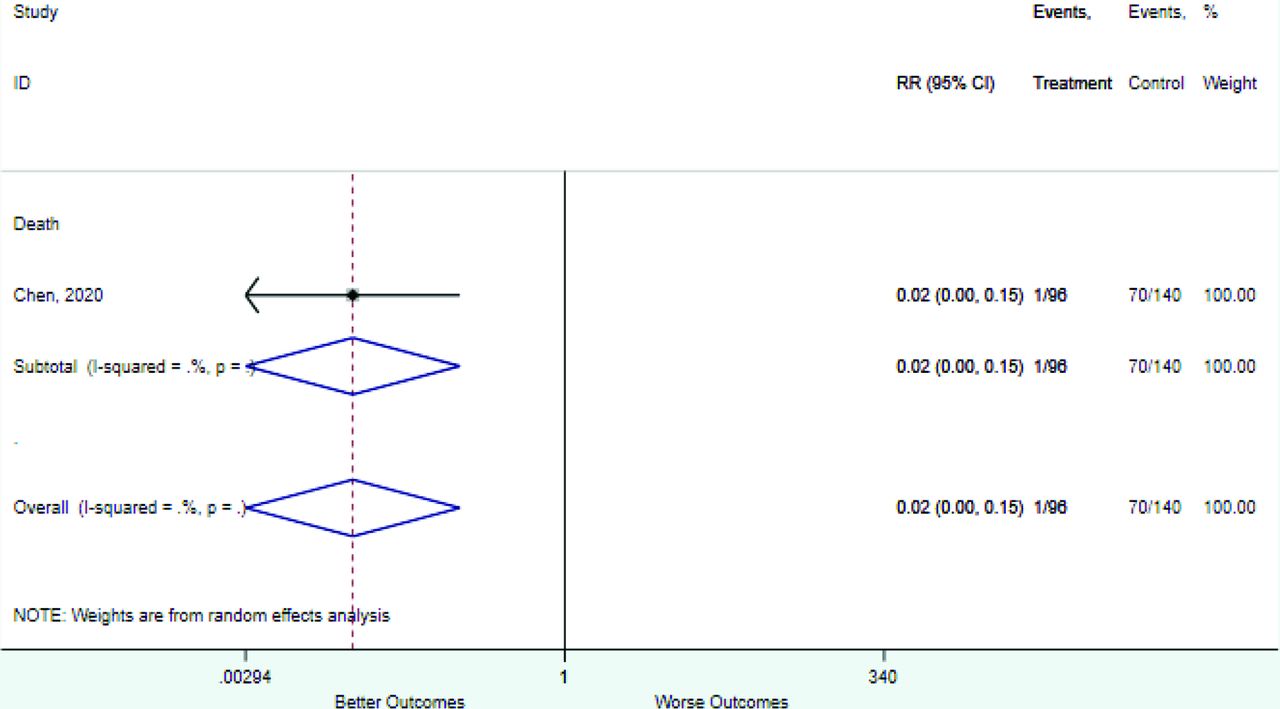
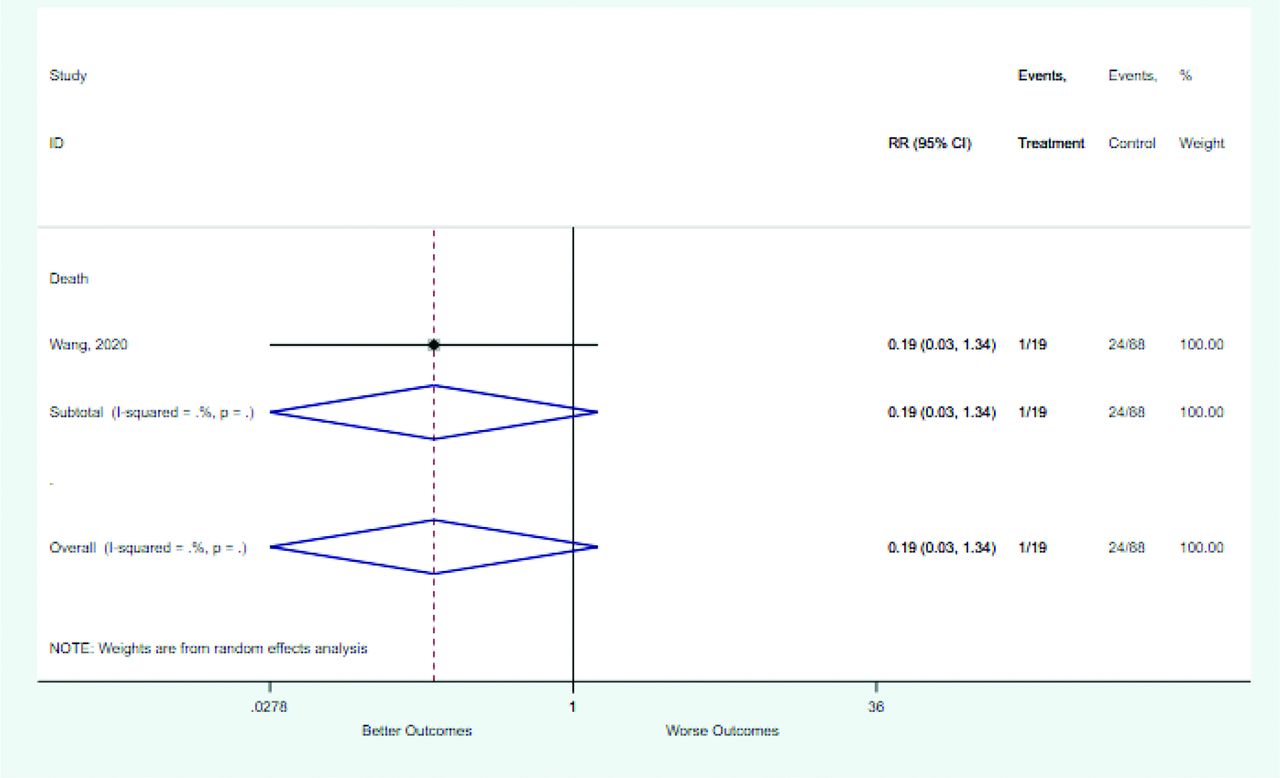
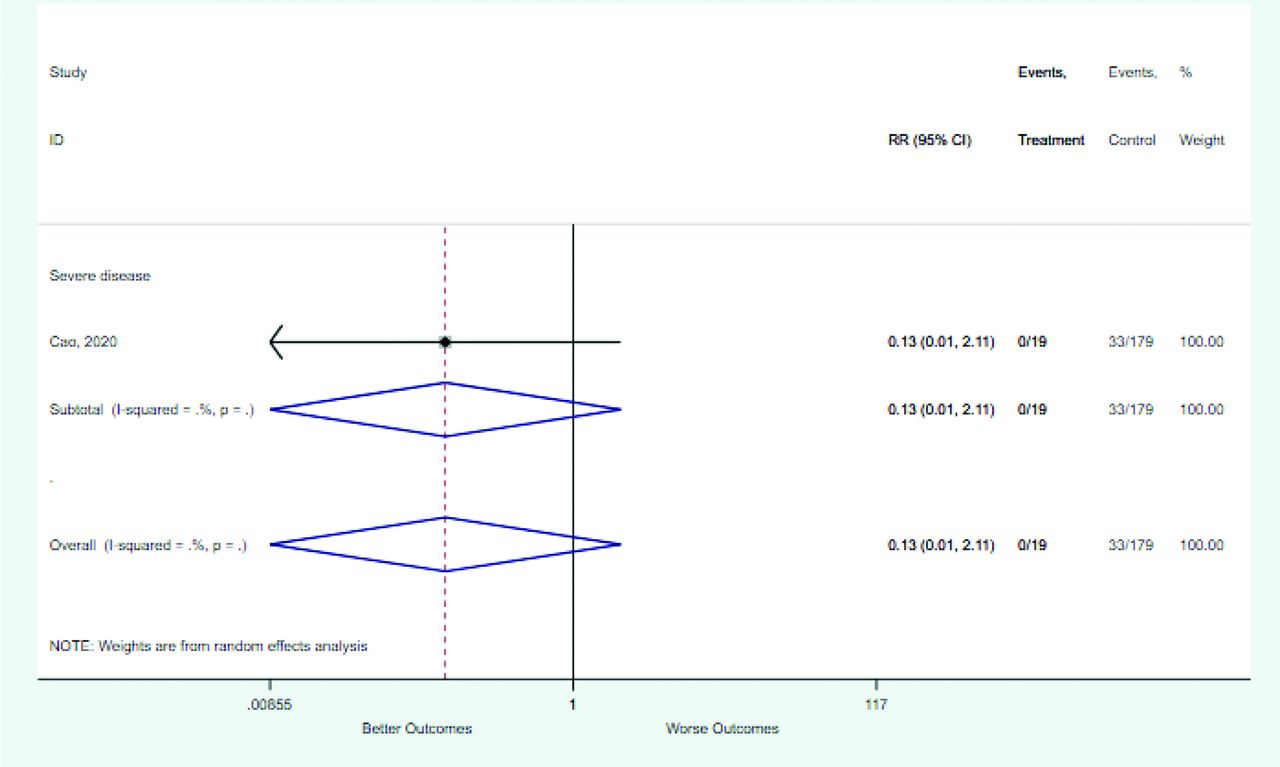
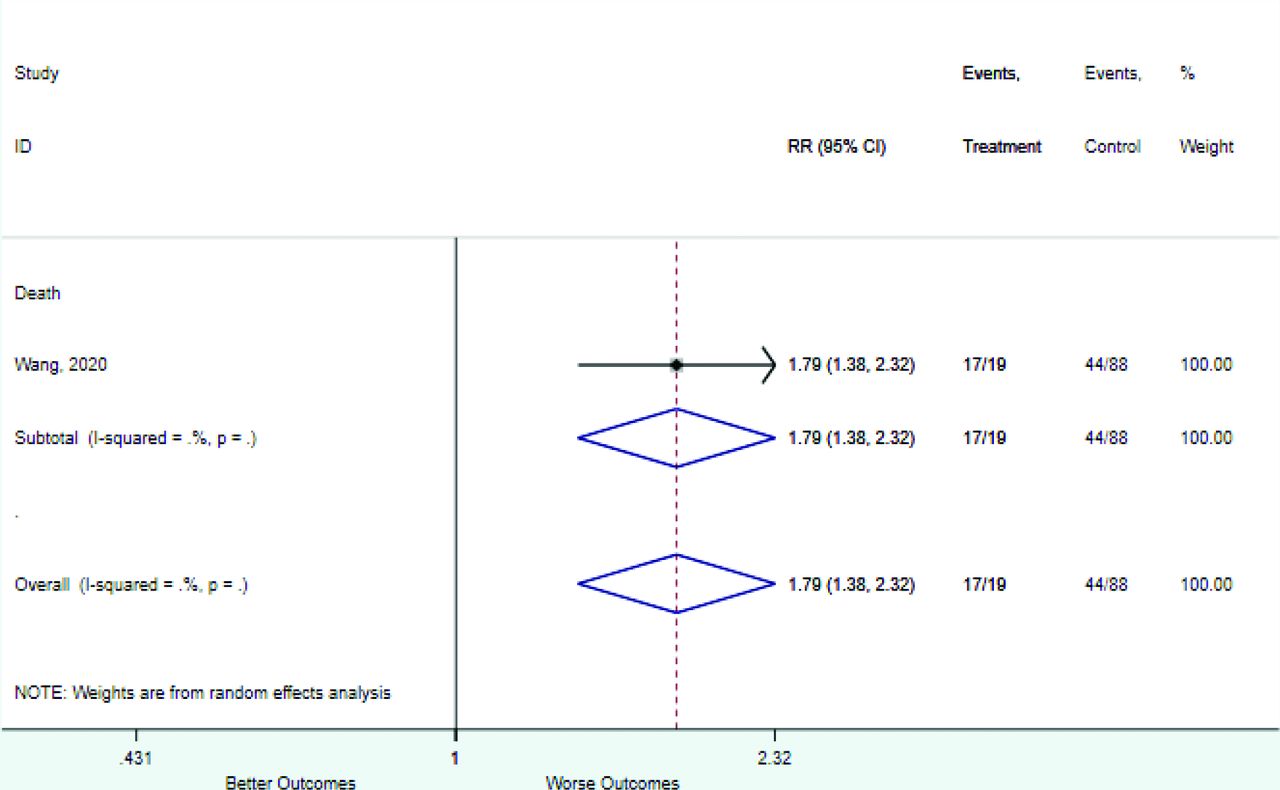
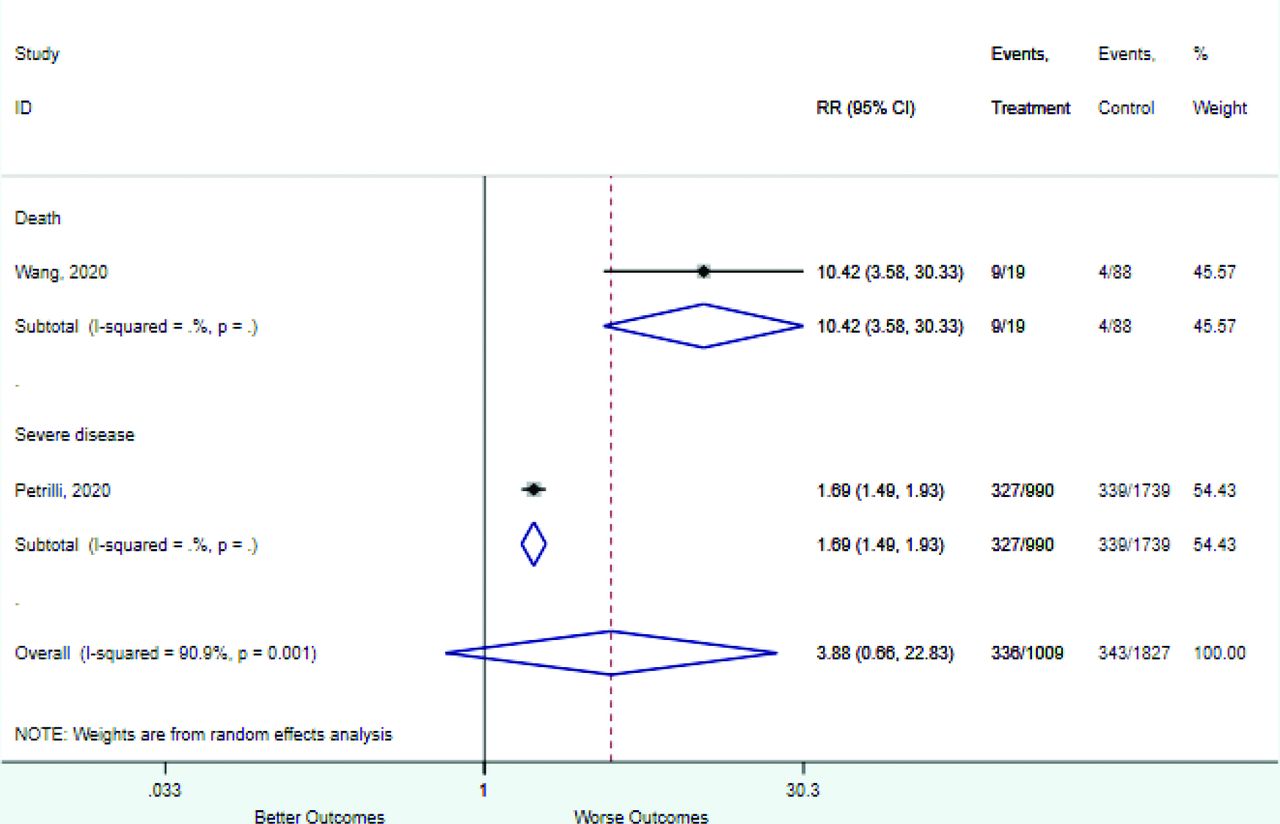
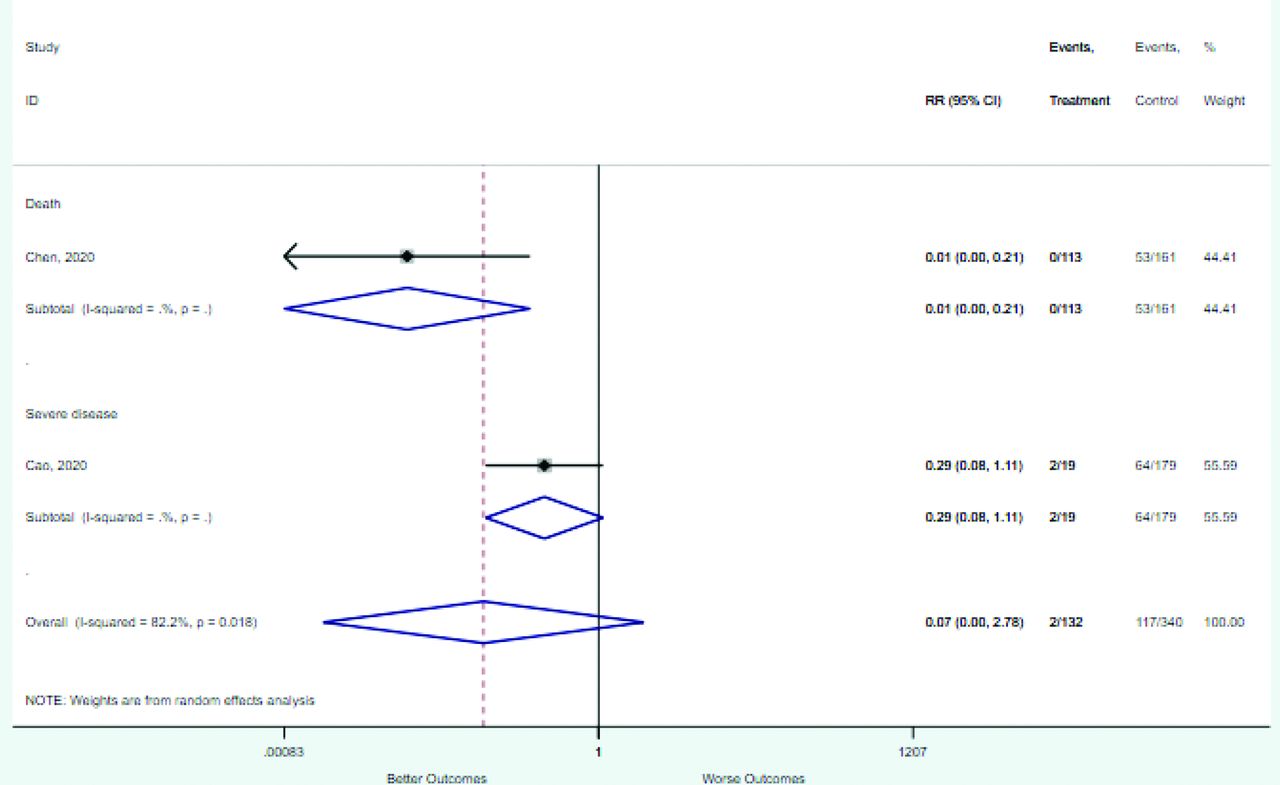
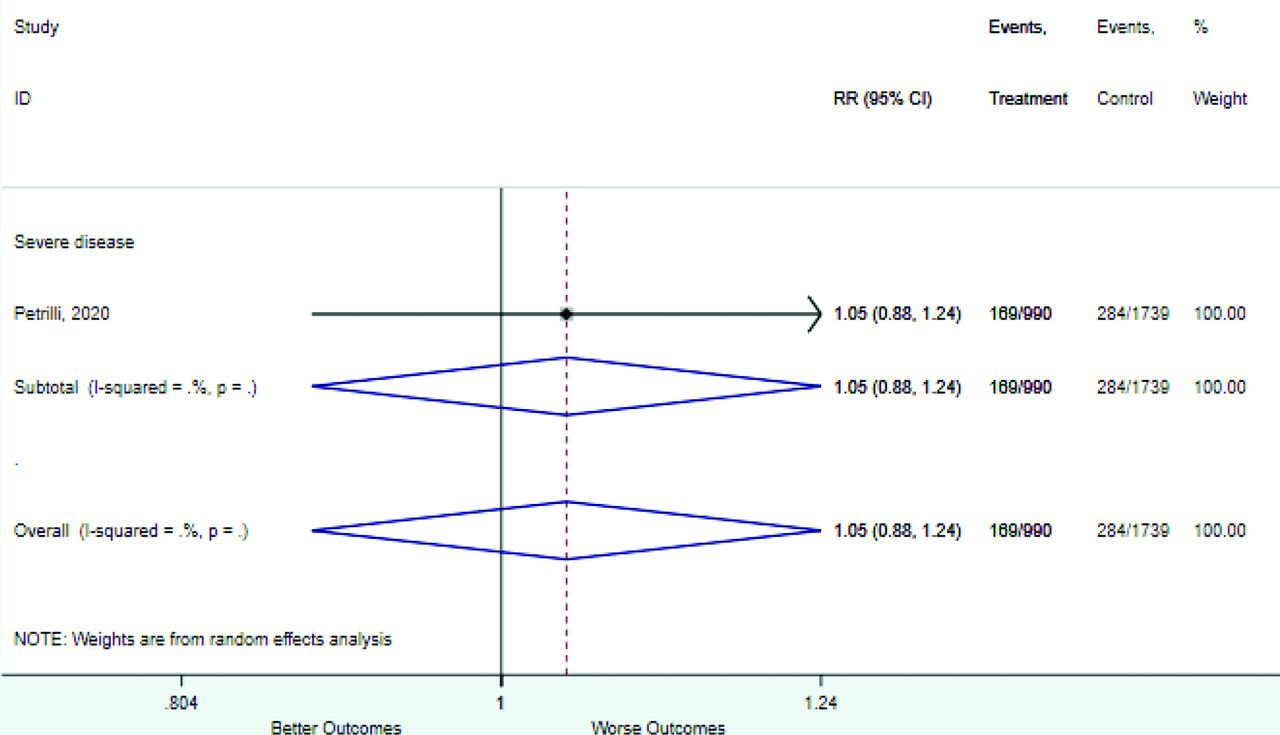
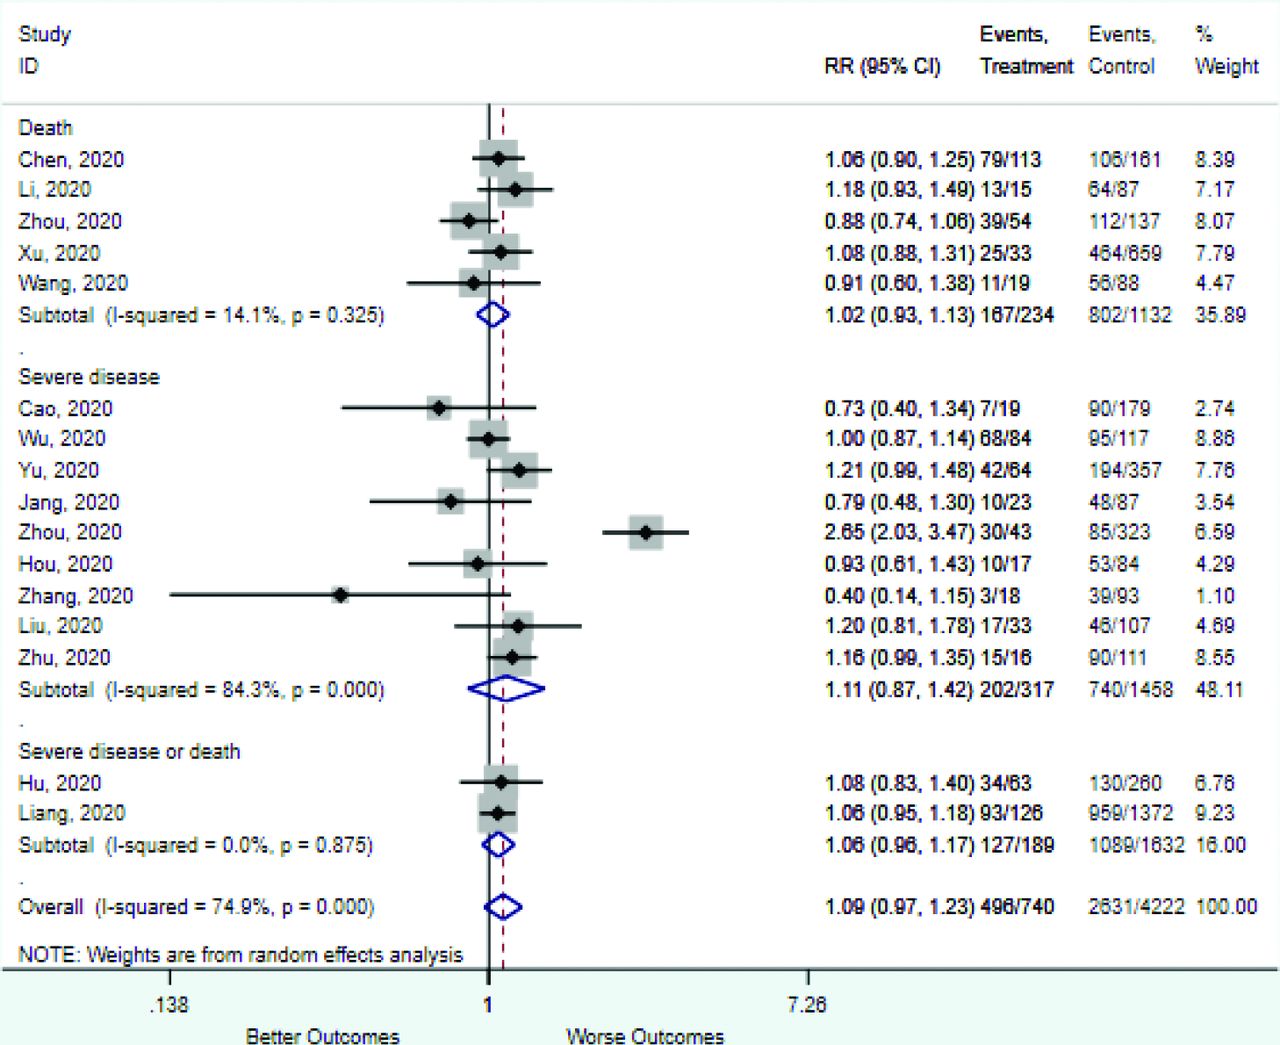
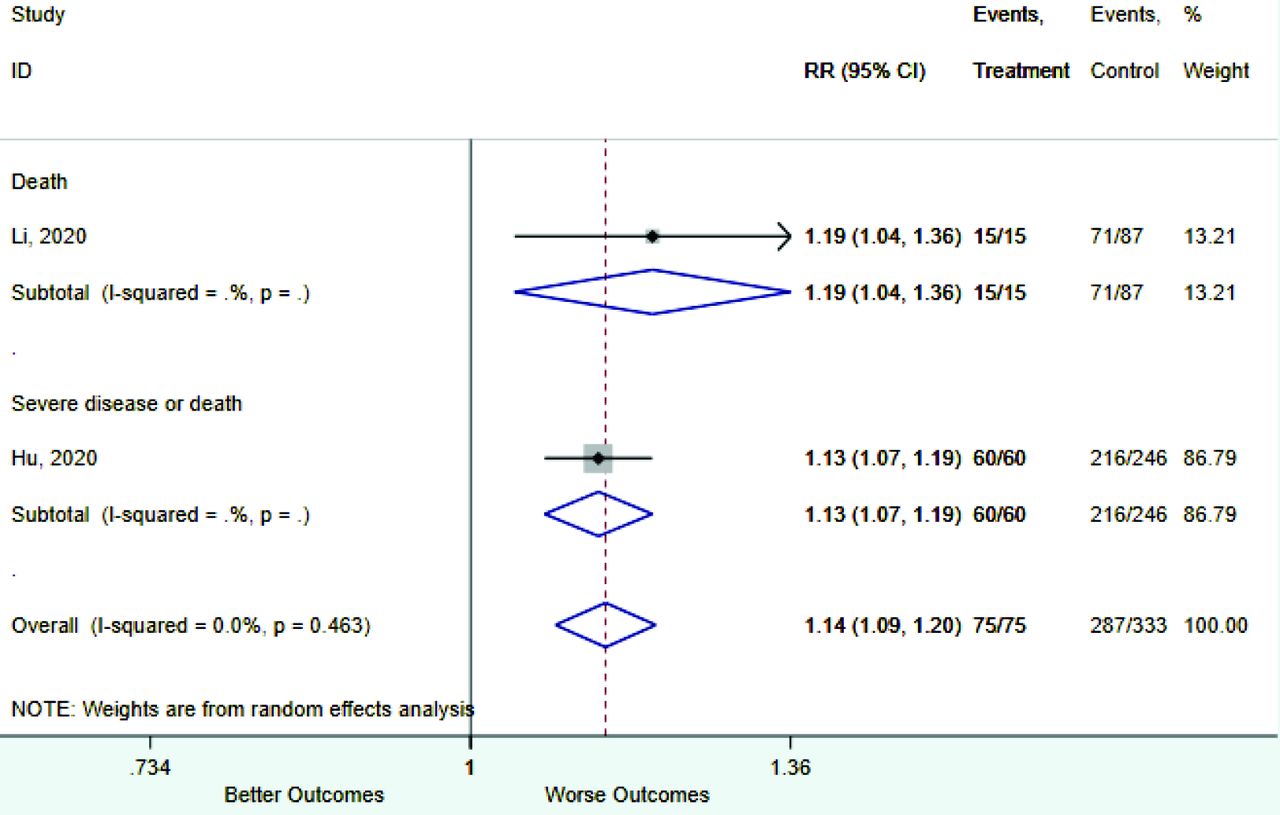
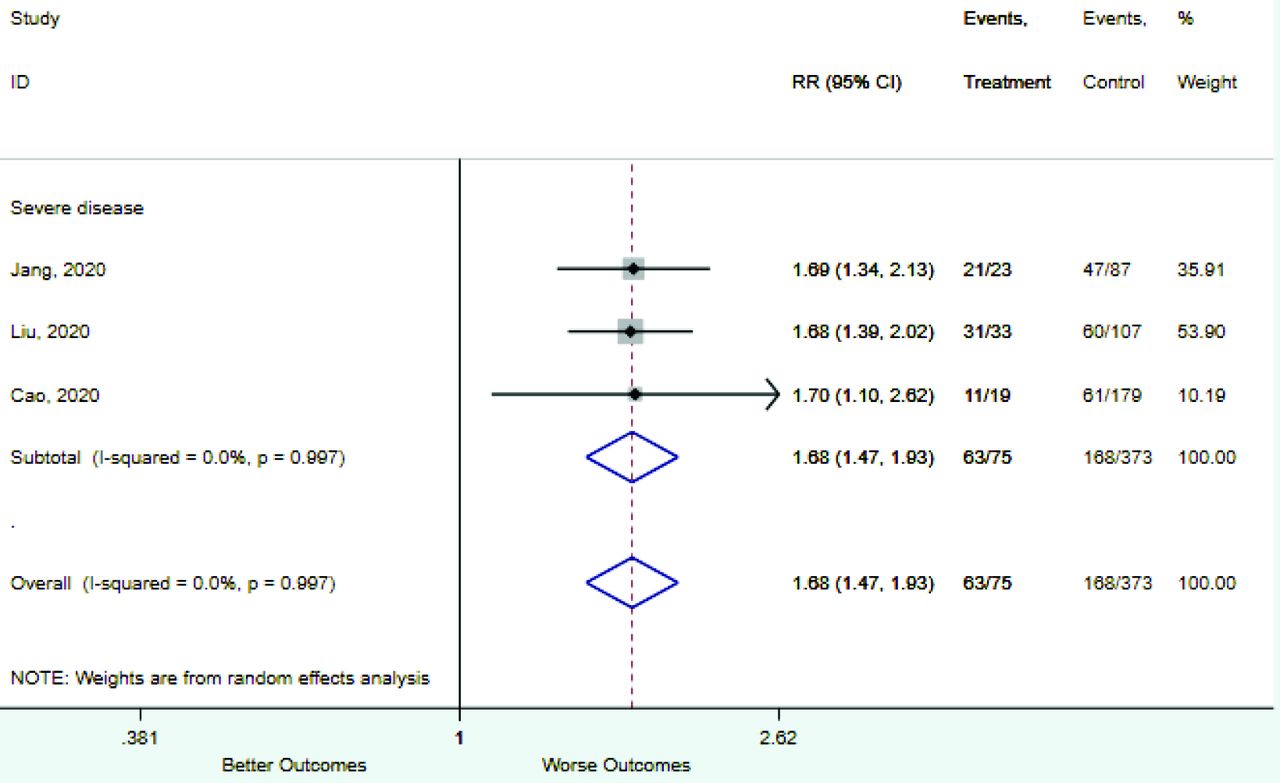
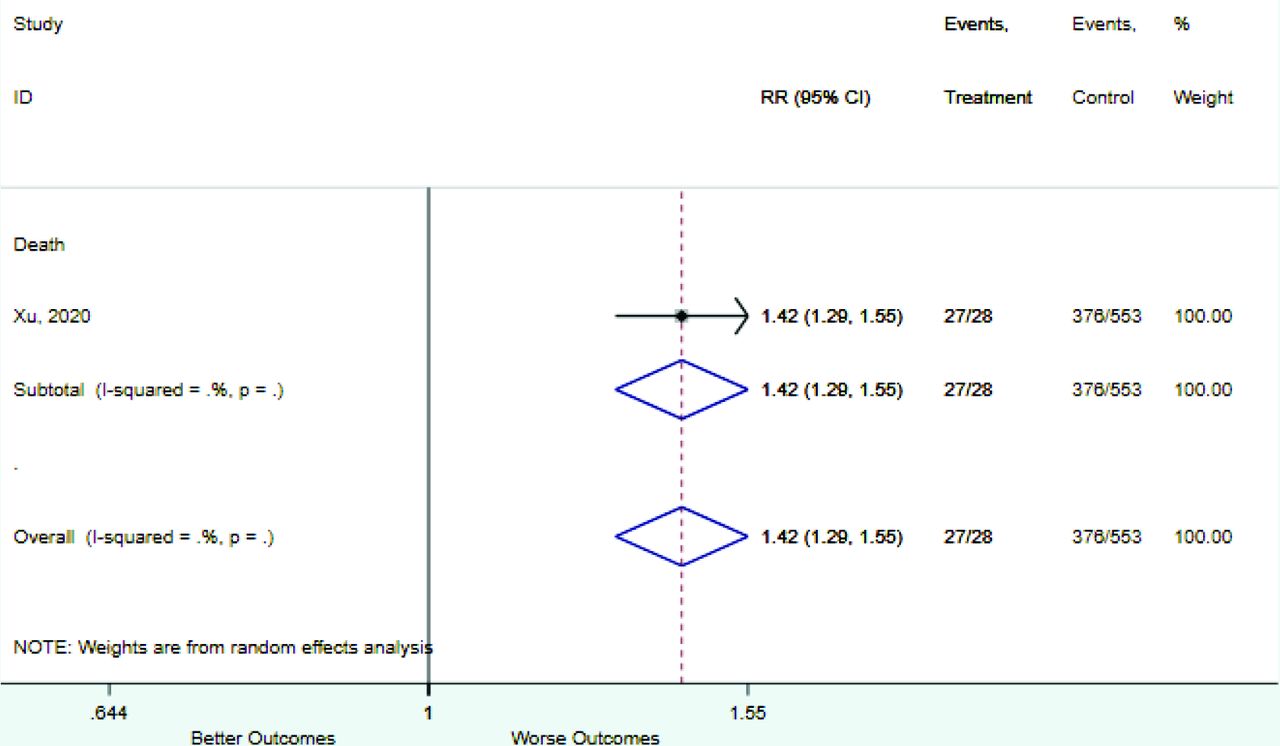
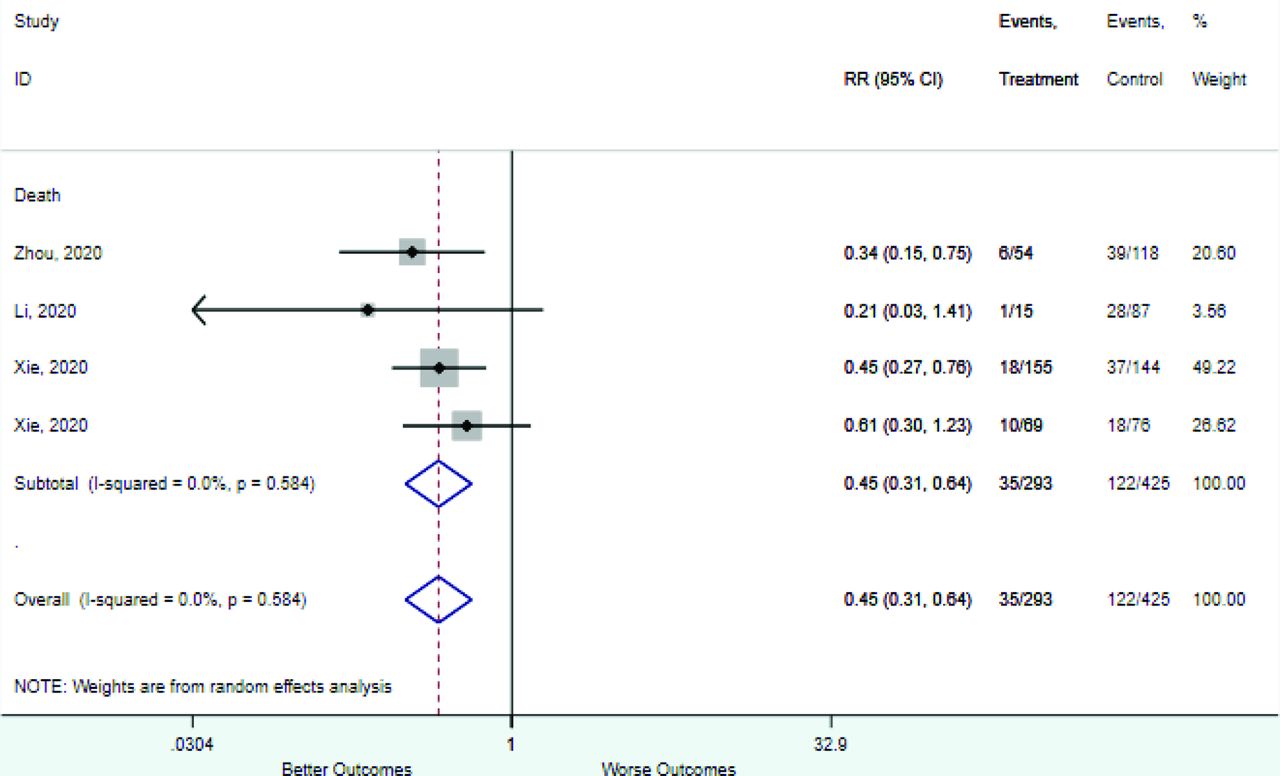
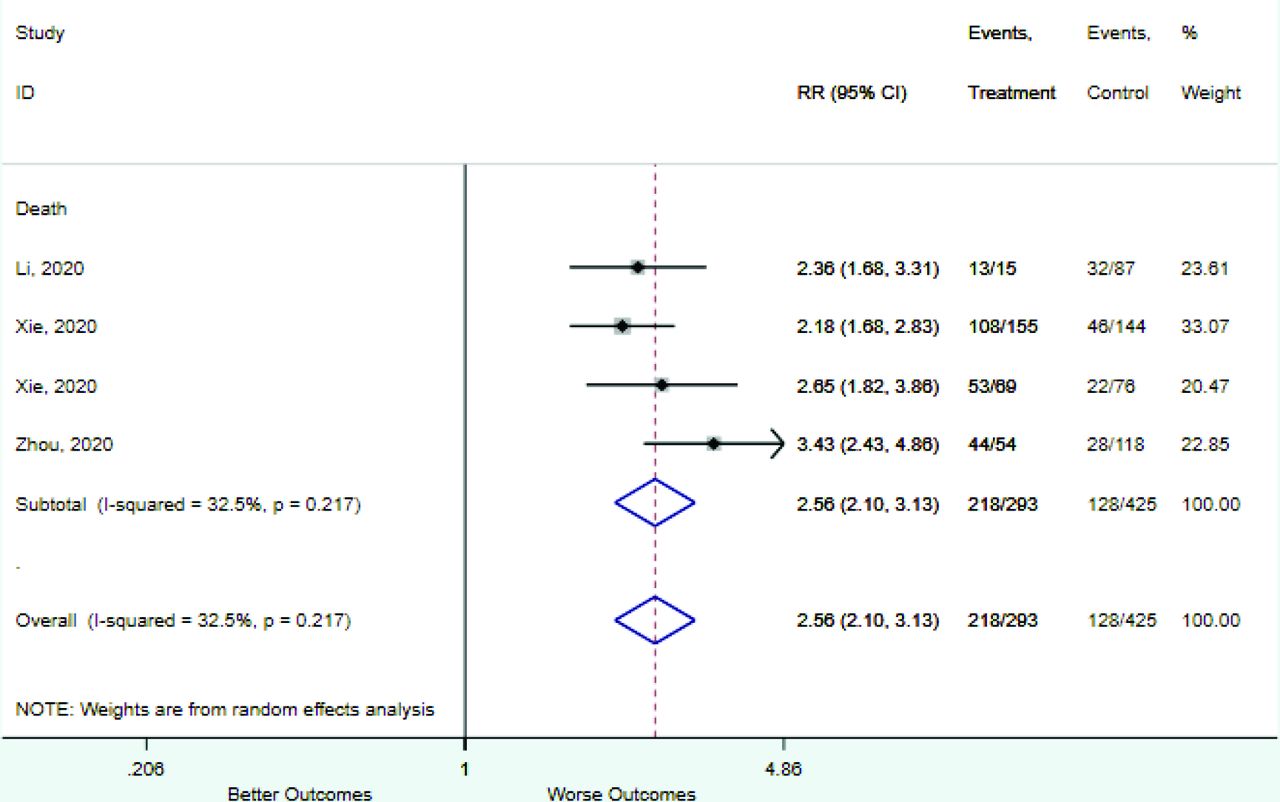
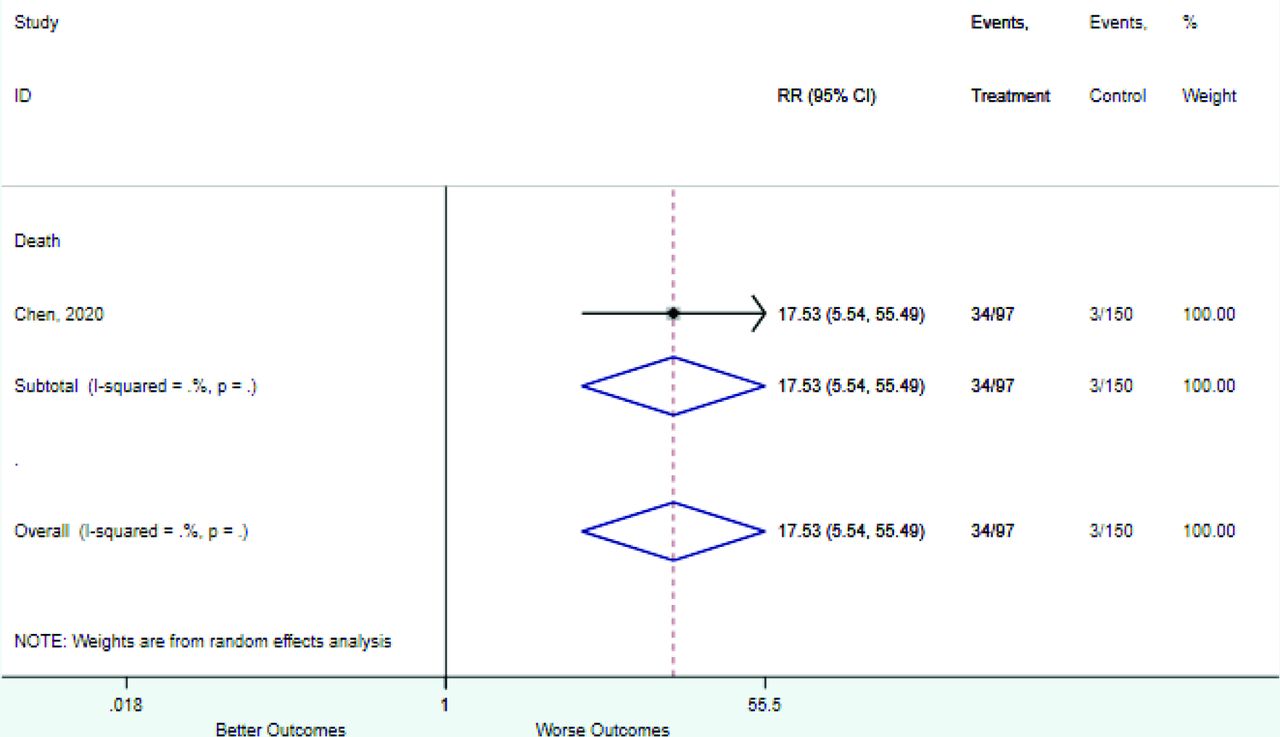
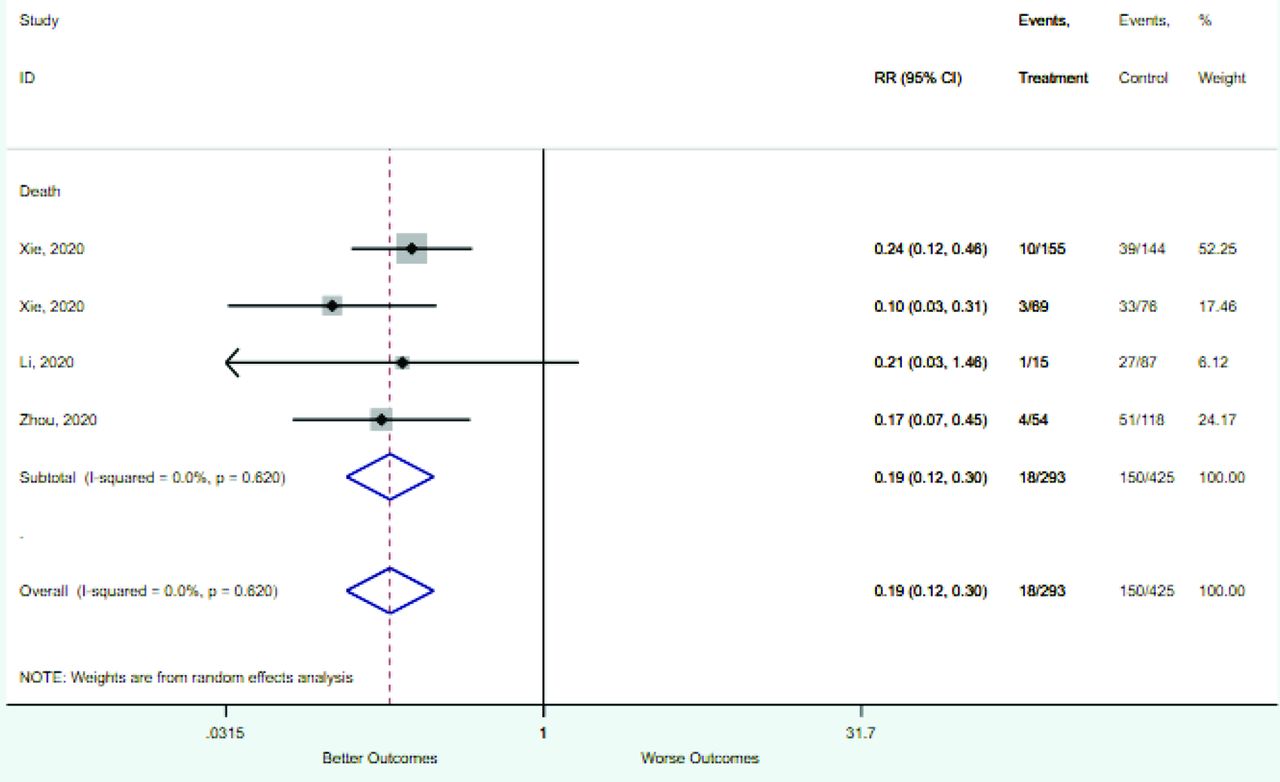
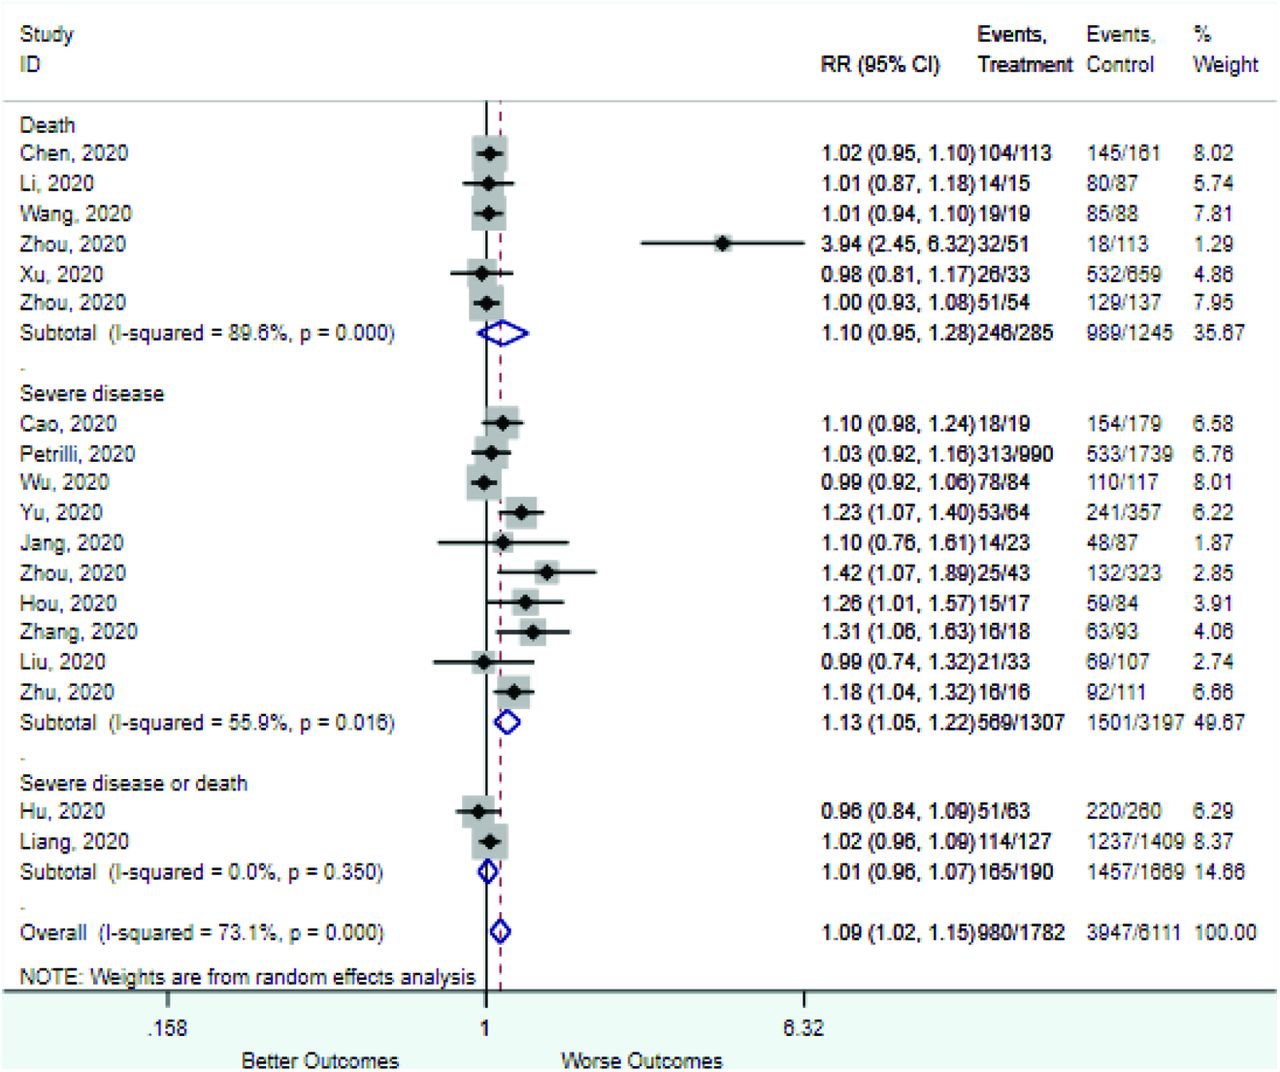
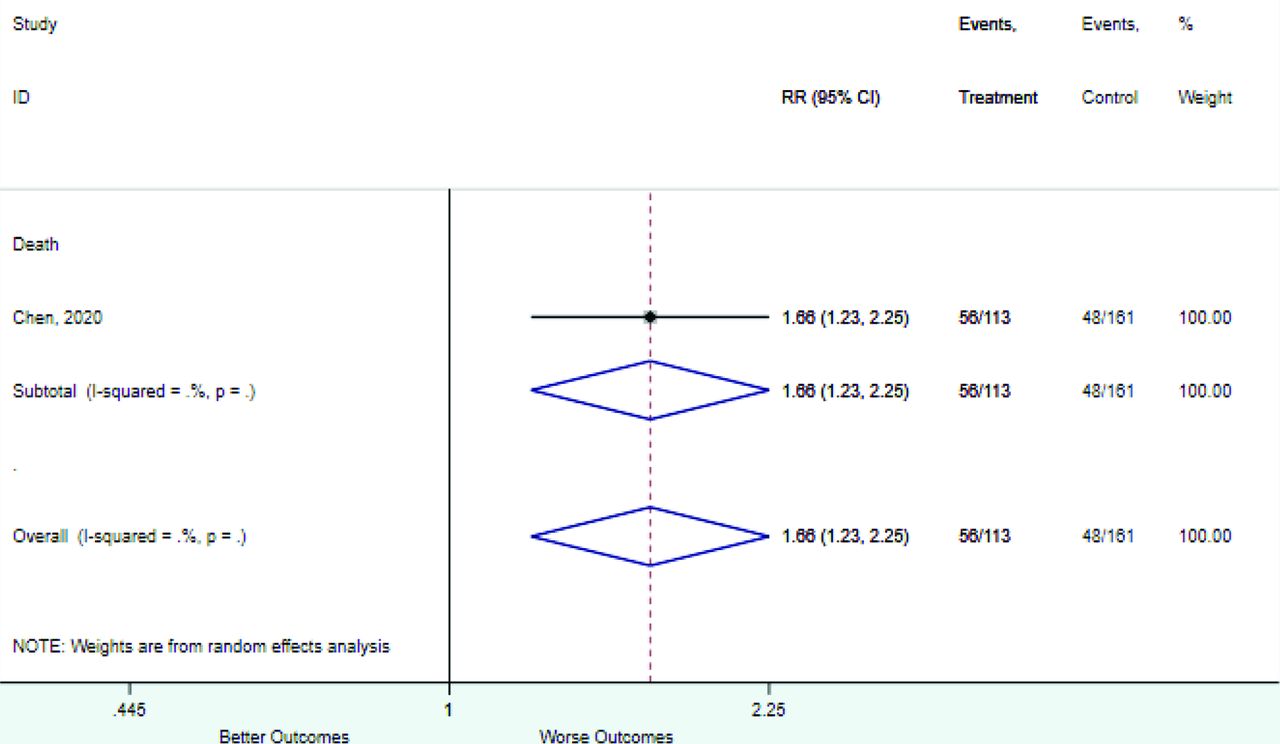
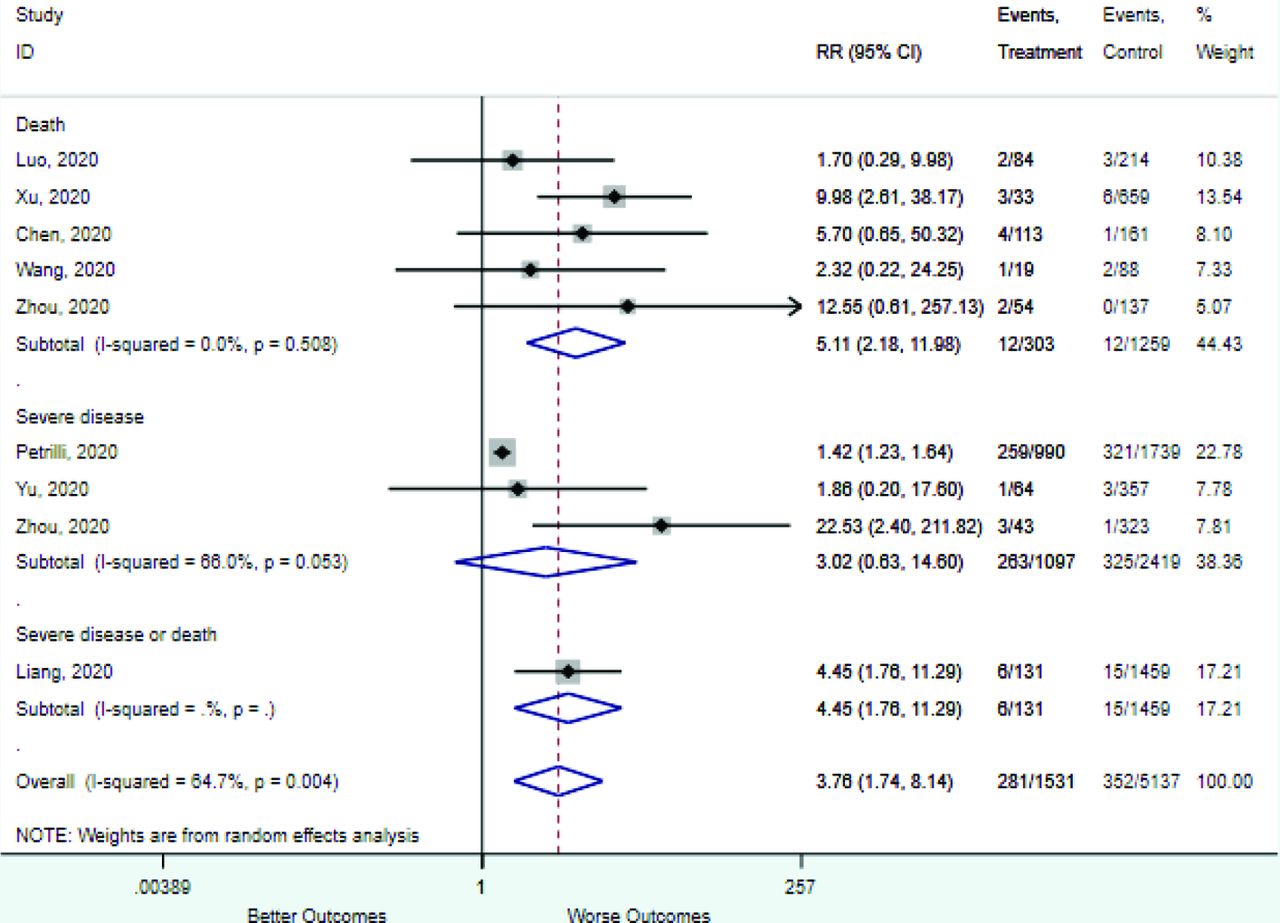
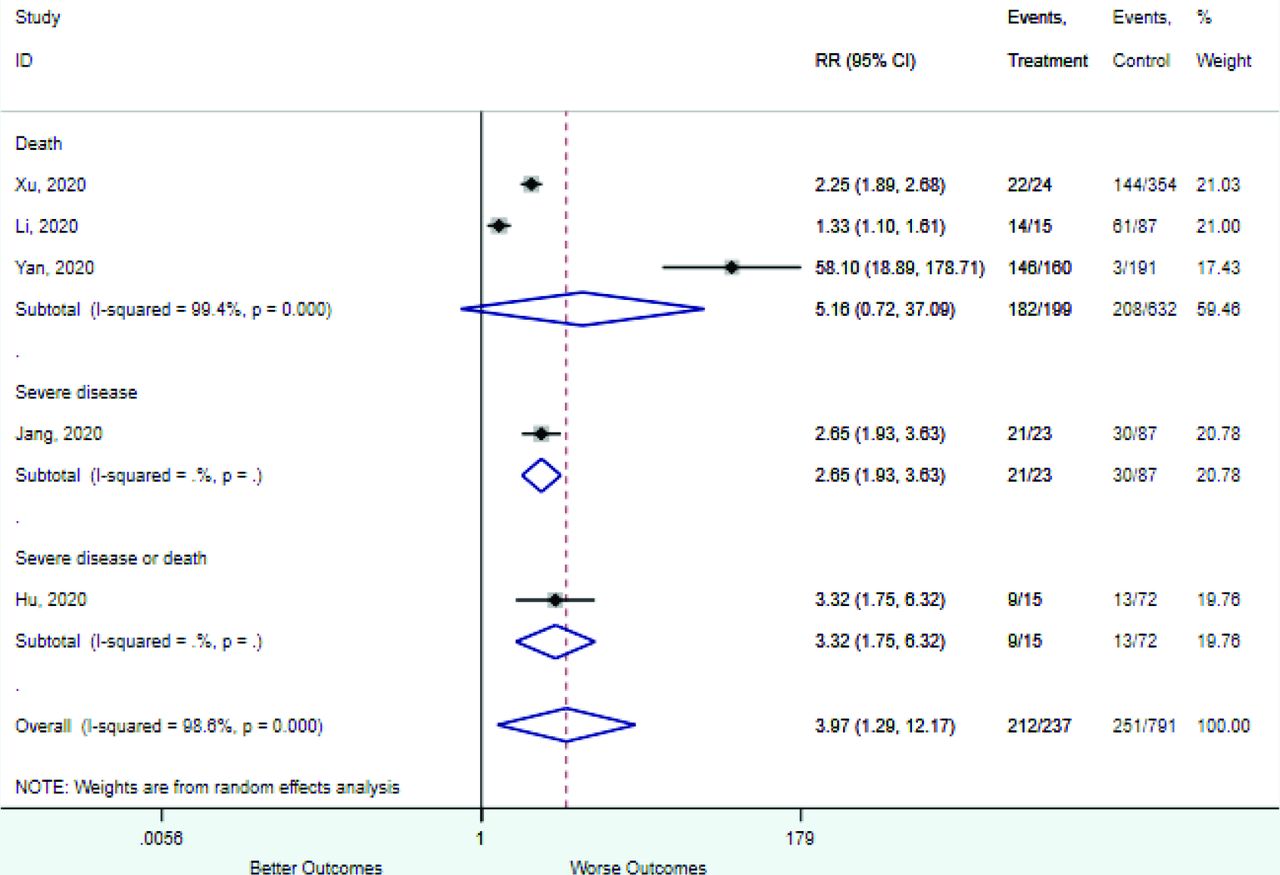
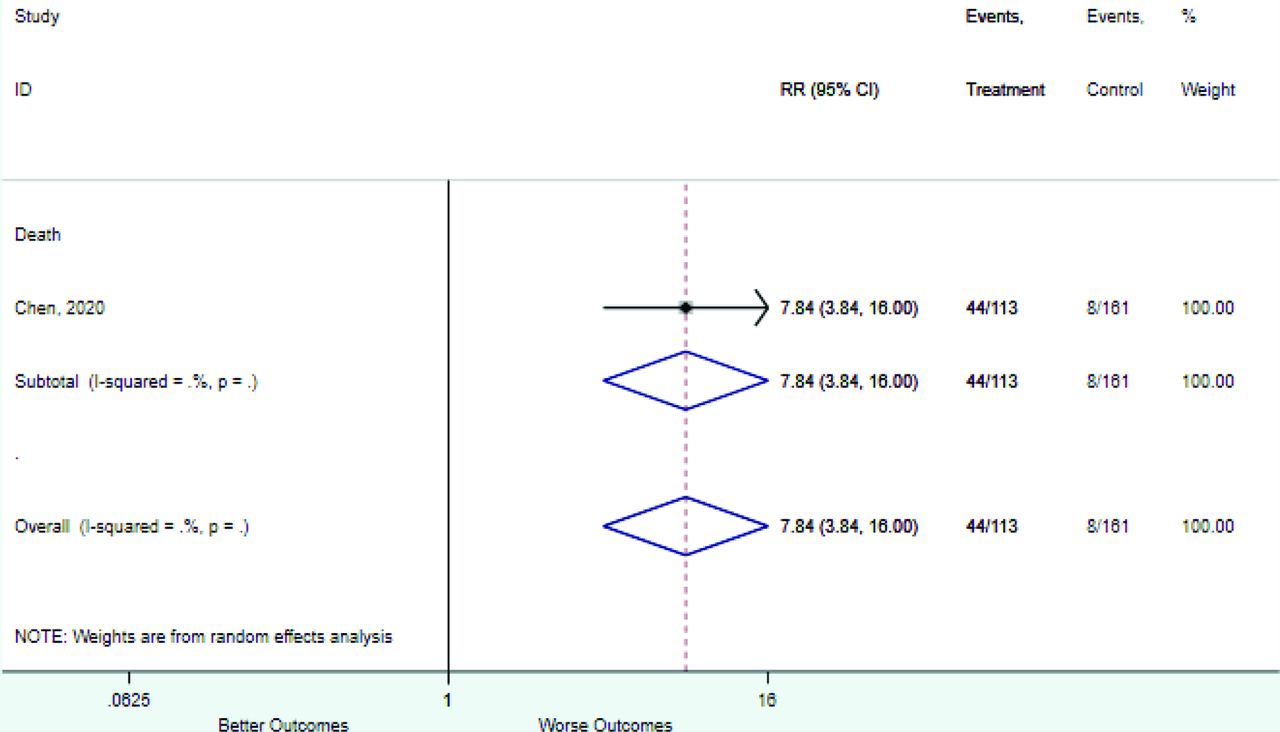
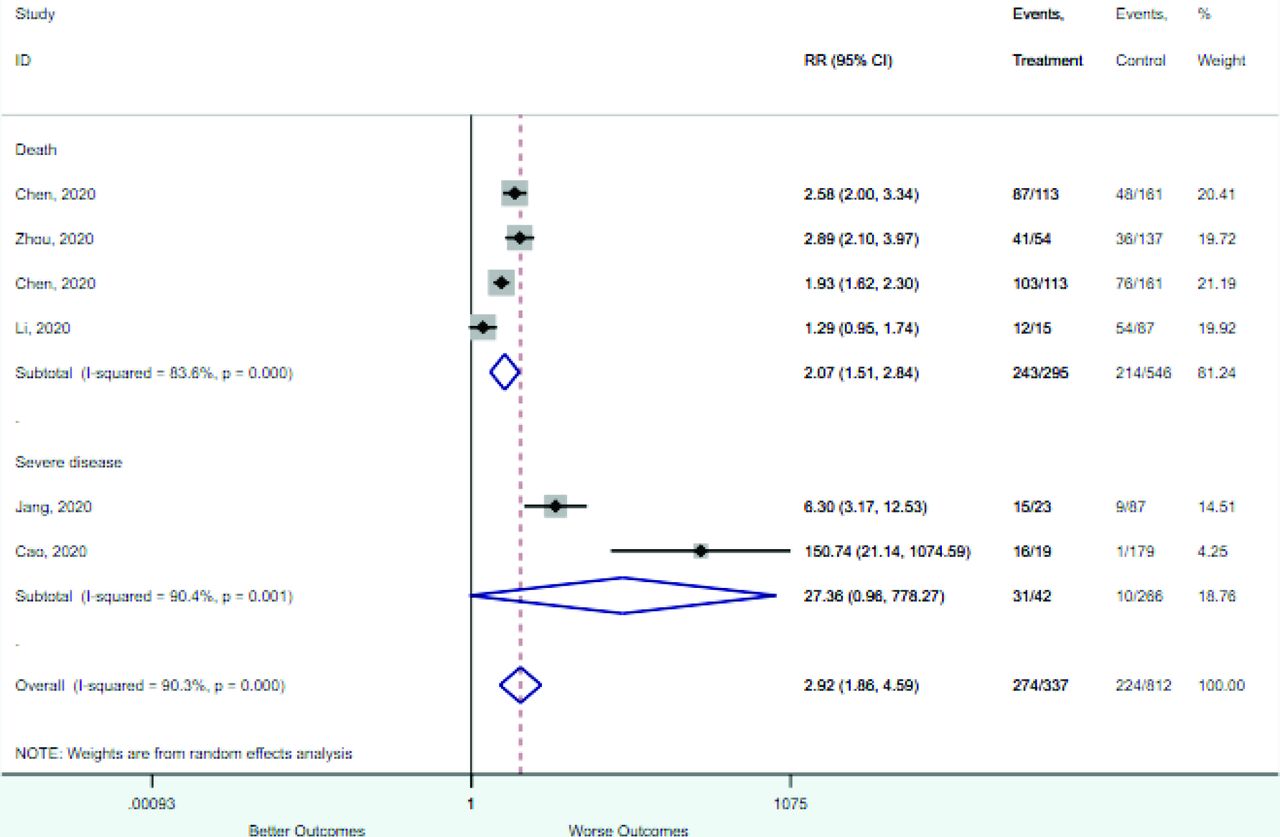
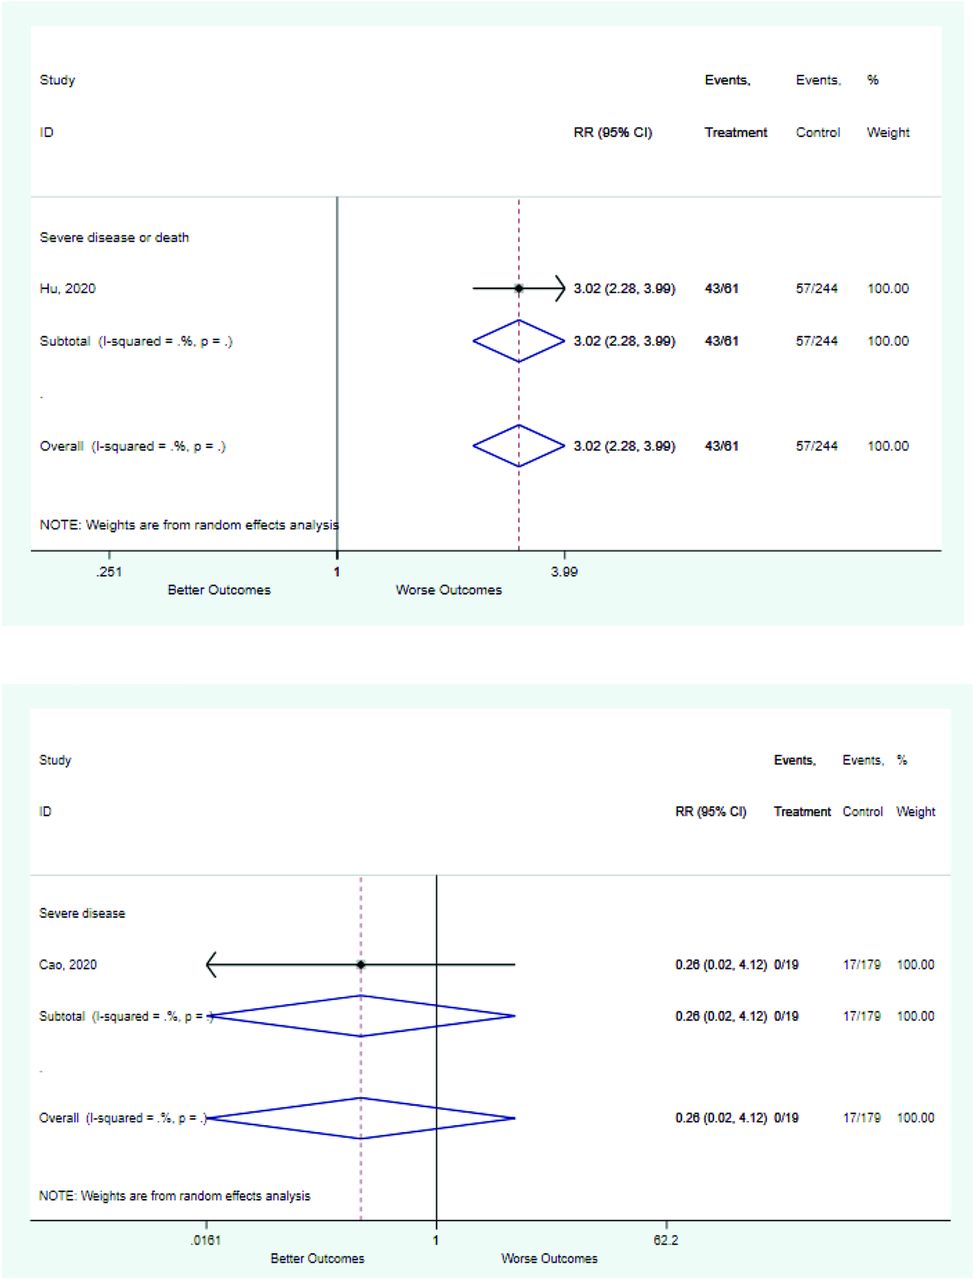
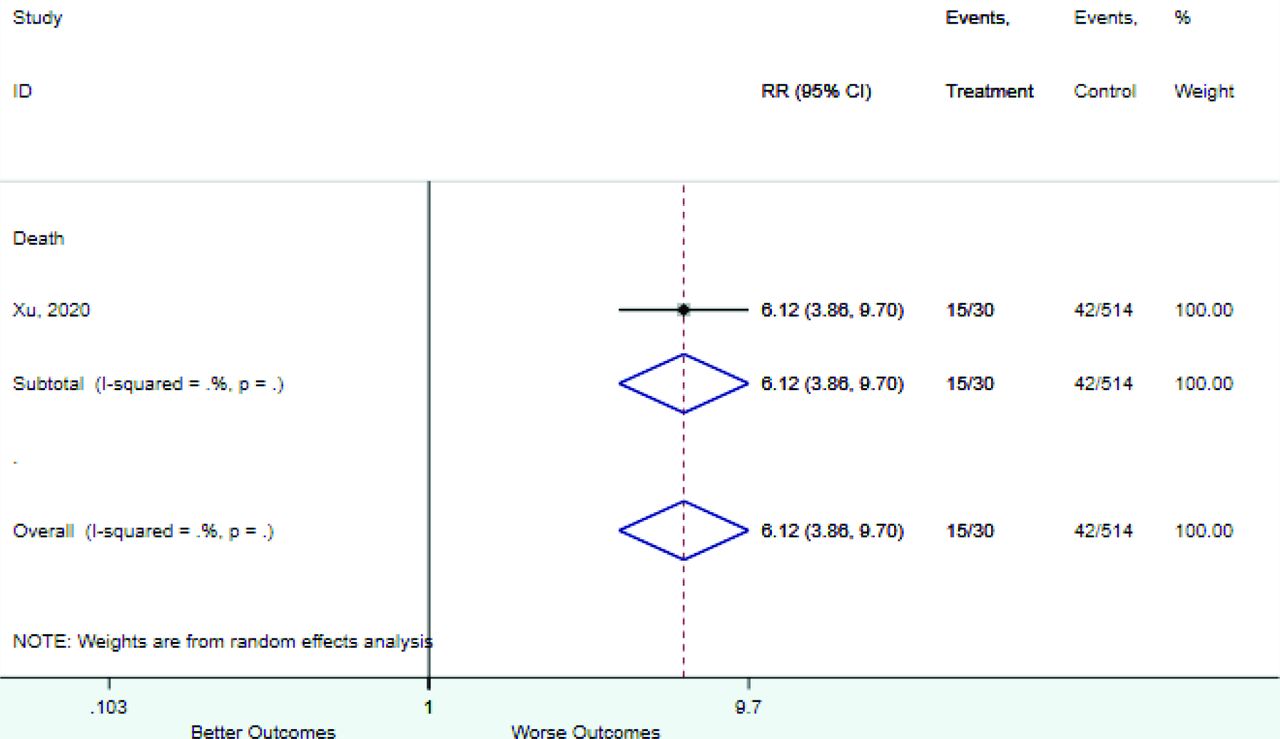
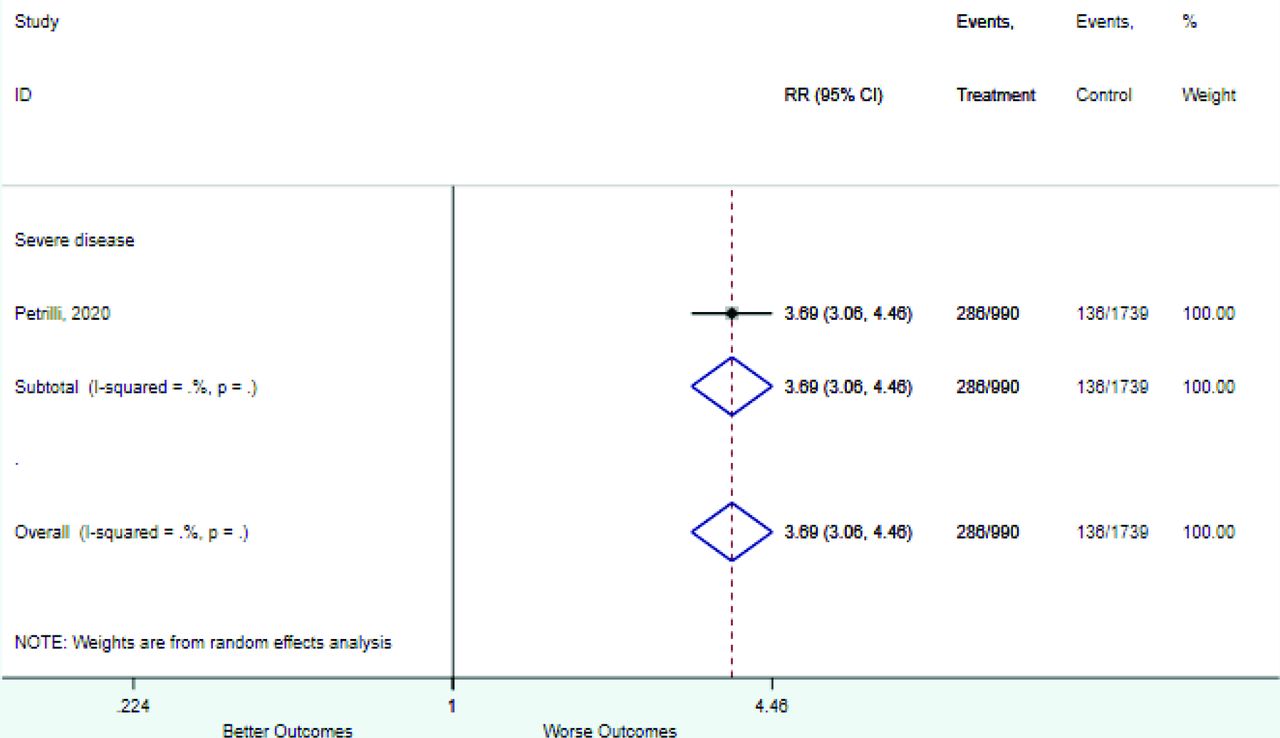
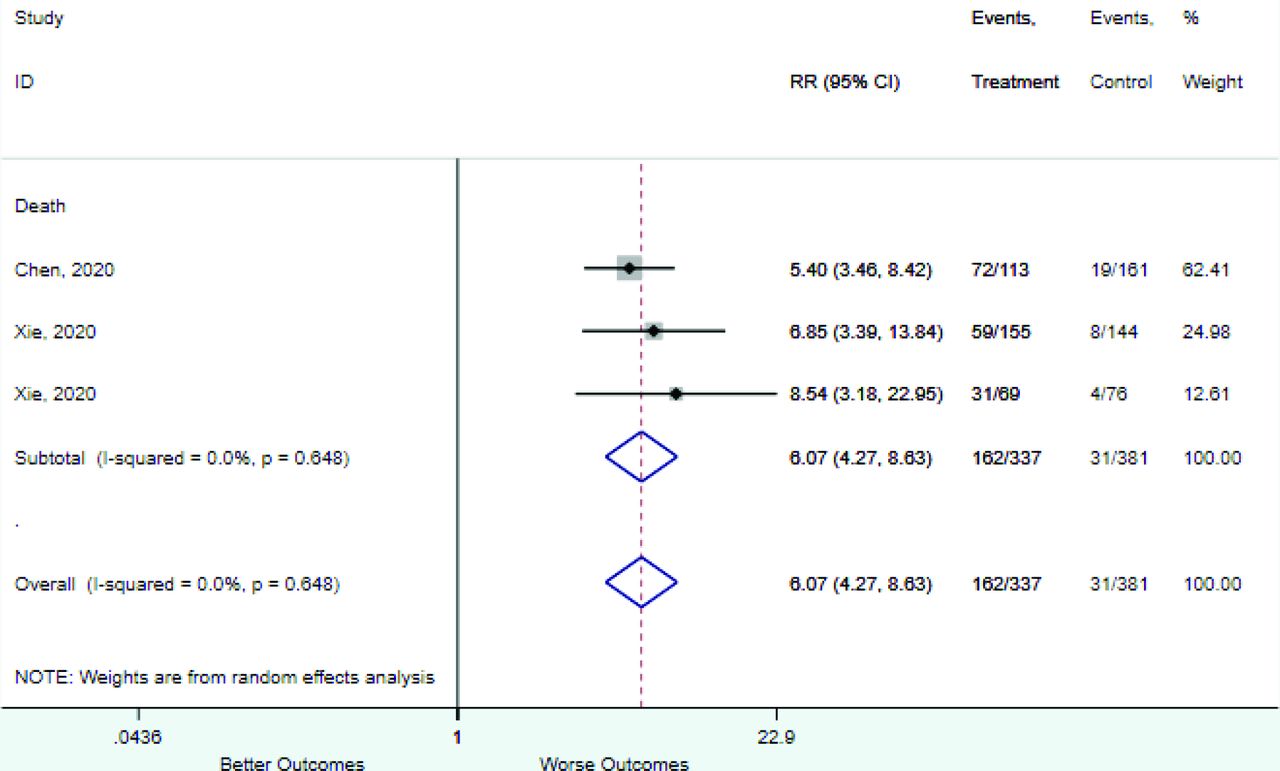
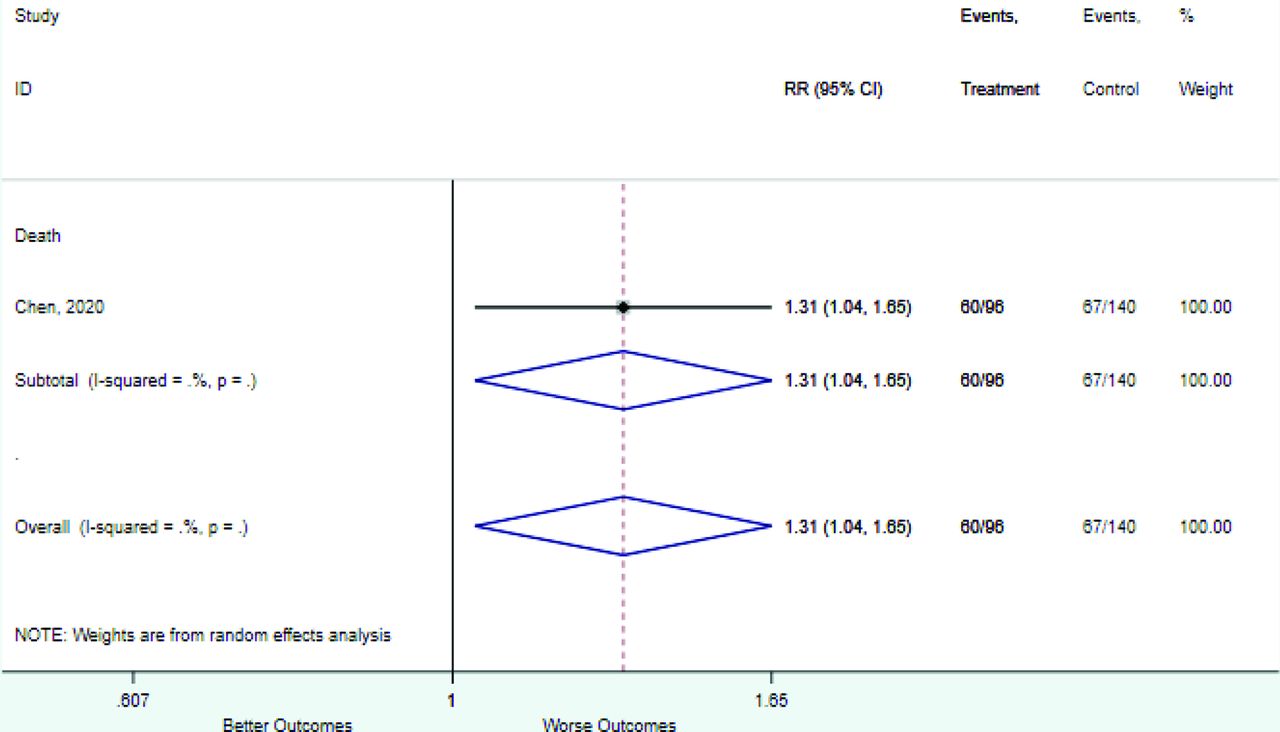
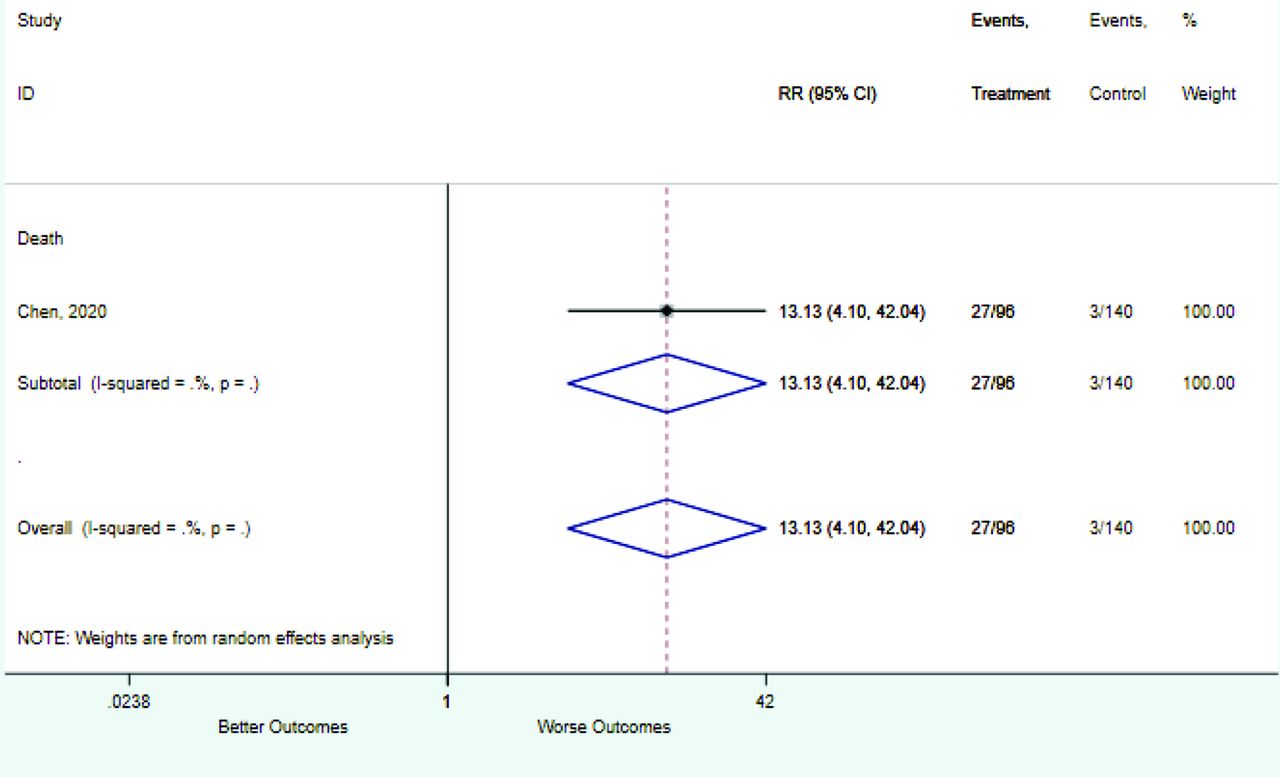
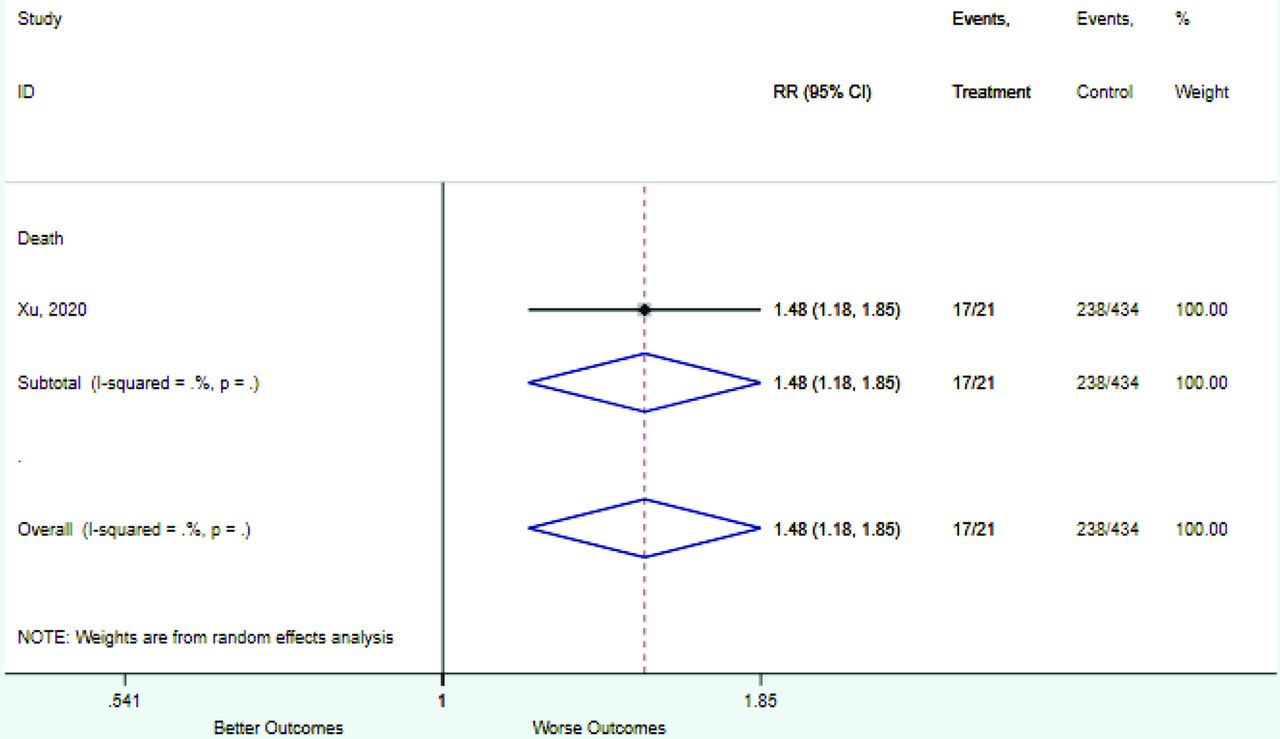
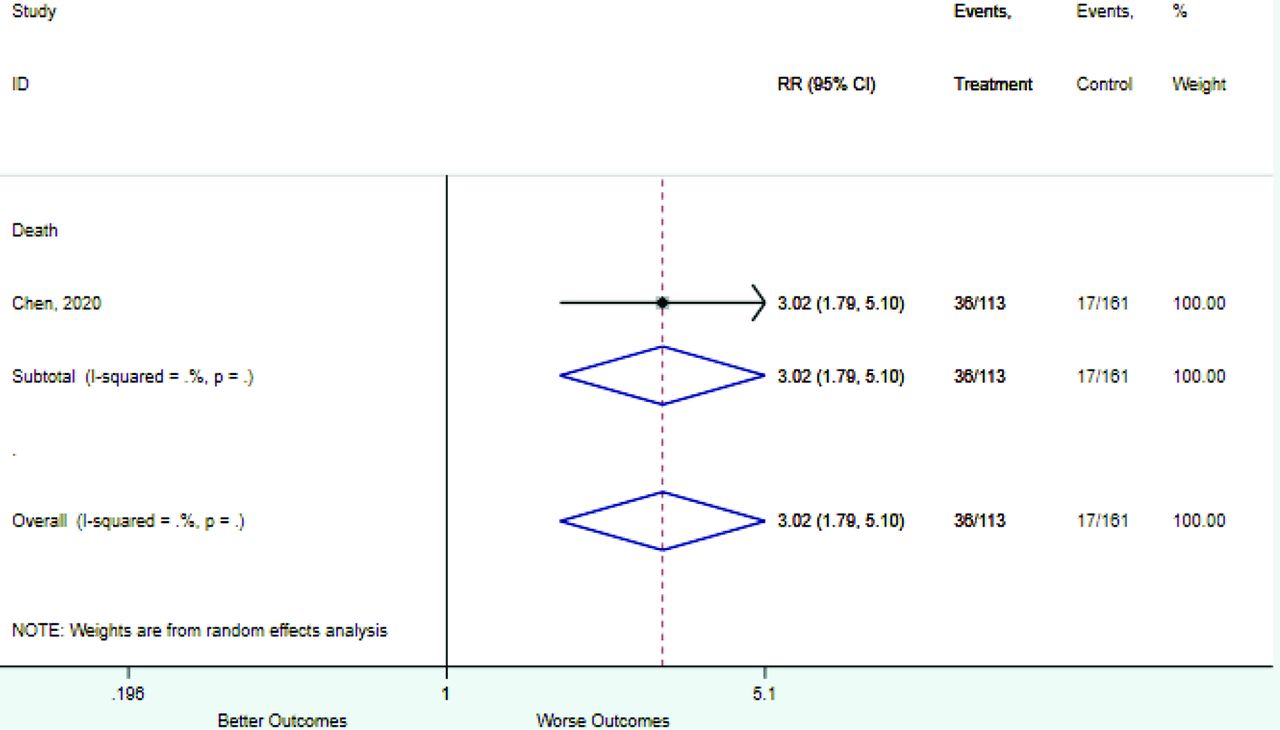
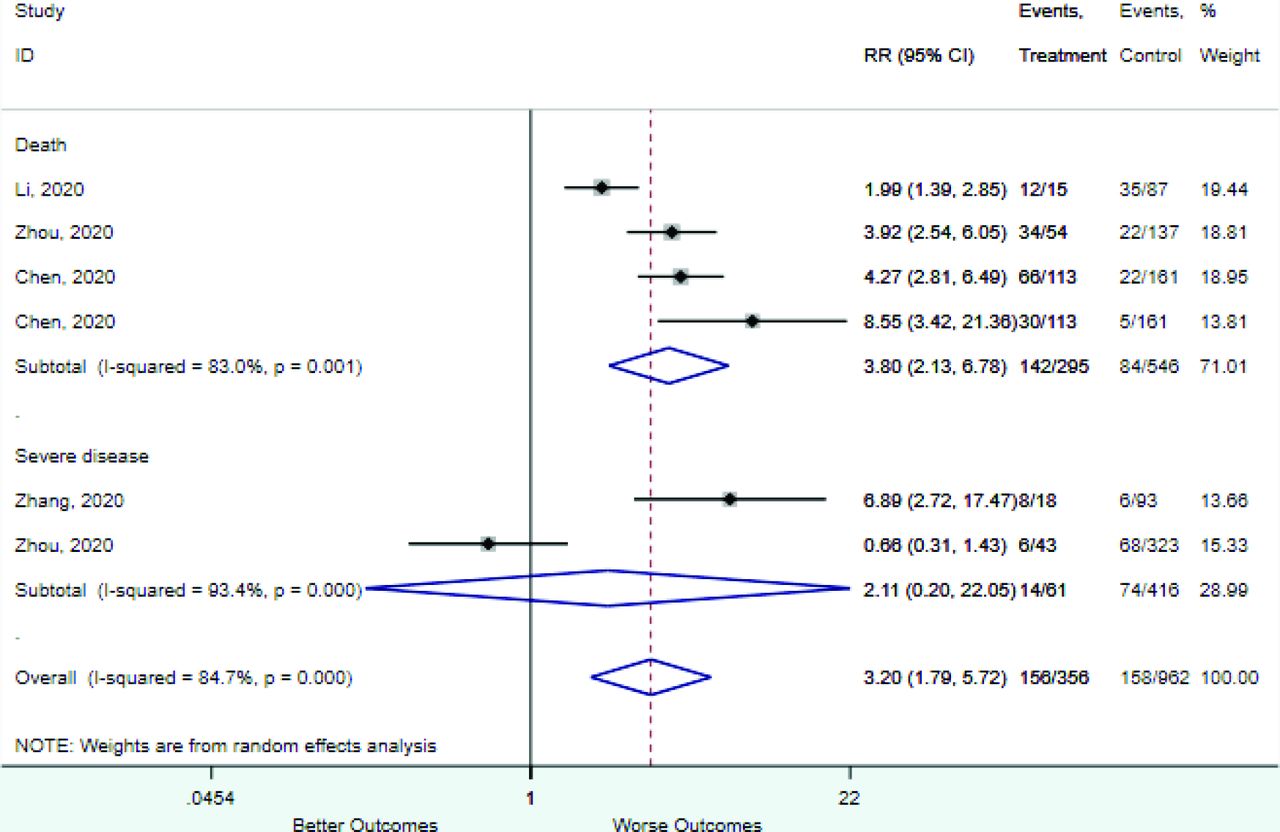
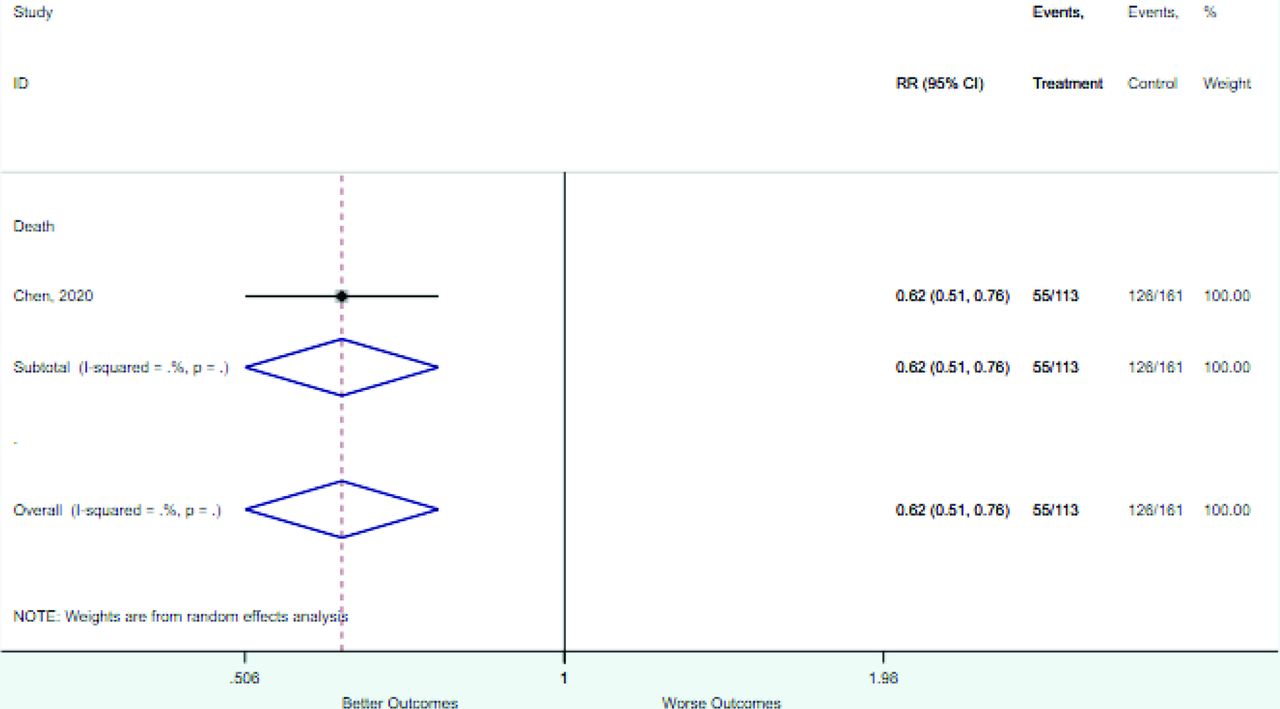
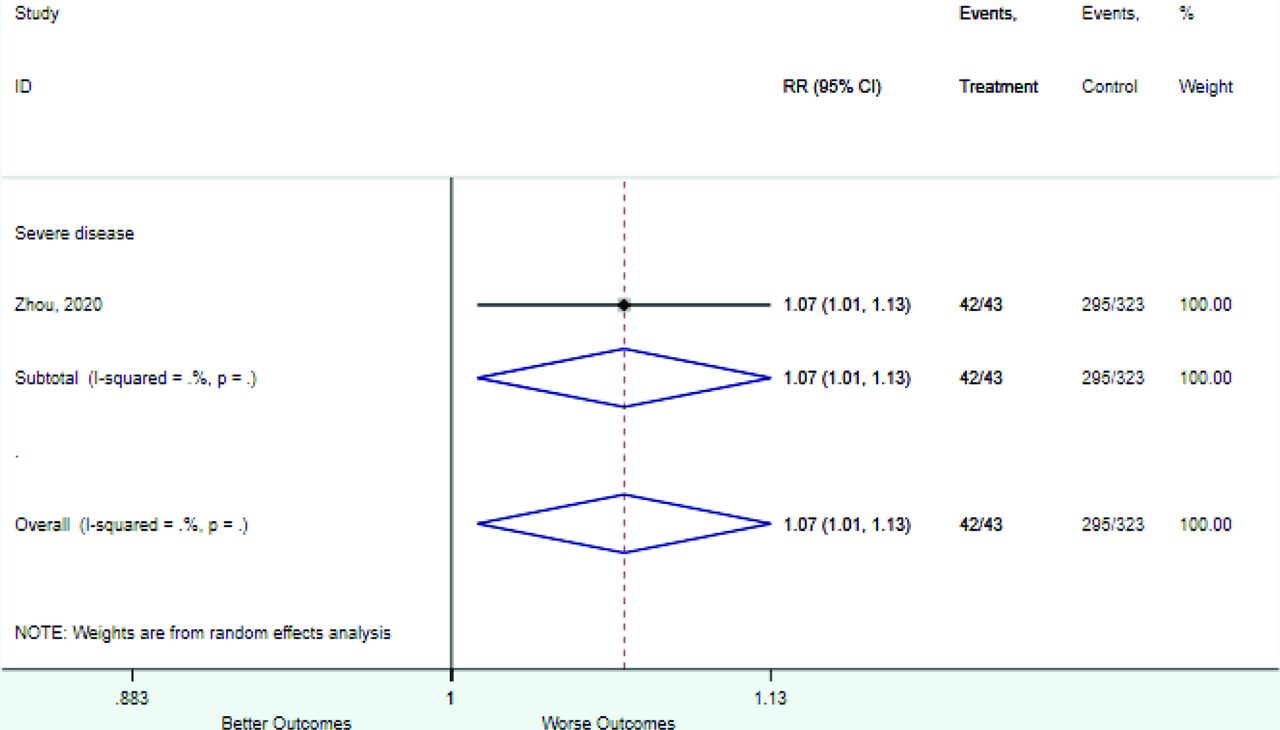
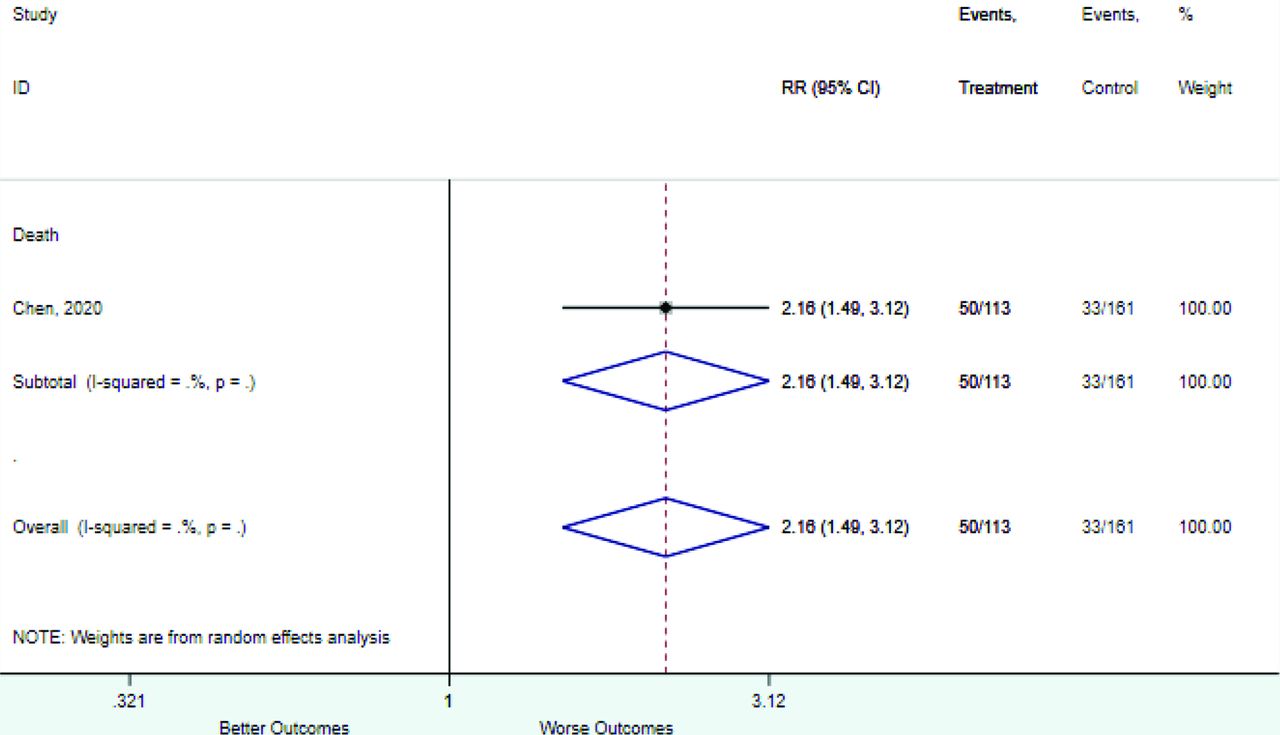
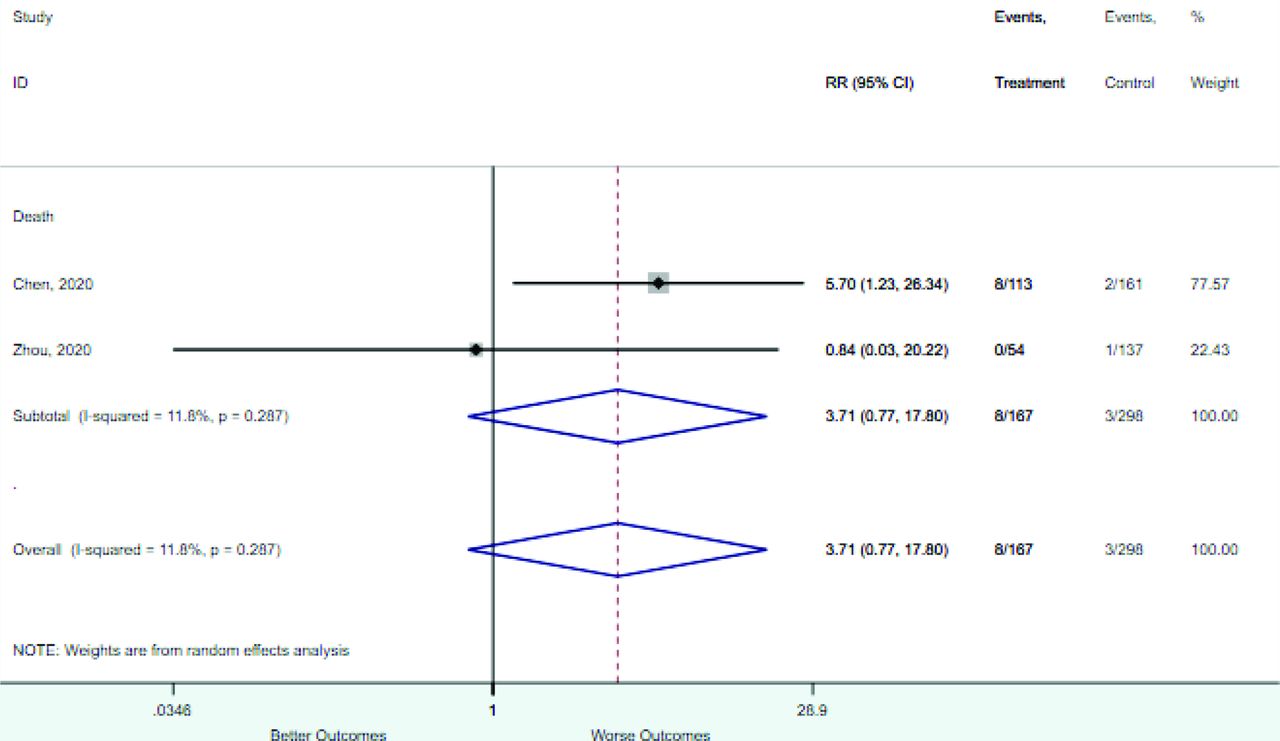
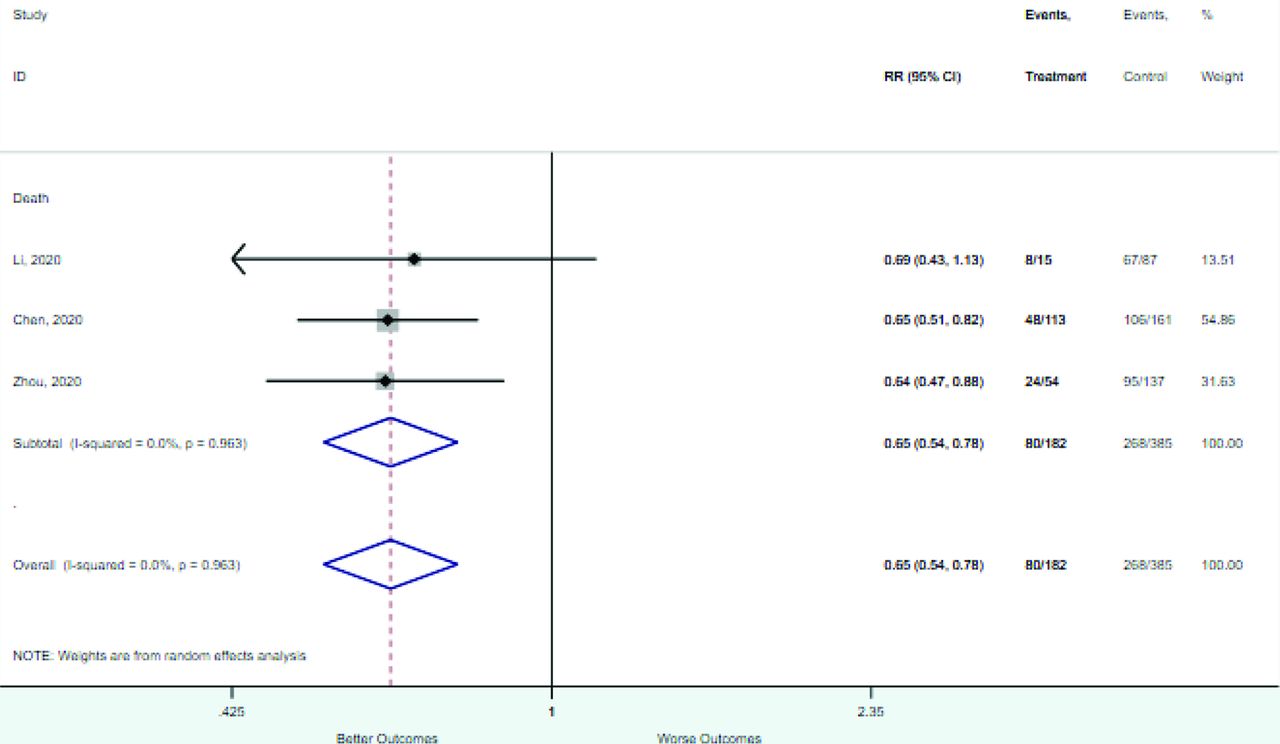
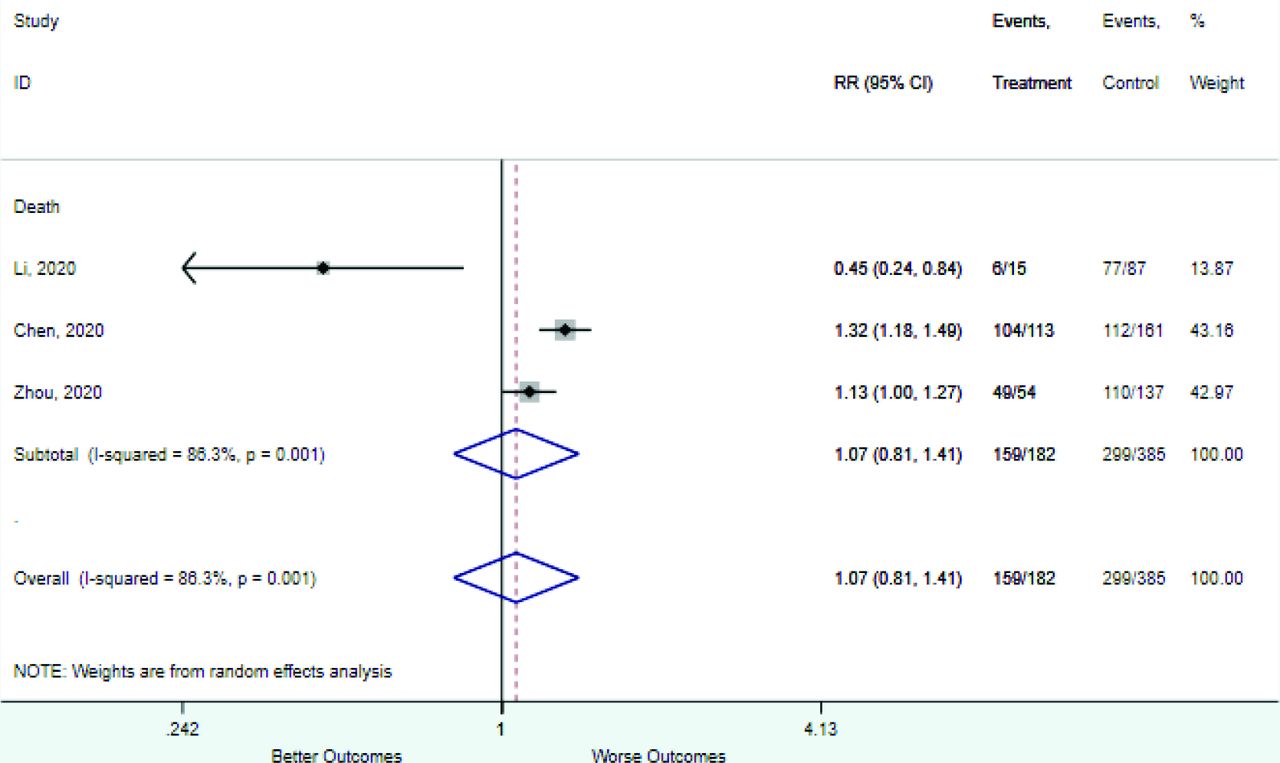
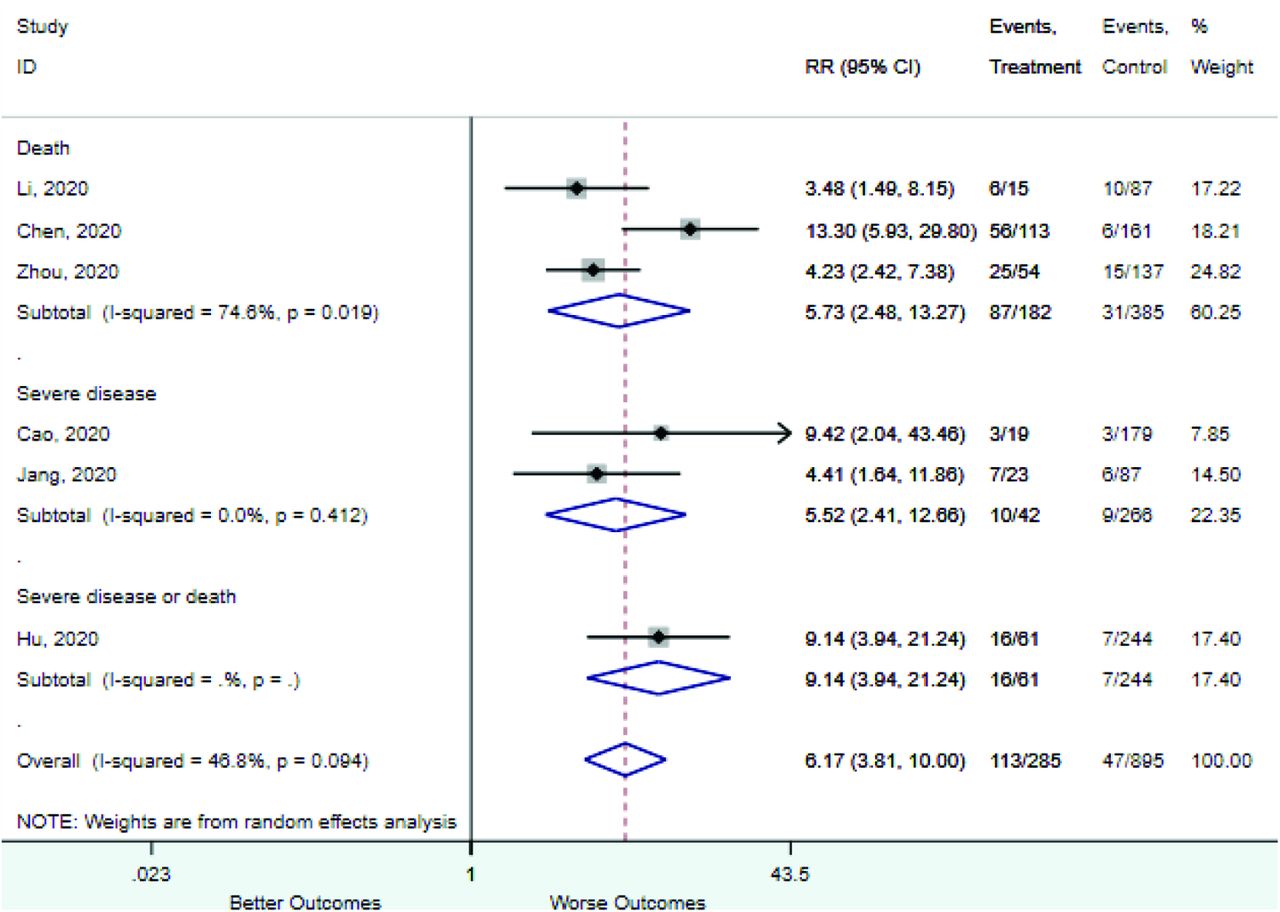
Table 2 includes summary estimates of the relative risks and their corresponding confidence intervals for each categorical risk factor reported by at least 3 studies using the same cutoff for abnormality (full data are available in Appendix B). Risk factors most strongly associated with mortality included increased procalcitonin, increased LDH, decreased oxygen saturation, the presence of dyspnea, comorbid coronary heart disease, chronic obstructive pulmonary disease and chronic kidney disease, and increased respiratory rate. Risk factors reported by at least 3 studies and most strongly associated with the outcome severe disease included the presence of dyspnea, elevated procalcitonin, and comorbid chronic heart disease and chronic kidney disease. Cough and fever were not significantly associated with any of our adverse outcomes with relative risks for all risk categories near the null. Increased white blood cell count and increased neutrophil count were most strongly associated with the outcome severe disease or death (data not shown; no risk factor for this outcome was reported by more than 2 studies).
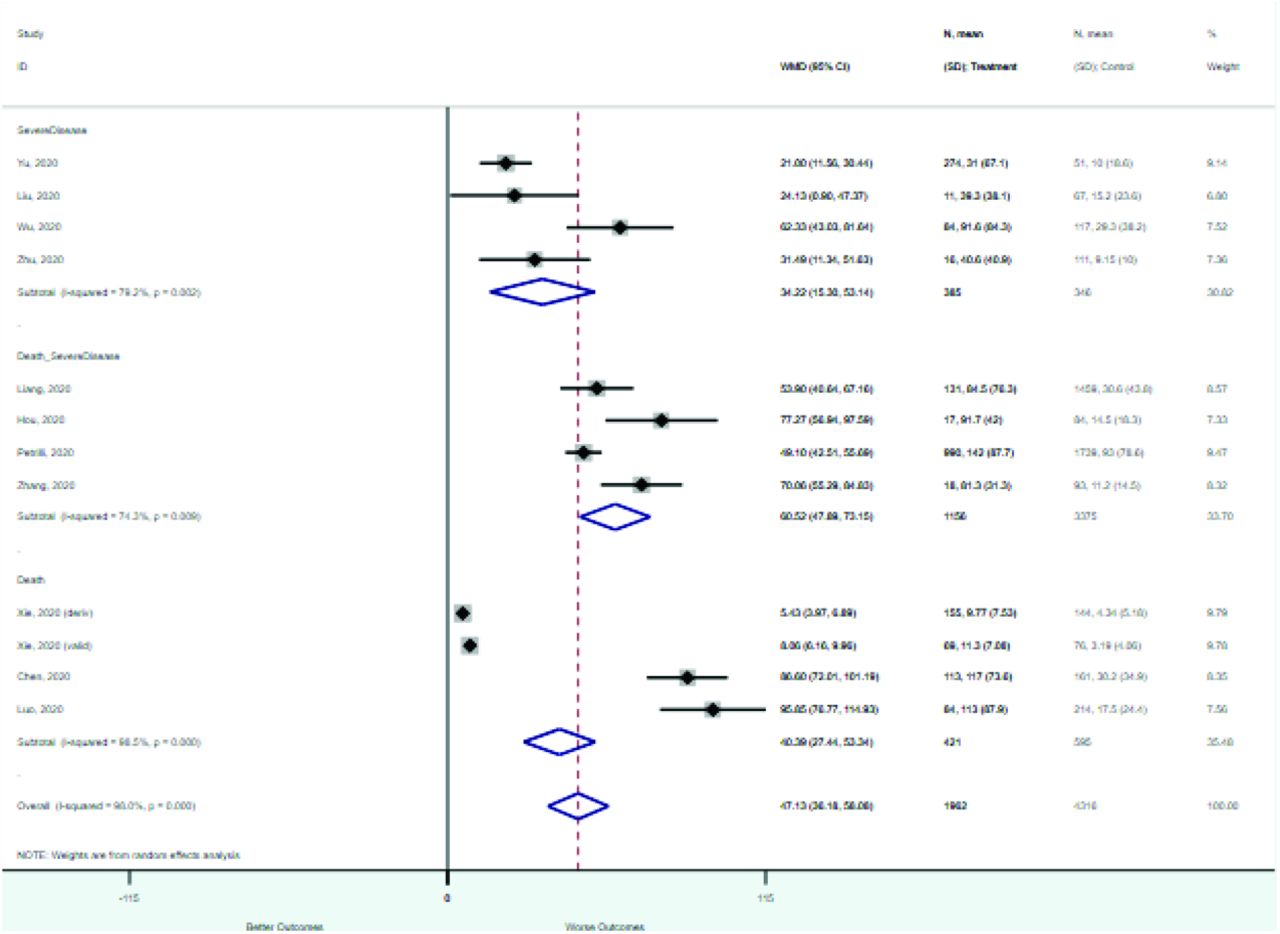
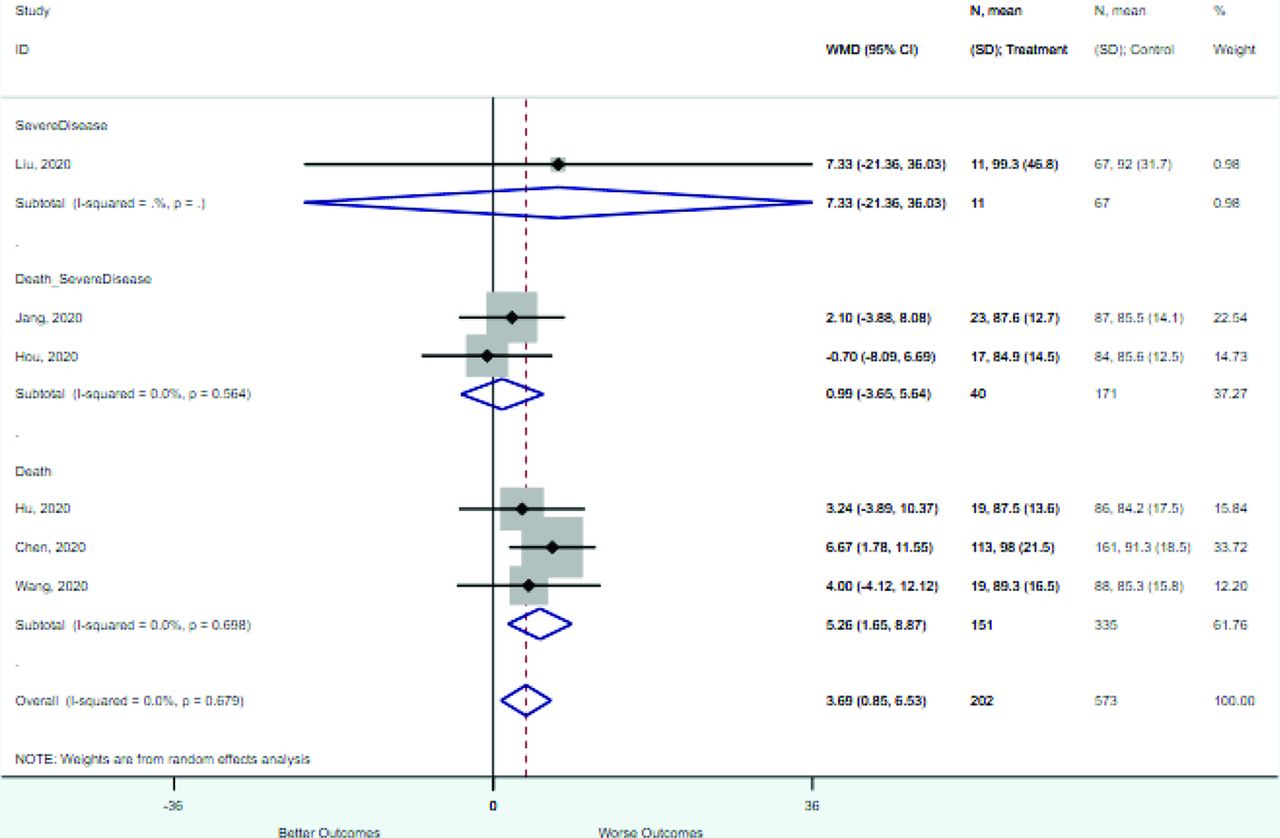
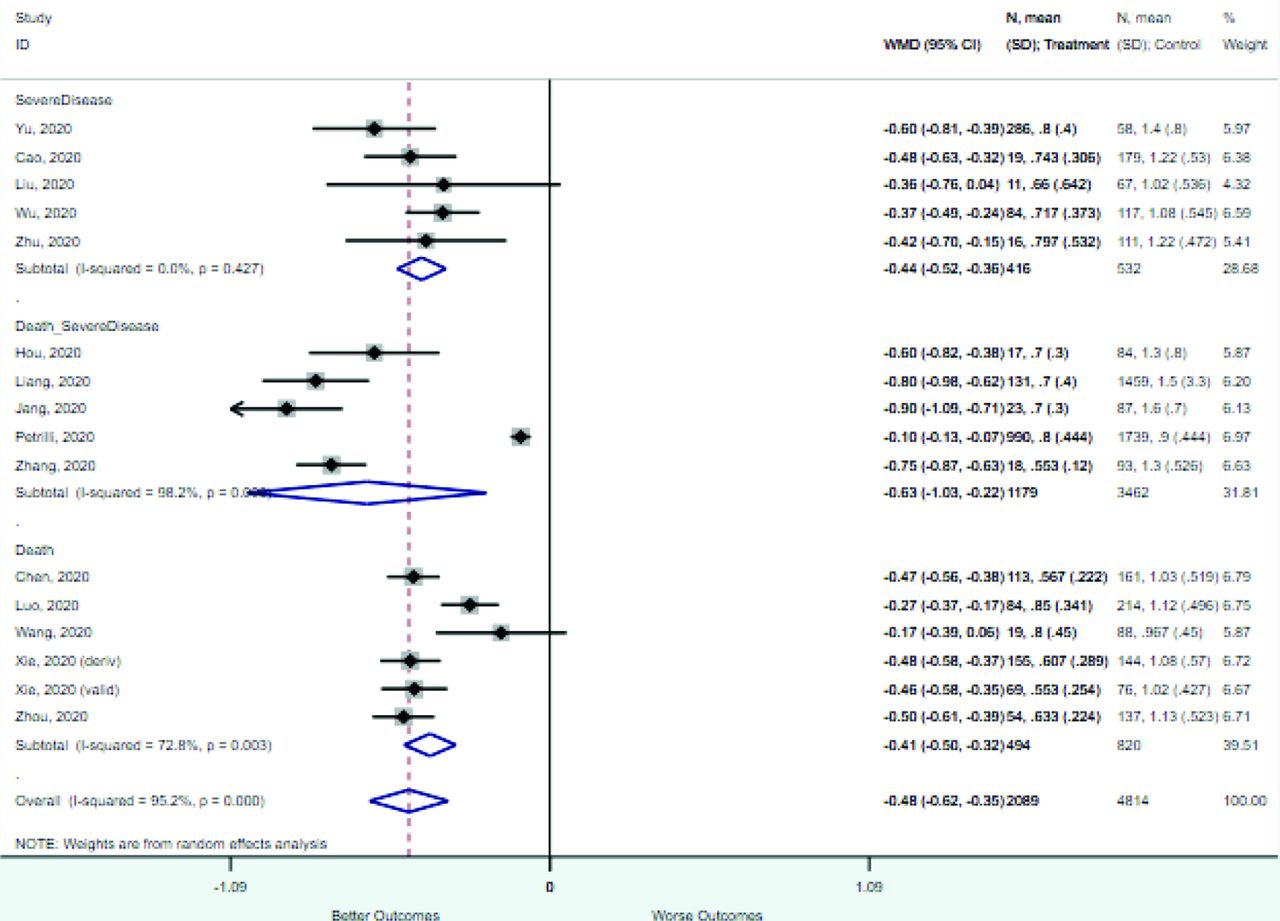
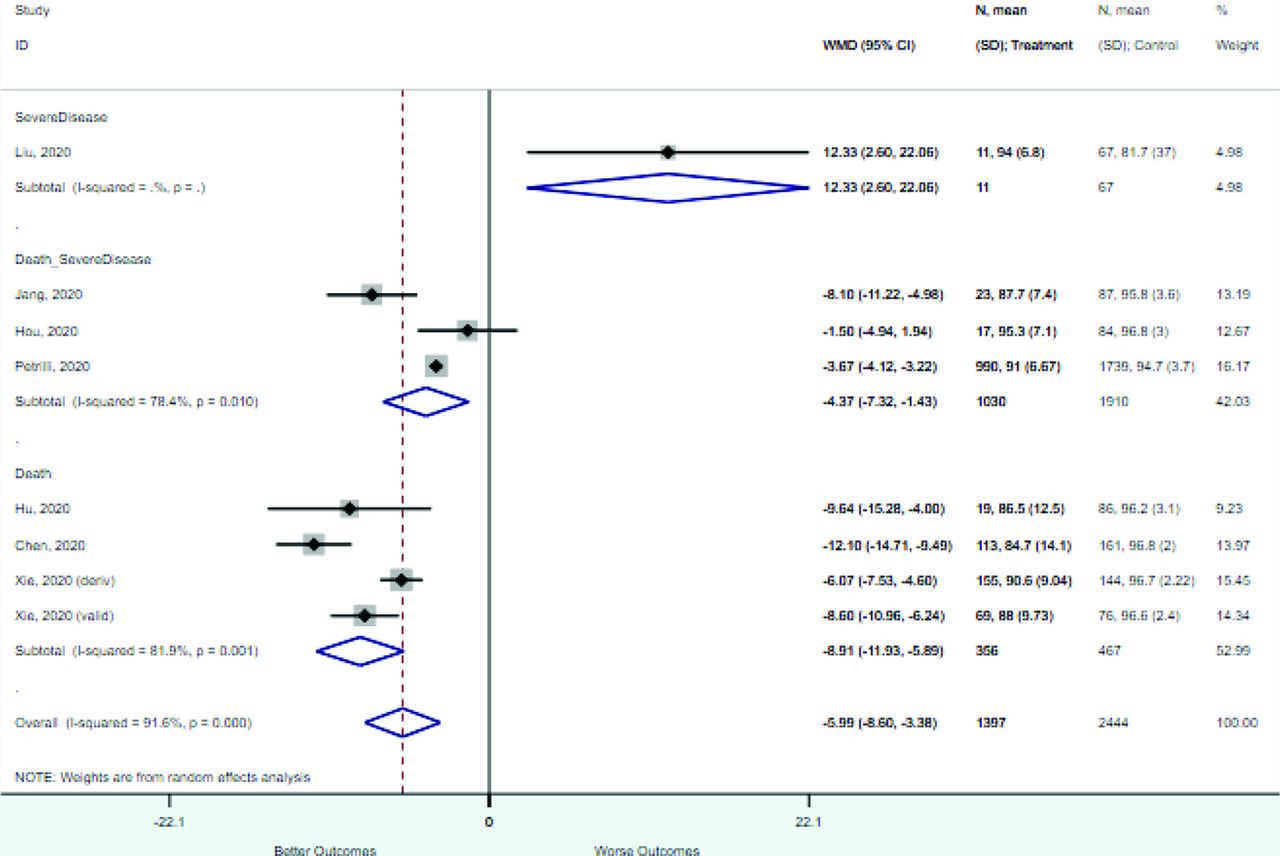
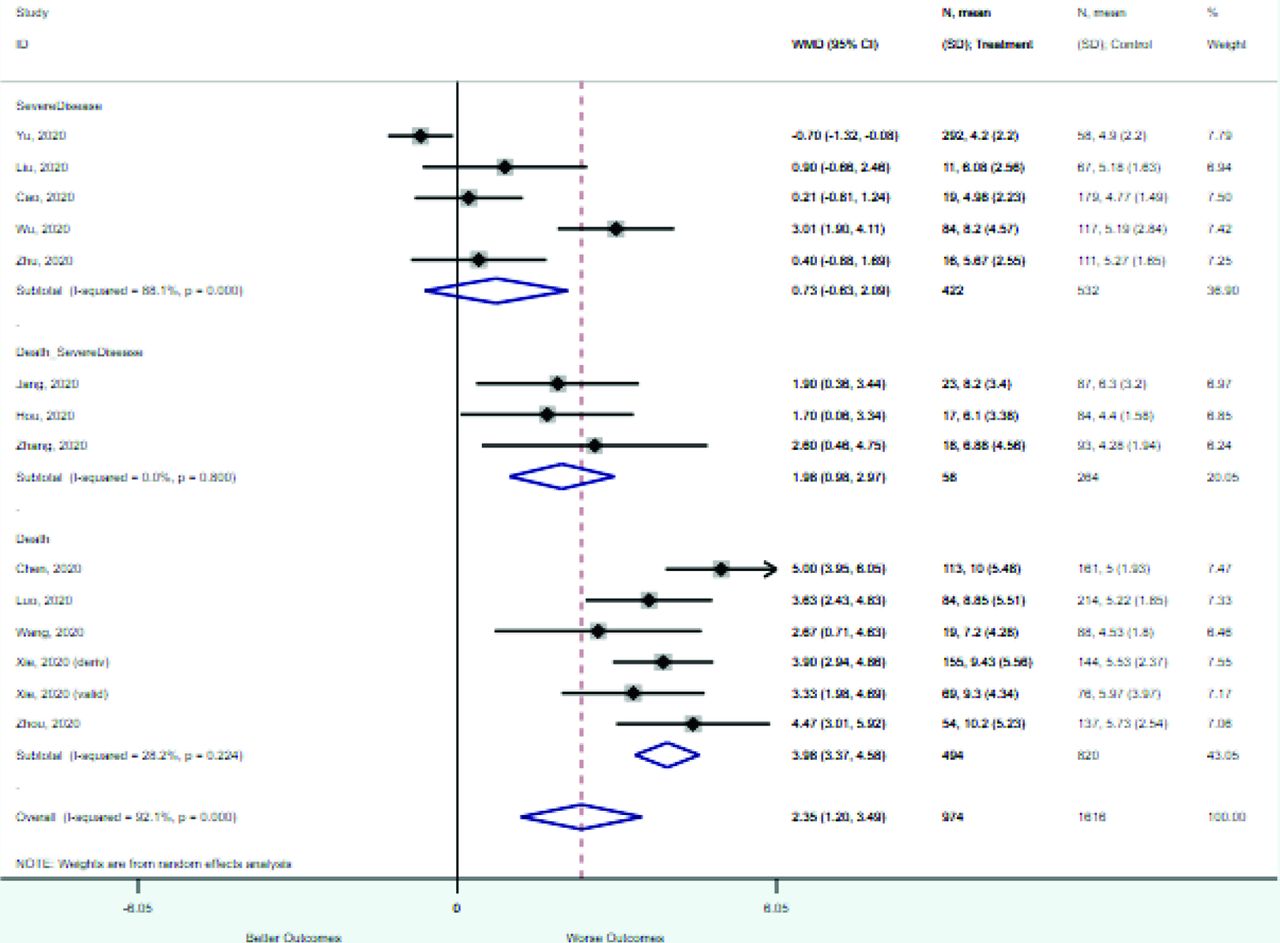
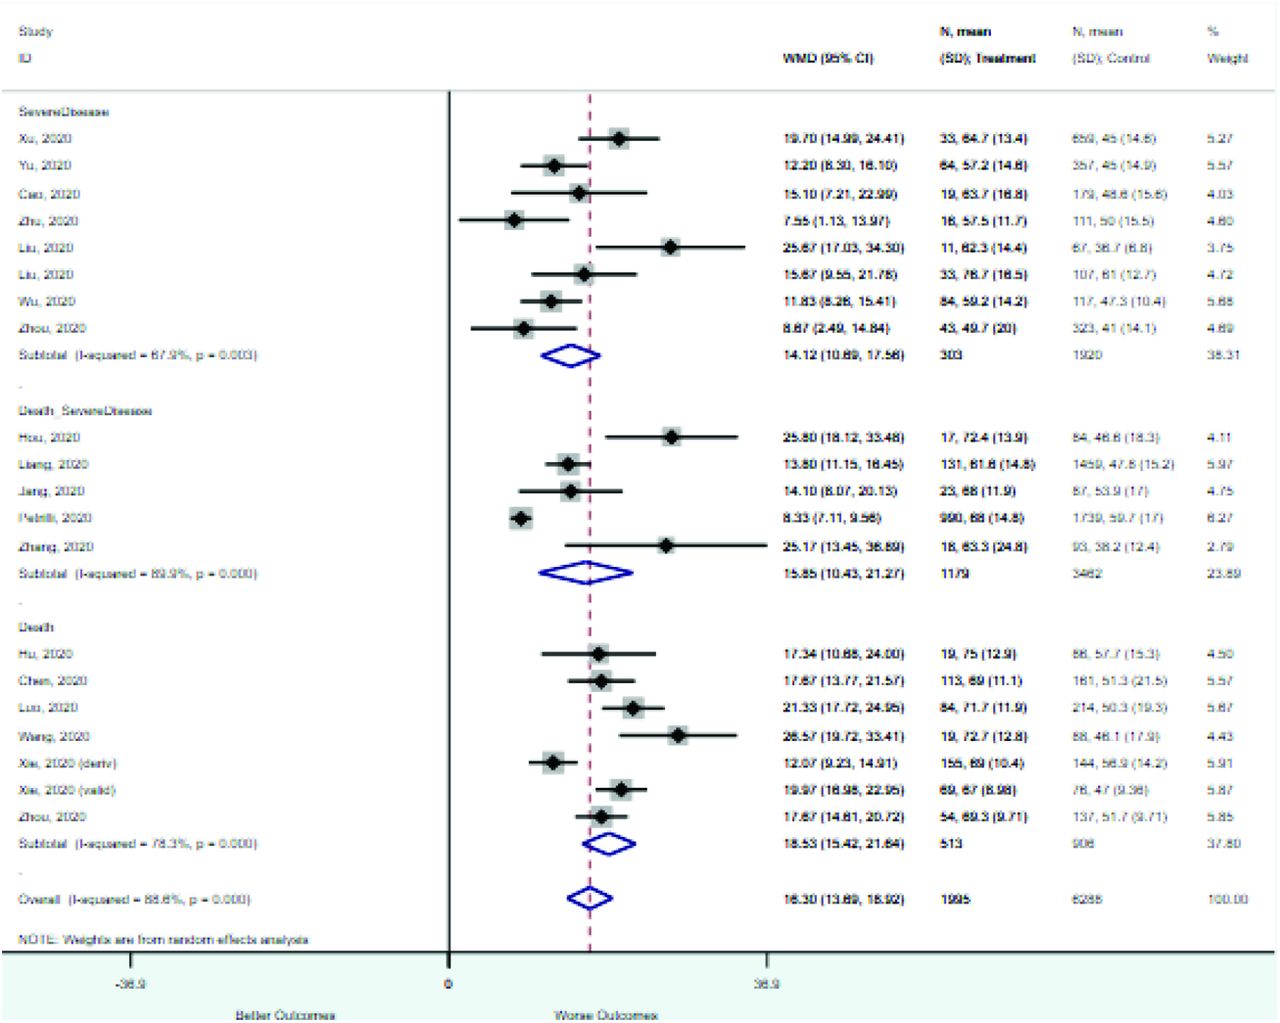
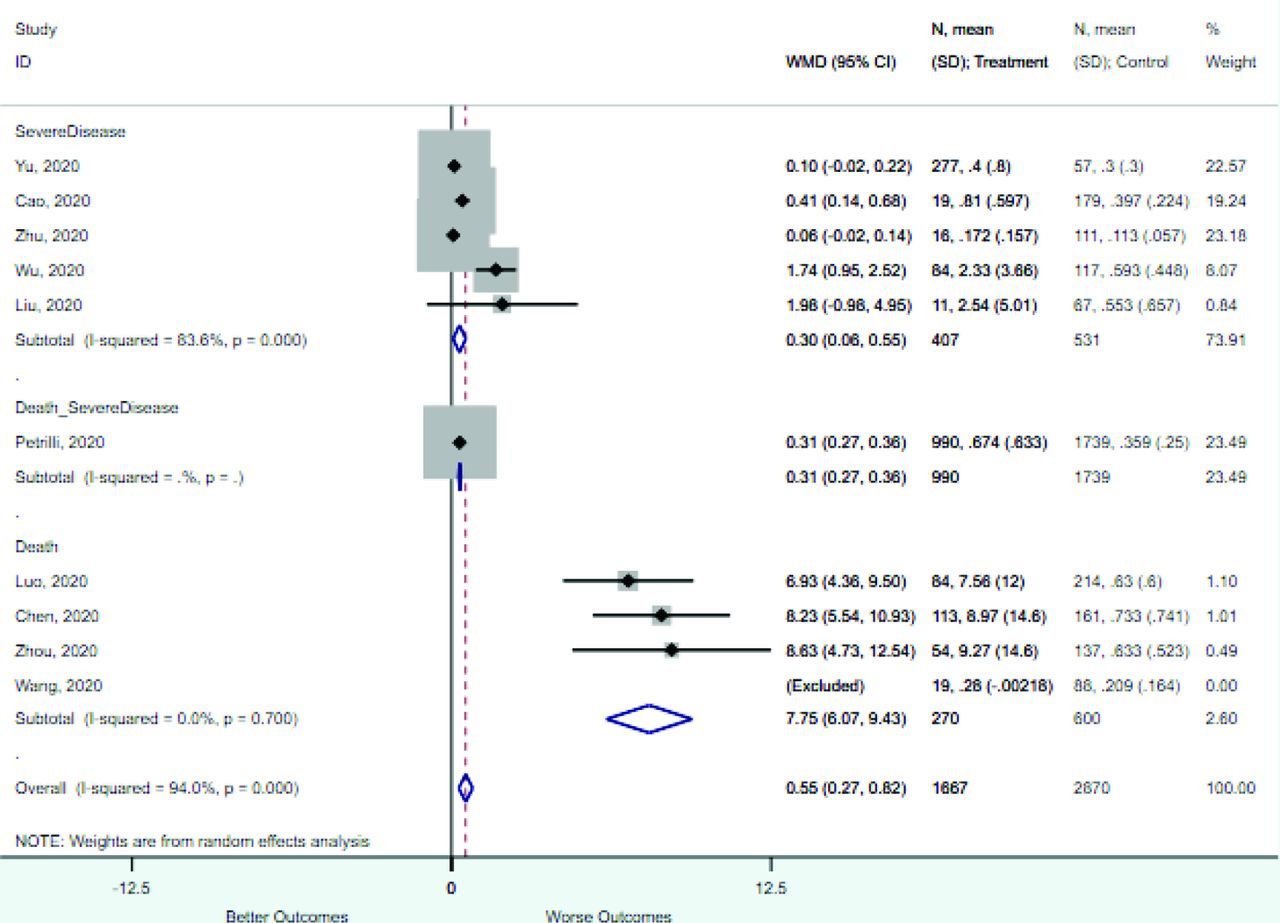
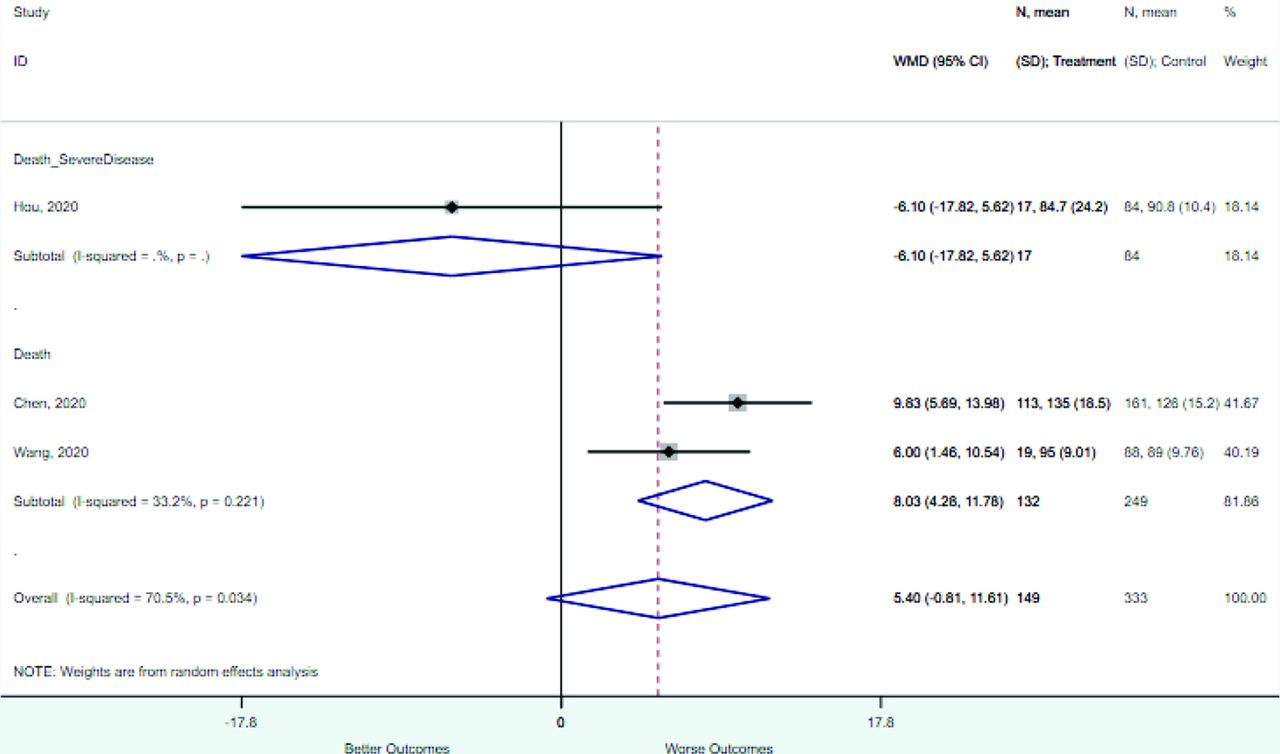
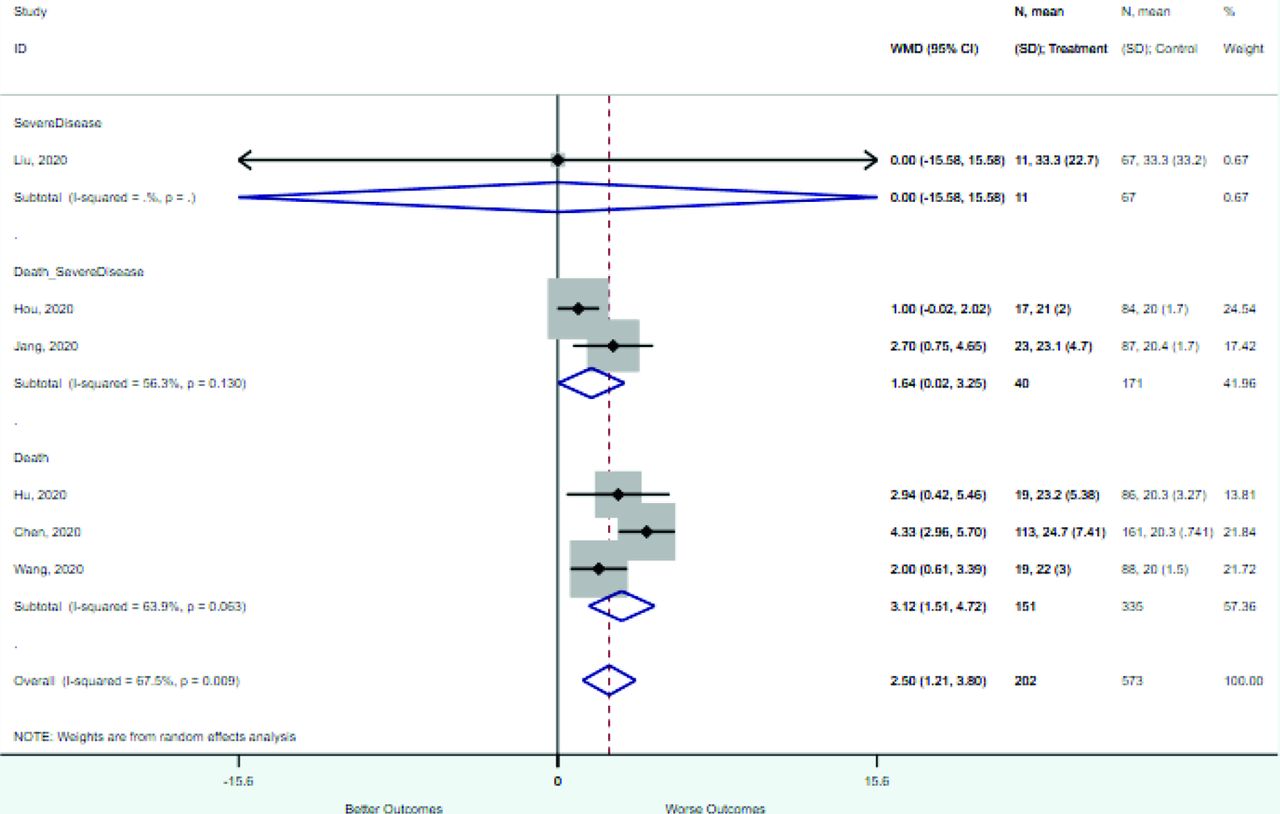
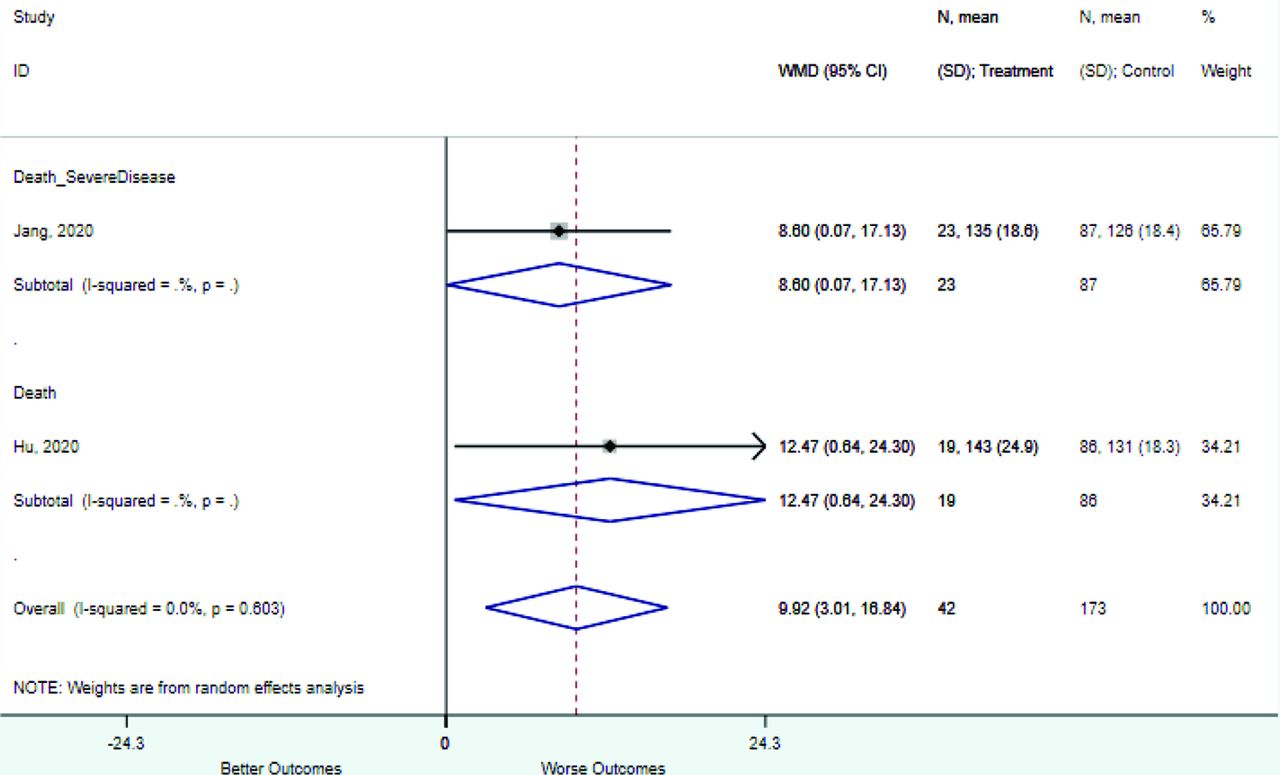
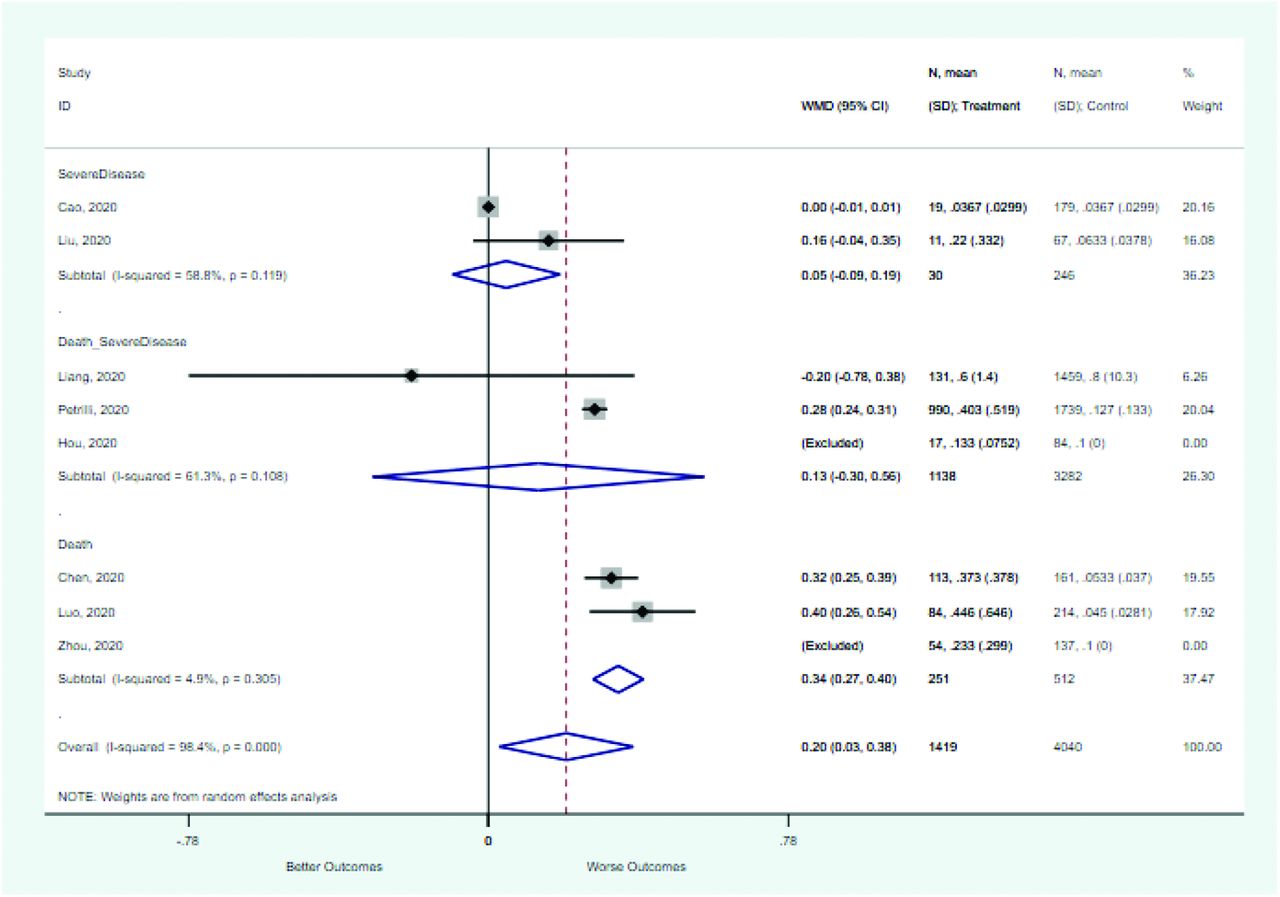
Risk factors reported as continuous variables are summarized in Table 3, showing the unstandardized weighted mean difference between patients with and without the risk factor for each risk factor. For the outcome of death, risk factors with clinically and statistically significant differences between patients dying and survivors included higher CRP, age, d-dimer, and white blood cell parameters as well as lower oxygen saturation and lymphocyte count. Risk factors that that had significantly higher values in patients with the outcome of severe disease or death included CRP, age, neutrophil count, and white blood cell count; oxygen saturation and lymphocyte count were significantly lower. For the outcome of severe disease, CRP and age were significantly higher, whereas lymphocyte count was significantly lower. Whereas d-dimer was higher, the difference was small and not clinically important. Forest plots for categorical variables are summarized in online Appendix D, and for continuous variables in online Appendix E.
Weighted Mean Differences between Patients With and Without the Outcome
Table 4 summarizes risk factors identified as independent predictors of adverse outcomes by multivariate models reported in 17 studies. Risk factors most often included in multivariate models included increasing age, increased CRP, decreased lymphocyte count, increased LDH, elevated temperature, and the presence of any comorbidity.
Summary of Variables Included in Multivariate Models to Predict an Adverse Prognosis for COVID-19
Finally, Table 5 summarizes 11 clinical prediction rules reported in the literature to date. They used a variety of approaches, including risk scores, classification trees, full models in the form of online calculators, and nomograms. Only 4 of the clinical prediction rules have been externally validated,18,19 and only 2 have been externally validated outside China (1 in the United Kingdom and 1 in France).20,21
Proposed Clinical Prediction Rules in the Medical Literature
Discussion
We have summarized the literature to date with regard to prognosis of inpatients with COVID-19, with a focus on clinical factors and tests that may be available in the outpatient or primary care setting during the initial evaluation of a patient with COVID-19. Thus, we did not abstract data regarding imaging studies or tests that are not widely available such as interleukin-6, LDH, or serum albumin. Our systematic review identified several risk factors that are consistently and strongly associated with adverse outcomes based on univariate and multivariate analyses: increasing age, increased CRP, LDH, or procalcitonin, decreased lymphocyte count, decreased oxygen saturation, dyspnea on presentation, and the presence of comorbidities. Fever and cough were not strongly associated with severe disease or mortality, perhaps because almost all hospitalized patients had these symptoms, making them less helpful for discrimination. Future research to study prognosis in the North America and Europe and develop prediction models and clinical prediction rules should include these predictors as part of their core data set. Whereas the data are limited in several ways as noted below, they represent the best evidence currently available. Greater availability of tests like CRP, d-dimer, and procalcitonin at the point of care is desired by physicians and would facilitate more efficient evaluation of patients for COVID-19 and other important conditions such as community-acquired pneumonia.13,22,23 Similarly, providing inexpensive oxygen saturation monitors to outpatients at risk for deterioration should be encouraged based on our findings.
Limitations
The studies that we identified had a number of important limitations that should be addressed by future research. These limitations can inform design of future studies of prognosis and risk models in North America and Europe. First, studies had variable definitions of serious illness. Standardization would assist in future analyses, although there is inherent subjectivity and between country variability in decisions to move a patient to the intensive care unit. The World Health Organization has identified 6 clinical severity categories for patients with COVID-19: (1) not hospitalized; (2) hospitalized, not requiring supplemental oxygen; (3) hospitalized, requiring supplemental oxygen; (4) hospitalized requiring nasal high-flow oxygen, noninvasive mechanical ventilation, or both; (5) hospitalized, requiring invasive mechanical ventilation, extracorporeal membrane oxygenation or both; and (6) death.24 For outpatients and patients being evaluated in primary care, the important clinical prediction is category 1 versus 2 or higher or possibly 1 or 2 versus 3 or higher. All the studies in our meta-analysis included only hospitalized patients, and in some cases excluded patients who had not yet died or been discharged. There was also a wide range in mortality rates, which likely reflects differences in health systems, hospital capacity, and the decision to admit as well as declining case fatality rates as treatments emerge. In addition, timing of data collection was not always clearly reported, and in 8 of 22 studies, outcome ascertainment was incomplete. Future studies should also include patients managed in the outpatient setting to identify risk factors for deterioration and later hospitalization as well as patients who are hospitalized. As the literature evolves, additional risk factors may also be identified such as red cell distribution width.25
Another limitation of the current literature is that many of the multivariate models and clinical prediction rules were quite complex, in some cases including 9–12 predictors including imaging.19,26 They also often required laboratory tests such as LDH, interleukin-6, and serum albumin that are not readily or rapidly available in outpatient settings. This places a high data collection and computational burden for those hoping to apply these tools in practice. We encourage researchers to create simpler clinical prediction rules and to provide online calculators.19 The most widely used clinical prediction rules in current clinical practice such as the Ottawa Ankle Rules,27 the Strep Score,28,29 the CURB-65 (Confusion, Urea nitrogen, Respiratory rate, Blood pressure, and 65 years),30 and the CRB-6531 require only 4 or 5 pieces of clinical information. This reduces the implementation burden and facilitates memorization. In addition, because many patients are initially evaluated in the outpatient or even telehealth settings, clinical prediction rules that require few or no laboratory tests are needed. Fourth, most of the clinical prediction rules have not been externally validated. Before implementation, clinical prediction rules require at a minimum internal validation using bootstrapping or split sample approaches, and ideally should be externally validated in a different population.
Finally, It is important that clinical prediction rules identify risk groups that are situated in the clinical context with an understanding of clinical decision making. For example, the risk score proposed by Galloway et al26 identifies a low-risk group with 12.4% mortality and a high-risk group with 40.7% mortality. Most physicians and their patients would consider both groups to be above the risk threshold for hospitalization. Similarly, Yu et al32 identify a low-risk group with 5.4% mortality and a high-risk group with 22.8% mortality. What would be more helpful was a clinical prediction rule that identified 3 or more risk groups, with the lowest-risk group clearly below the threshold for hospitalization, a moderate-risk group that might be followed closely as an outpatient with oxygen saturation monitoring or that might be hospitalized, and a high-risk group that would generally be hospitalized. More work is needed to determine these risk thresholds.
In conclusion, we have comprehensively reviewed the literature on risk factors for severe disease and mortality in COVID-19 and found it lacking. Whereas this represents the best available evidence, studies to date have been in hospitalized patients; prognostic studies are needed in the outpatient setting in which most patients are managed. Our research provides a starting point for outpatient studies, identifying several clinical variables and laboratory tests that are promising for predicting severe disease and mortality. There is a need for pragmatic clinical prediction rules with a low burden of data collection to identify patients who are at low, moderate, or high risk for severe disease or death to guide decision making in the outpatient and primary care settings. In addition, as more data are published in both inpatient and outpatient settings, it will also be important to update systematic reviews like this one. Because of their usefulness in determining prognosis, tests such as c-reactive protein, d-dimer, and procalcitonin should be made available and studied in outpatient settings, and home monitoring of oxygen saturation should be offered to identify patients at risk for a poor outcome.
Appendices
Appendix A: Search Strategy
(“betacoronavirus”[mh] OR “coronavirus”[tiab] OR “corona-virus”[tiab] OR “COVID-19”[tiab] OR “COVID19”[tiab] OR “2019-nCoV”[tiab] OR “nCoV”[tiab] OR “SARS-CoV-2”[tiab] OR “SARSCOV2”[tiab] OR “2019-nCov”[tiab] OR “2019 coronavirus”[tiab] OR “novel coronavirus”[tiab]) AND (“risk factor”[tiab] OR “validation”[tiab] OR “prediction rule”[tiab] OR “clinical prediction”[tiab] OR “risk model”[tiab] OR “prediction model”[tiab] OR “prognosis”[tiab] OR “prognostic”[tiab] OR “Predictive value of tests”[mh] OR “prognosis”[mh] OR “prognosis”[mh])
Appendix B: Evaluation of Study Quality Using the Quality of Prognostic Studies Tool
Study Quality Assessment Using the Quality of Prognostic Studies Tool
Appendix C: Full Data Set
Association between categorical variables and mortality, severe disease, or both in patients with COVID-19
Association between Continuous Variables and Mortality, Severe Disease, or Both in Patients with COVID-19: Full Data Set
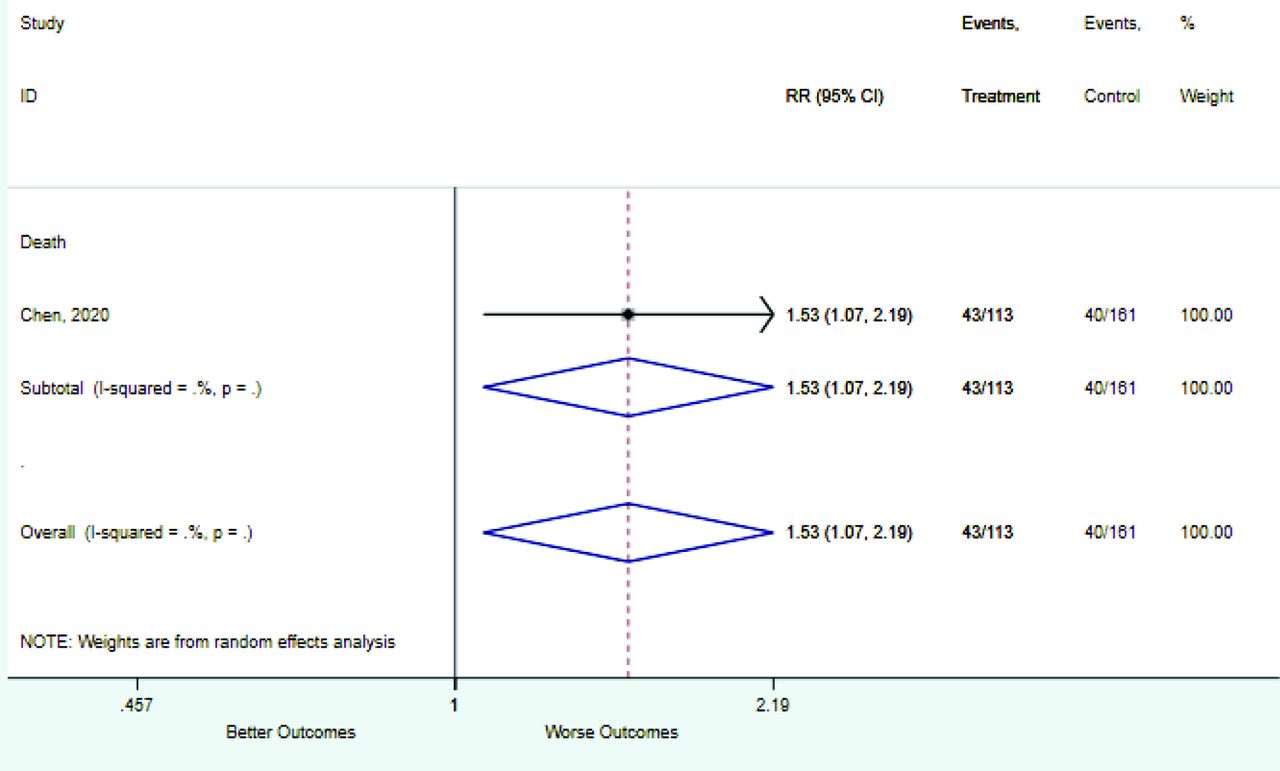
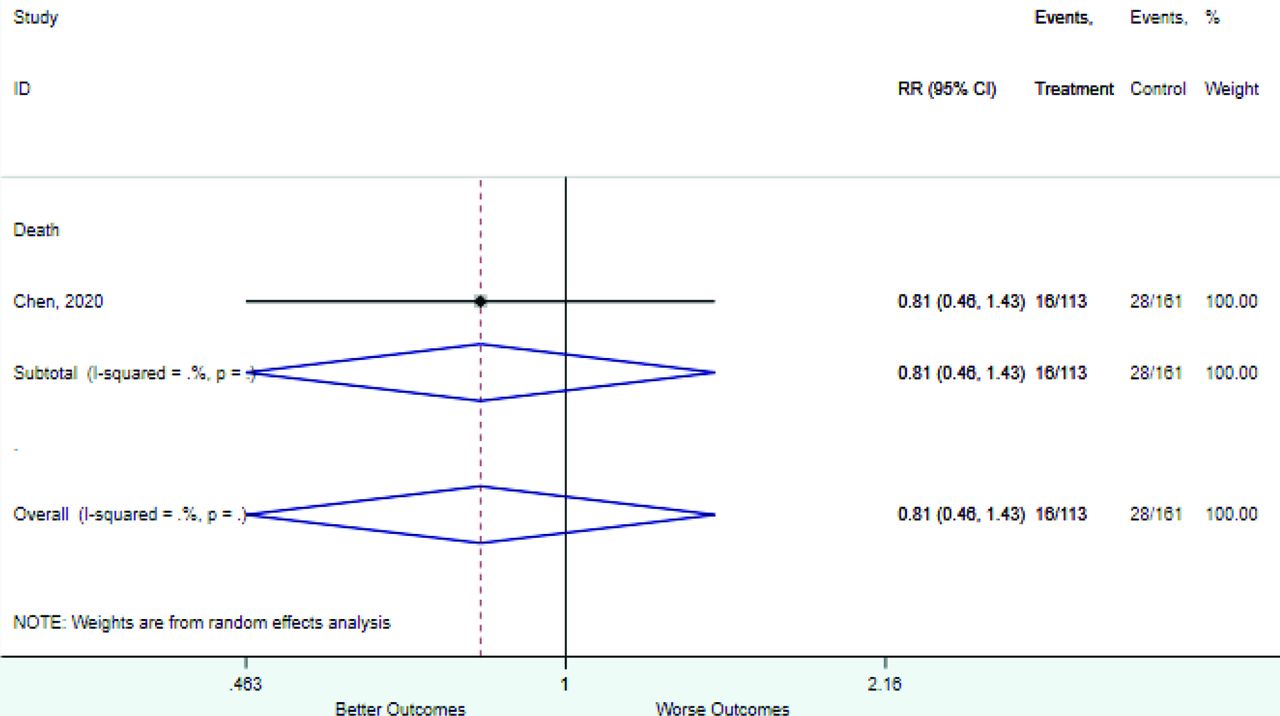
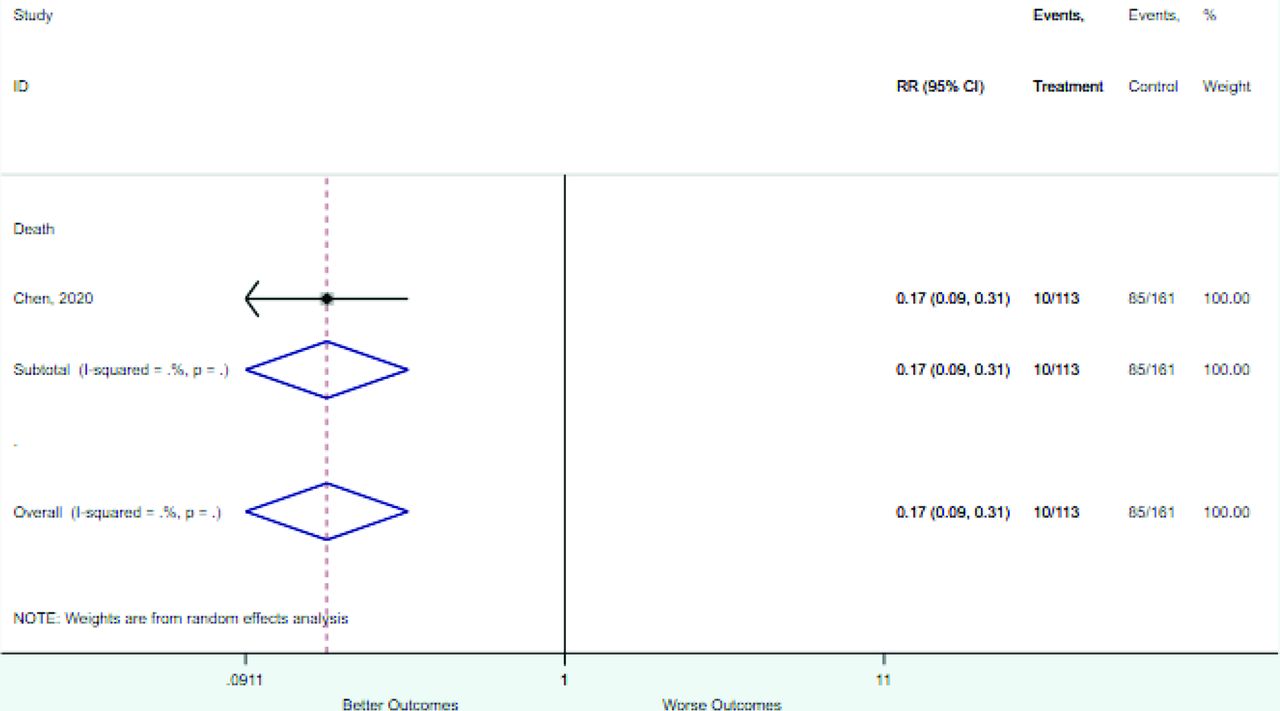
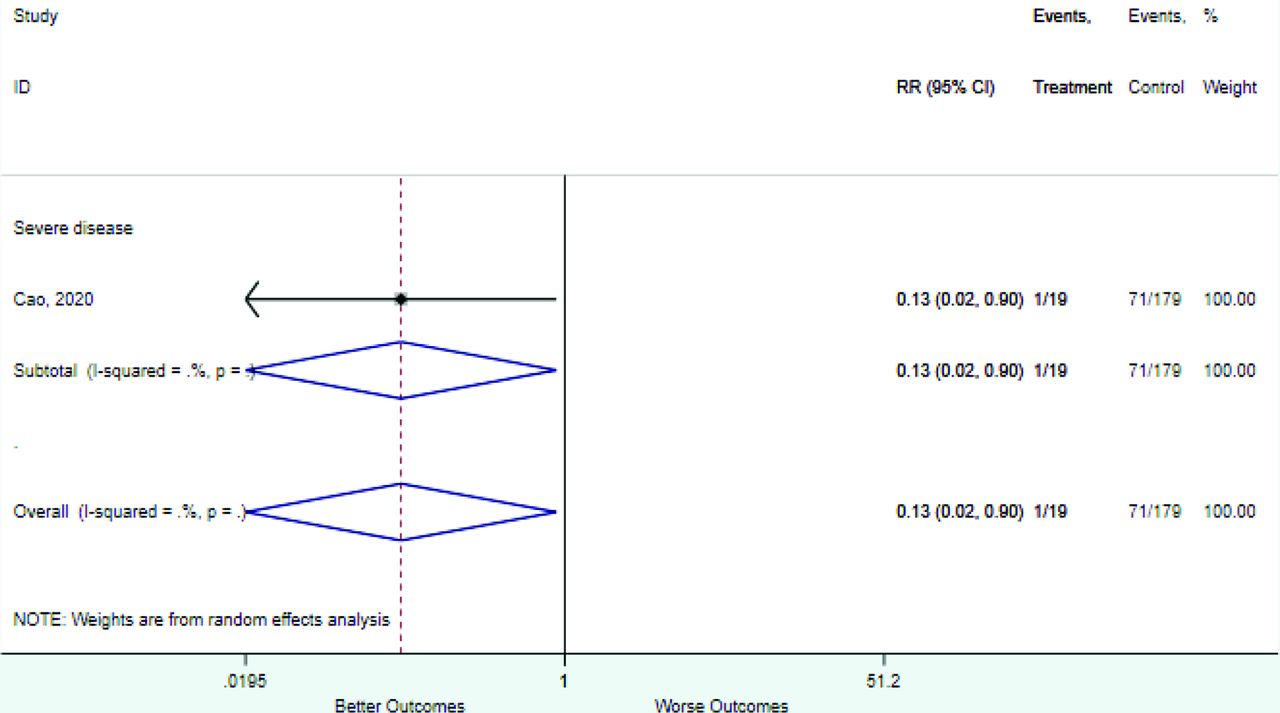
Appendix D. Forest Plots (Full List) for Categorical Variables
Age 40–49 years
Age 40–60 years
Age 45–59 years

Age 50–59 years

Age 60–69 years
Age 60 to 75 years
Age ≥40 years
Age ≥50 years
Age ≥60 to 65 years
Age ≥70 years
Age >45 years

Age >75 years

Age <39 to 40 years

Age <45 years

Any comorbidity
Asthma or COPD
COPD

Cough

CRP ≥3

CRP ≥5 to 10

CRP ≥100

CRP increased
D-dimer 0.5–1.0

D-dimer ≥0.5

D-dimer ≥1.0
D-dimer >21

D-dimer increased

D-dimer ≤0.5

Diabetes

Dyspnea

Fever
Heart disease

Heart rate ≥90
Heart rate ≥125
Heart rate >100

Hypertension

Kidney disease
LDH increased

Lymphocyte 0.5–0.8

Lymphocyte 0.8–1.0

Lymphocyte ≥ 1.0

Lymphocyte >3.2

Lymphocyte <0.5

Lymphocyte <0.8 to 1.1

Lymphocyte <2.0

Lymphocytes decreased
Male sex

Neutrophil >6.3
Neutrophil >7.5
Neutrophil <1.8

Neutrophils increased
Oxygen saturation <88

Oxygen saturation <90 to 93

Oxygen saturation <96

Procalcitonin 0.05–0.5
Procalcitonin 0.5–2.0

Procalcitonin ≥0.1 to 0.25

Procalcitonin ≥0.25 to 0.5

Procalcitonin ≥2.0
Procalcitonin >0.05
Procalcitonin increased

Procalcitonin <0.1

Procalcitonin <0.05
Respiratory rate 24–30
Respiratory rate >20 to 30

Respiratory rate <24

SBP 90–140

SBP ≥110

SBP ≥140

SBP <90

Troponin >34.2

WBC 4–10

WBC ≥4

WBC ≥9.5 to 10

WBC increased

WBC <3.5 to 4.0
COPD = chronic obstructive pulmonary disease; CRP, c-reactive protein; LDH, lactate dehydrogenase; WBC, white blood count; SBP, systolic blood pressure.

Appendix E. Forest Plots (Full List) for Continuous Variables
Age

CRP

D-dimer

Heart rate
Lymphocyte count

Mean arterial pressure
Oxygen saturation
Procalcitonin

Respiratory rate
Systolic blood pressure

WBC count


COPD = chronic obstructive pulmonary disease.
Notes
This article was externally peer reviewed.
Conflict of interest: None.
Funding: None.
Contributions of authors: The study was conceived and designed by MHE; CH and MB performed the search and summarized the data, supervised by MHE; initial analysis and interpretation of the data were done by CH and MB, supervised by MHE; manuscript was drafted by MHE, critical revision of the manuscript for important intellectual content by MB and CH.
To see this article online, please go to: http://jabfm.org/content/34/Supplement/S113.full.
- Received for publication August 12, 2020.
- Revision received October 22, 2020.
- Accepted for publication October 28, 2020.
References
In this issue


Jump to section
Related Articles
Cited By...
- Prospective Validation of a Simple Risk Score to Predict Hospitalization during the Omicron Phase of COVID-19
- Prognostic accuracy of triage tools for adults with suspected COVID-19 in a prehospital setting: an observational cohort study
- COVID-19 outcomes among adult patients treated with long-term opioid therapy for chronic non-cancer pain in the USA: a retrospective cohort study
- Gene Expression Risk Scores for COVID-19 Illness Severity
- Primary Care in the COVID-19 Pandemic: Essential, and Inspiring