
Article Figures & Data
Figures
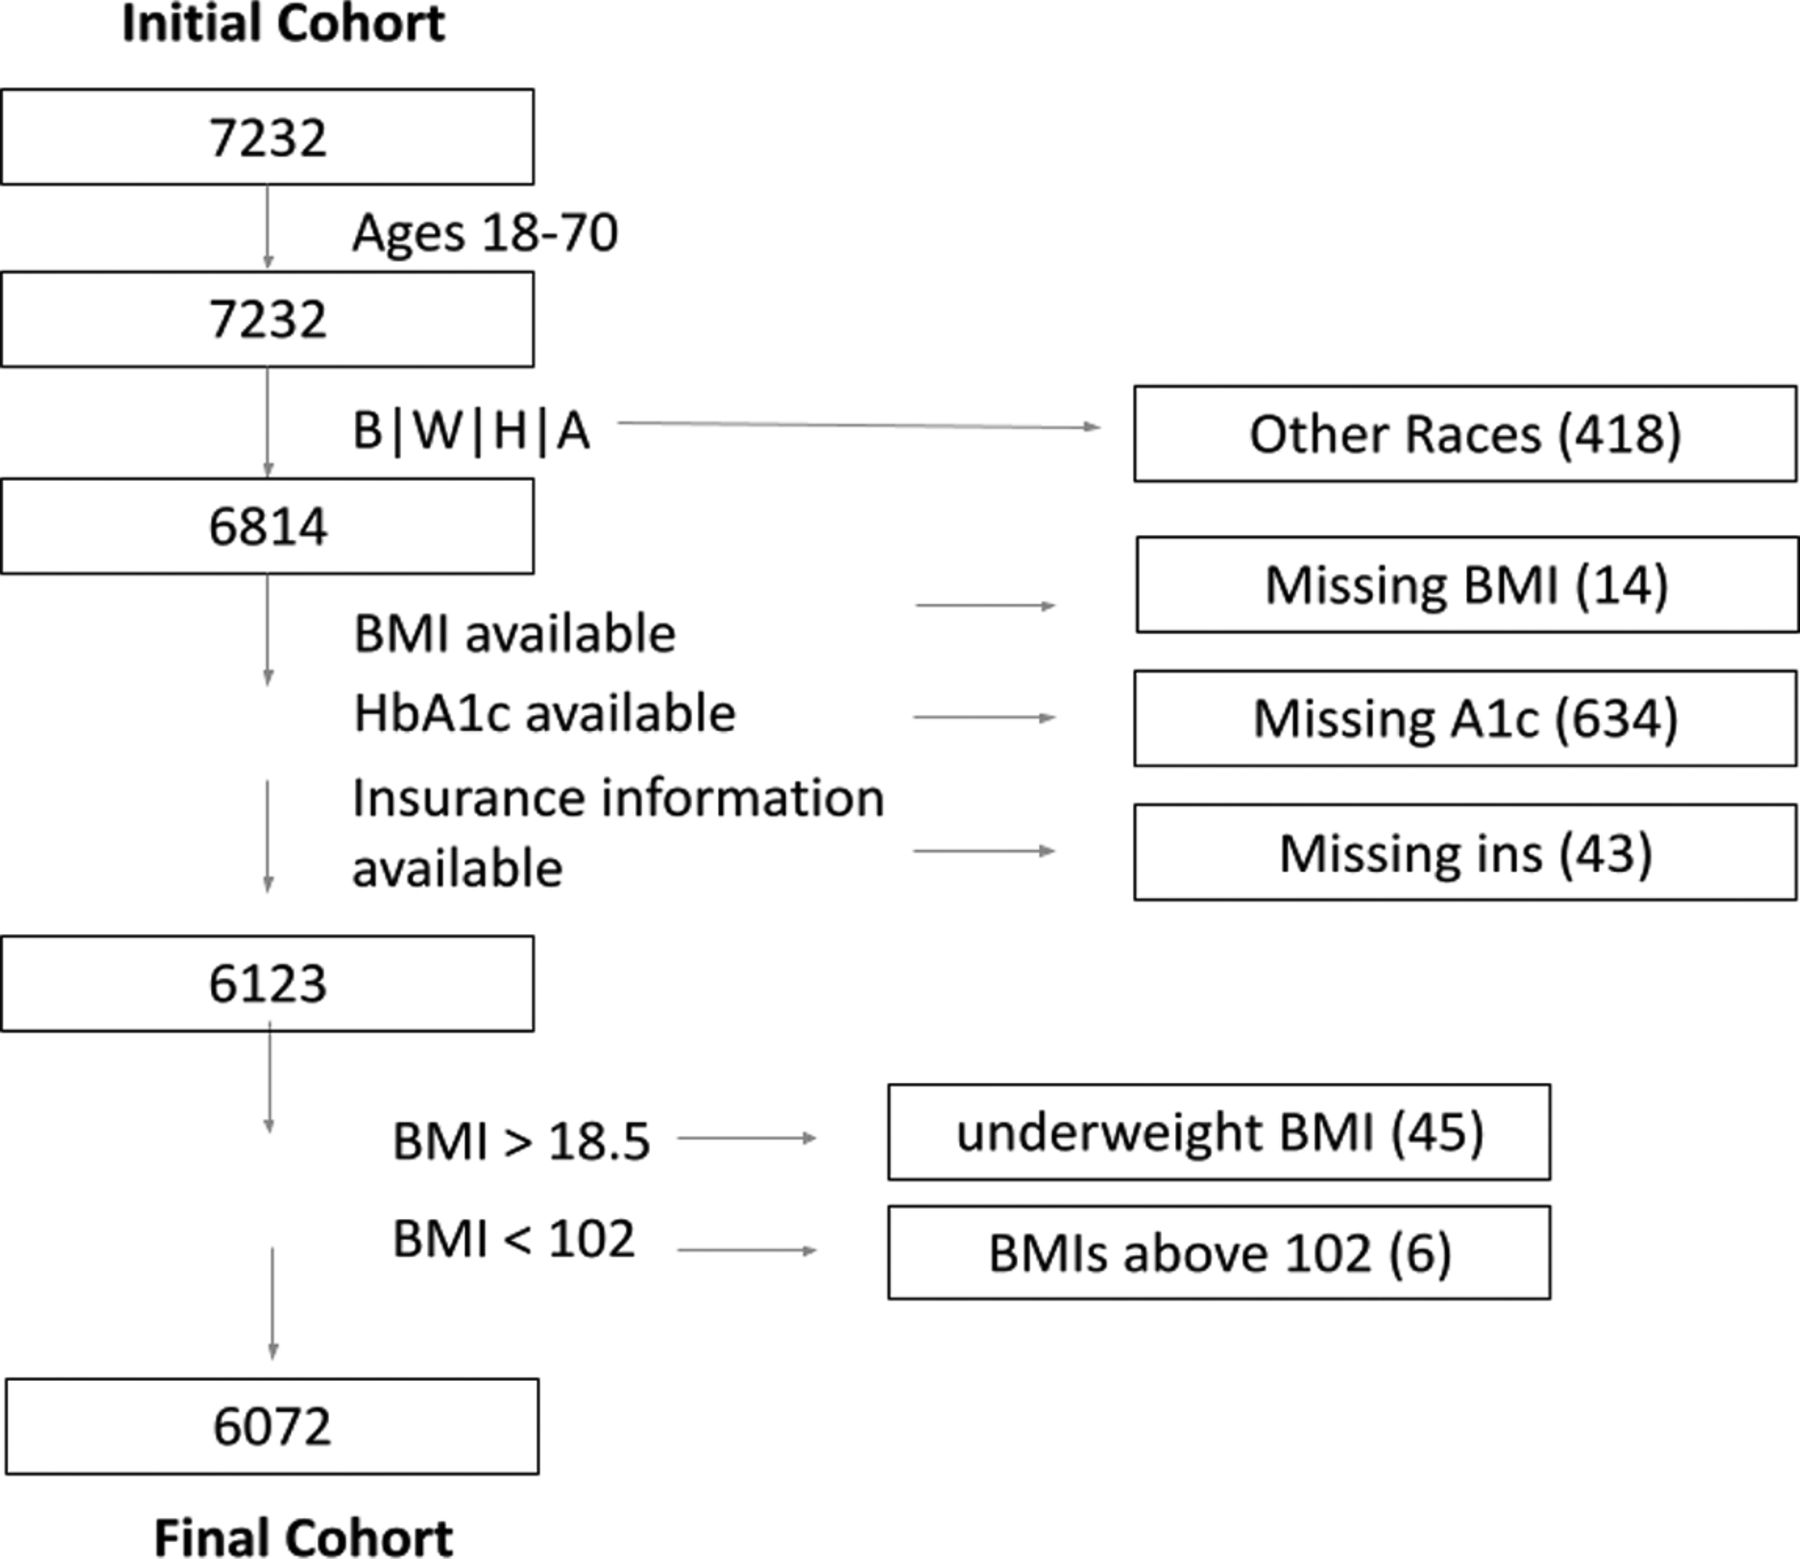
- Appendix Figure 1.
Flowchart demonstrating subject counts for inclusion and exclusion from study.

Tables
Overall (N = 6072) Labeled (N = 759) Non-Labeled (N = 5313) Variable Median [IQR] Median [IQR] Median [IQR] β [95% CI] P value Age, years 57 [49, 63] 56 [48, 62] 57 [49, 63] −0.0013 [−0.0021, −0.0005] .001 HbA1c, % 7.5 [6.6, 9.1] 8.3 [6.8, 10.0] 7.5 [6.5, 8.9] 0.019 [0.015, 0.023] <.001 BMI, kg/m2 32.3 [27.8, 37.9] 32.5 [27.5, 38.9] 32.3 [27.8, 37.8] 0.0007 [−0.0003, 0.002] .53 n (%) n (%) n (%) RR [95% CI] P value Biological sex Male 2909 (47.9) 333 (43.8) 2576 (48.4) Ref Ref Female 3163 (52.1) 426 (56.1) 2737 (51.5) 1.17 [1.03, 1.35] .017 Race White 1941 (31.9) 106 (14.0) 1835 (34.5) Ref Ref Black 3753 (61.8) 623 (82.1) 3130 (58.9) 3.04 [2.49, 3.71] <.001 Asian 229 (3.8) 10 (1.3) 219 (4.1) 0.80 [0.42, 1.51] .49 Ethnicity Non-Hispanic 5906 (97.3) 739 (97.4) 5167 (97.3) Ref Ref Hispanic 166 (2.7) 20 (2.6) 146 (2.7) 0.96 [0.63, 1.46] .85 Insurance payor Private 3536 (58.2) 335 (44.1) 3201 (60.2) Ref Ref Medicaid 1082 (17.8) 222 (29.2) 860 (16.2) 2.17 [1.85, 2.52] <.001 Medicare 1454 (23.9) 202 (26.6) 1252 (23.6) 1.44 [1.23, 1.70] <.001 Care site Primary care 2657 (43.8) 376 (49.5) 2281 (42.9) Ref Ref Specialty care 3415 (56.2) 383 (50.5) 3032 (57.1) 0.79 [0.69, 0.91] <.001 BMI, body mass index; CI, confidence interval; HbA1c, hemoglobin A1C; IQR, interquartile range.
- Table 2.
Adjusted Risk Ratios (ARRs) for Nonadherence Labeling by Demographics in HbA1c and Care Site Strata*
Variable Overall (N = 6072) (Labeled = 759) Subgroup HbA1c ≤7% (N = 2349) (Labeled = 222) Subgroup HbA1c >7% (N = 3723) (Labeled = 537) Subgroup Primary Care (N = 2657) (Labeled = 376) Subgroup Specialty Care(N = 3415) (Labeled = 383) βadj [95% CI] βadj [95% CI] βadj [95% CI] βadj [95% CI] βadj [95% CI] Age −0.006 [−0.014, 0.002] −0.014 [−0.029, 0.001] −0.025 [−0.012, 0.007] 0.009 [−0.0035, 0.020] −0.019 [−0.030, −0.008] HbA1c 0.11 [0.08, 0.15] −0.14 [−0.43, 0.17] 0.11 [0.05, 0.16] 0.09 [0.04, 0.14] 0.14 [0.087, 0.19] BMI −0.0027 [−0.0126, 0.007] 0.074 [−0.010, 0.024] −0.008 [−0.02, 0.003] −0.002 [−0.016, 0.011] −0.002 [−0.016, 0.012] ARR [95% CI] ARR [95% CI] ARR [95% CI] ARR [95% CI] ARR [95% CI] Biological sex Male Ref Ref Ref Ref Ref Female 1.02 [0.87, 1.18] 0.93 [0.73, 1.19] 1.06 [0.88, 1.28] 1.05 [0.83, 1.30] 0.98 [0.78, 1.20] Race White Ref Ref Ref Ref Ref Black 2.48 [2.01, 3.04] 2.87 [1.94, 4.27] 2.16 [1.72, 2.76] 2.56 [1.66, 3.97] 2.45 [1.90, 3.16] Asian 0.75 [0.33, 1.26] 1.39 [0.31, 2.85] 0.53 [0.11, 1.05] 0.23 [0.00, 0.84] 1.07 [0.42, 1.84] Ethnicity Non-Hispanic Ref Ref Ref Ref Ref Hispanic 1.22 [0.71, 1.83] 1.14 [0.25, 2.19] 1.24 [0.62, 1.99] 1.21 [0.31, 2.55] 1.27 [0.64, 2.03] Insurance payor Private Ref Ref Ref Ref Ref Medicaid 1.82 [1.50, 2.18] 1.75 [1.23, 2.40] 1.83 [1.46 2.26] 2.16 [1.66, 2.76] 1.50 [1.11, 1.97] Medicare 1.61[1.32, 1.93] 1.68 [1.19, 2.31] 1.55 [1.21, 1.95] 1.41 [1.02, 1.90] 1.74 [1.34, 2.21] Care site Primary care Ref Ref Ref Not applicable Not applicable Specialty care 1.00 [0.85, 1.16] 0.91 [0.69, 1.17] 1.04 [0.86, 1.24] Not applicable Not applicable BMI, body mass index; CI, confidence interval; HbA1c, hemoglobin A1C.
↵* ARRs for categorical variables, and beta coefficients for continuous variables, were calculated with a logistic regression model using all the following potentially confounding variables: age, sex, race, BMI, ethnicity, insurance status, and HbA1c. Additional calculations using the adjusted odd ratio are presented in the supplementary document (S1.5); no changes in significance were observed across the 2 model choices.
- Table 3.
Adjusted Risk Ratios (ARRs) for Nonadherence Labeling by Demographics in HbA1c and Care Site Strata with Adjustment by Zip Code Median Household Income*
Variable Philadelphia County (N = 3591) (Labeled = 580) Subgroup HbA1c ≤7% (N = 1298) (Labeled = 169) Subgroup HbA1c >7% (N = 2293) (Labeled = 411) Subgroup Primary Care (N = 2016) (Labeled = 315) Subgroup Specialty Care (N = 1575) (Labeled = 265) βadj [95% CI] βadj [95% CI] βadj [95% CI] βadj [95% CI] βadj [95% CI] HbA1c 0.085 [0.043, 0.126] −0.20 [−0.54, 0.14] −0.013 [−0.03, 0.004] 0.082 [0.03, 0.14] 0.09 [0.03, 0.15] Zip code Median Income, $1000 units −0.027 [−0.041, −0.014] −0.031 [−0.056, −0.006] −0.026 [−0.042, −0.01] −0.019 [−0.038, −0.001] −0.041 [−0.061, −0.021] ARR [95% CI] ARR [95% CI] ARR [95% CI] ARR [95% CI] ARR [95% CI] Race White Ref Ref Ref Ref Ref Black 1.70 [1.28, 2.30] 2.01 [1.23, 3.72] 1.55 [1.12, 2.21] 2.78 [1.55, 5.14] 1.37 [1.01, 1.97] Insurance payor Private Ref Ref Ref Ref Ref Medicaid 1.71 [1.39, 2.07] 1.44 [1.03, 2.03] 1.81 [1.40, 2.30] 2.08 [1.54, 2.76] 1.36 [1.03, 1.79] Medicare 1.61[1.29, 1.99] 1.52 [1.06, 2.21] 1.61 [1.21, 1.98] 1.48 [1.02, 2.08] 1.60 [1.22, 2.12] BMI, body mass index; CI, confidence interval; HbA1c, hemoglobin A1C.
↵* In addition to zip-code median income, the logistic regression model also included the following potentially confounding variables: age, sex, race, BMI, ethnicity, insurance status, and HbA1c.
- Appendix Table 1.
Unadjusted prevalences of nonadherence labeling among all racial categories
Total Not Labeled Labeled Prevalence Overall 7232 6405 827 0.114 Black 4152 3487 665 0.160 White 2224 2111 113 0.051 Asian 260 250 10 0.038 Other 222 211 11 0.050 Hispanic /Latino—White 116 106 10 0.086 Hispanic /Latino—Black 62 51 11 0.177 East Indian 71 67 4 0.056 American Indian 19 19 0 0.000 Patient declined 11 11 0 0.000 Pacific Islander 4 4 0 0.000 Unknown race 91 88 3 0.033 - Appendix Table 2.
Adjusted Odd Ratios for Nonadherence Labeling by Demographics in Hemoglobin A1c and Care Site Strata*
Variable Overall
(n = 6072) (Labeled = 759)Subgroup
HbA1c ≤7% (n = 2349) (Labeled = 222)Subgroup
HbA1c >7%
(n = 3723)
(Labeled = 537)Subgroup
Primary Care
(n = 2657)
(Labeled = 376)Subgroup
Specialty Care
(n = 3415)
(Labeled = 383)βadj [95% CI] βadj [95% CI] βadj [95% CI] βadj [95% CI] βadj [95% CI] Age, years −0.006 [−0.014, 0.002] −0.014 [−0.029, 0.001] −0.025 [−0.012, 0.007] 0.009 [−0.0035, 0.020] −0.019 [−0.030, −0.008] HbA1c, % 0.11 [0.08, 0.15] −0.14 [−0.43, 0.17] 0.11 [0.05, 0.16] 0.09 [0.04, 0.14] 0.14 [0.087, 0.19] BMI, kg/m2 −0.0027 [−0.0126, 0.007] 0.074 [−0.010, 0.024] −0.008 [−0.02, 0.003] −0.002 [−0.016, 0.011] −0.002 [−0.016, 0.012] AOR [95% CI] AOR [95% CI] AOR [95% CI] AOR [95% CI] AOR [95% CI] Biological sex Male ref ref ref ref ref Female 1.01 [0.87, 1.18] 0.93 [0.69, 1.23] 1.03 [0.87, 1.28] 1.04 [0.82, 1.30] 0.97 [0.77, 1.21] Race White ref ref ref ref ref Black 2.77 [2.22, 3.48] 3.23 [2.15, 4.97] 2.53 [1.94, 3.33] 2.71 [1.76, 4.37] 2.76 [2.12, 3.60] Asian 0.73 [0.35, 1.36] 1.39 [0.46, 3.39] 0.50 [0.17, 1.16] 0.21 [0.01, 1.02] 1.05 [0.48, 2.05] Ethnicity Non-Hispanic ref ref ref ref ref Hispanic 0.73 [0.35, 1.36] 1.39 [0.46, 3.39] 0.50 [0.17, 1.16] 0.21 [0.01, 1.02] 1.05 [0.48, 2.05] Insurance Private ref ref ref ref ref Medicaid 1.87 [1.54, 2.26] 1.83 [1.27, 2.62] 1.86 [1.48, 2.33] 2.16 [1.66, 2.79] 1.53 [1.14, 2.04] Medicare 1.64 [1.34, 1.99] 1.78 [1.25, 2.52] 1.56 [1.22, 1.99] 1.41 [1.04, 1.90] 1.81 [1.39, 2.35] Care site Primary care ref ref ref Not applicable Not applicable Specialty care 1.00 [0.85, 1.17] 0.89 [0.65, 1.22] 1.04 [0.85, 1.26] Not applicable Not applicable AOR, adjusted odd ratio; BMI, body mass index; HbA1c, hemoglobin A1c.
* AORs for categorical variables, and beta coefficients for continuous variables, were calculated with a log-binomial regression model using all of the following potentially confounding variables: age, sex, race, BMI, ethnicity, insurance status, and HbA1c. Results from both models did not change any of the conclusions.
Overall
(n = 6072) (Labeled = 759)HbA1c ≤7% (n = 2349) (Labeled = 222) HbA1c >7% (n = 3723) (Labeled = 537) HbA1c ≤9% (n = 4546) (Labeled = 479) HbA1c >9% (n = 1526) (Labeled = 280) ARR [95% CI] ARR [95% CI] ARR [95% CI] ARR [95% CI] ARR [95% CI] White ref ref ref ref ref Black 2.38 [1.93, 3.02] 2.76 [1.85, 4.17] 2.08 [1.63, 2.74] 2.41 [1.78, 3.14] 1.82 [1.25, 2.54] ARR, adjusted risk ratio; HbA1c, hemoglobin A1c.
Primary Care
(n = 2657)Specialty Care
(n = 3415)P Value Mean (SD) Mean (SD) Age, years 54.0 (10.0) 55.1 (10.1) 4.7 × 10⁻⁶ BMI, kg/m2 34.1 (8.4) 33.1 (8.0) 1.9 × 10⁻⁶ HbA1c, % 8.0 (2.0) 8.1 (1.9) 9.9 × 10⁻⁸ n (%) n (%) Biological sex Male 1185 (44.6%) 1724 (50.4 %) ref Female 1472 (55.4%) 1691 (49.6%) 6.0 × 10⁻⁶ Race White 401 (15.1%) 1635 (47.9%) ref Black 2173 (81.8%) 1634 (47.8%) 2.2 × 10⁻⁶ Asian 83 (3.1%) 146 (4.3%) 1.1 × 10⁻⁸ Ethnicity Non-Hispanic 2599 (97.8%) 3307 (96.8%) ref Hispanic 58 (2.2%) 108 (3.2%) 0.025 Insurance status Private 1557 (58.6%) 1979 (58.0%) ref Medicaid 576 (21.7%) 506 (14.8%) 1.3 × 10⁻⁷ Medicare 524 (19.7%) 930 (27.2%) 2.3 × 10⁻⁷ BMI, body mass index; HbA1c, hemoglobin A1c.
* P values for the continuous variables were calculated using the nonparametric Wilcox test. P values for the categorical variables were calculated using the chi square test; in case of more than 2 categories, 1 category is shown as reference (eg, “White”).
Group 1: Primary Care (n = 2657)
(Labeled = 376)Group 2: Specialty Care (n = 3415)
(Labeled = 383)ARR [95% CI] ARR [95% CI] Race White ref ref Black 2.65 [1.71, 4.29] 2.19 [1.68, 2.86] Asian 0.21 [0.00, 0.77] 1.02 [0.46, 1.64] Ethnicity Non-Hispanic ref ref Hispanic 0.31 [0.00, 0.97] 1.39 [0.26, 3.21] Biological sex Male ref ref Female 1.04 [0.84, 1.29] 0.97 [0.80, 1.17] BMI Normal ref ref Overweight 0.62 [0.41, 0.91] 0.75 [0.55, 1.01] Obese 0.67 [0.47, 0.93] 0.76 [0.57, 1.01] Insurance status Private ref ref Medicaid 2.13 [1.61, 2.73] 1.50 [1.16, 1.93] Medicare 1.38 [1.00, 1.85] 1.63 [1.30, 2.04] ARR, adjusted risk ratio; BMI, body mass index.


