
Article Figures & Data
Figures
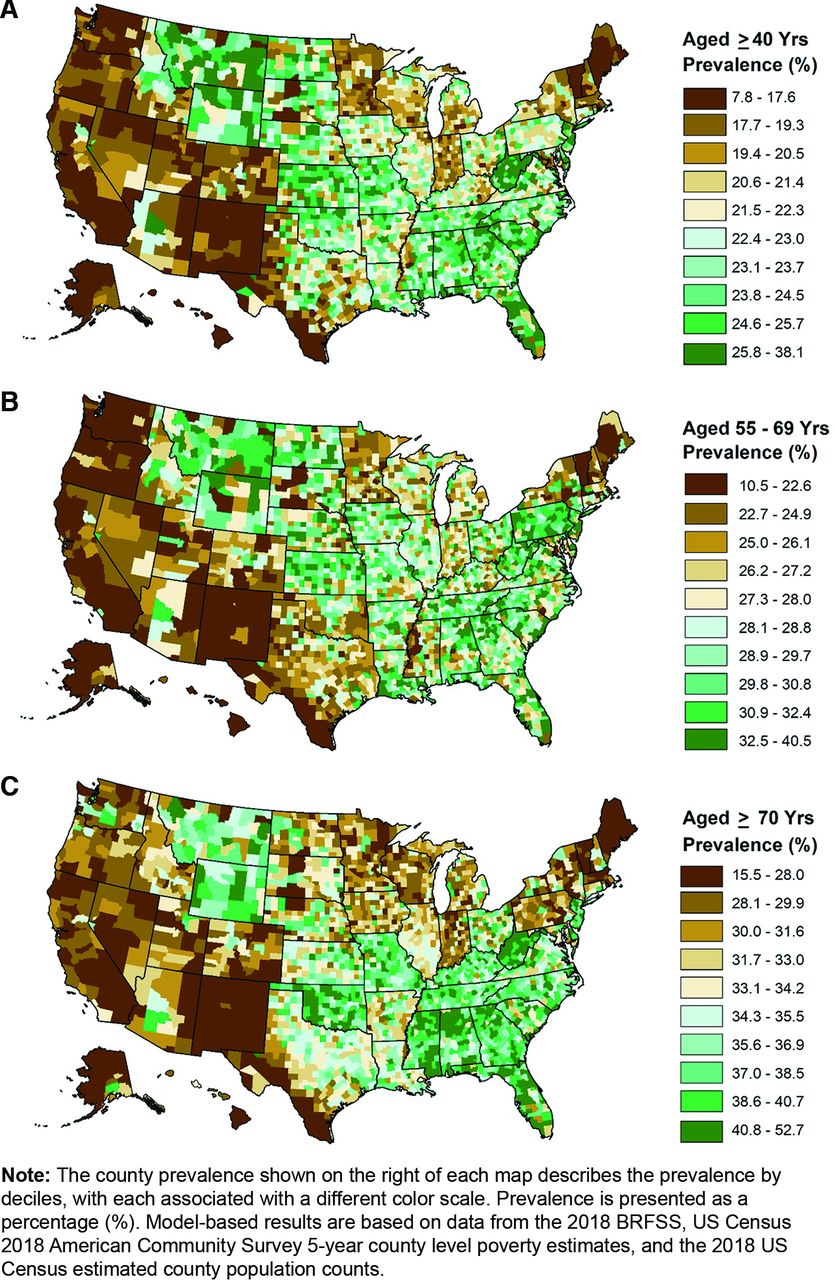
- Appendix Figure 1.
Model-Based Estimated County Prevalence Maps for Men with Prostate-Specific Antigen (PSA) Screening as Part of a Routine Examination Within the Past Year, By Age-Group, Using 2018 Data. Abbreviation: BRFSS, Behavioral Risk Factor Surveillance System.

Tables
- Table 1.
National Estimates From the 2018 Behavioral Risk Factor Surveillance System (BRFSS), and Model-Based PSA Screening Summary Estimates for the Total Population and 3142 Counties, by Age Group*†
Age Group, years BRFSS 2018 Model-based national and county summary statistics Overall Range Mean (95% CI) Mean (95%CI) Min Q1 Median Q3 Max ≥40 US 19.77 (19.31–20.24) 20.59 (20.18–21.00) Counties 21.93 7.87 20.00 22.27 24.07 38.14 30.27 40 to 54 US 7.85 (7.38–8.36) 7.67 (7.43–7.92) Counties 7.82 4.33 7.26 7.8 8.32 12.62 8.28 55 to 69 US 26.72 (25.89–27.56) 27.23 (26.50–27.96) Counties 27.75 10.52 25.60 28.05 30.31 40.51 29.99 ≥70 US 33.39 (32.16–34.65) 33.67 (32.64–34.67) Counties 34.22 15.60 30.82 34.23 37.61 52.66 37.06 PSA, Prostate-specific antigen; Min, Minimum; Q1, 25th percentile; Q3, 75th percentile; Max, Maximum; CI, Confidence interval.
↵* 2018 BRFSS sample size for age ≥40 is 116,654. BRFSS percentages are weighted to the study population.
↵† Estimates are presented as percentages (%). Model-based results are based on data from the 2018 BRFSS, US Census 2018 American Community Survey 5-year county-level poverty estimates, and the US Census estimated county population counts.
- Table 2.
Spearman and Pearson Correlation Coefficients Between Model-Based PSA Screening State-Level Estimates and BRFSS 2018 Direct State Estimates, by Age Group*†
Age Group, years No. of States Correlation‡ Min (%) Mean (%) Median (%) Max (%) Spearman§ Pearson‖ ≥40 51 0.94 0.94 Model-based 14.36 20.71 20.94 27.00 BRFSS 12.18 19.54 19.88 27.52 40 to 54 51 0.94 0.89 Model-based 4.52 7.68 7.74 10.31 BRFSS 2.65 7.73 7.39 13.77 55 to 69 51 0.89 0.92 Model-based 17.88 27.13 27.58 32.84 BRFSS 15.26 26.07 25.77 34.56 ≥70 51 0.86 0.85 Model-based 24.40 33.62 33.10 44.18 BRFSS 23.45 33.46 33.51 41.06 PSA, prostate-specific antigen; BRFSS, Behavioral Risk Factor Surveillance System; Min, Minimum; Max, Maximum.
↵* BRFSS 2018 sample size for age ≥40 is 116,654. BRFSS percentages used for comparisons with the Model-based are weighted to the study population. The total number of counties in the model-based is 3,142.
↵† Model-based results are based on data from 2018 BRFSS, US Census 2018 American Community Survey 5-year county-level poverty estimates, and the US Census estimated county population counts.
↵‡ Correlation coefficients between model-based state-level estimates and 2018 BRFSS direct state estimates.
↵§ Spearman correlation coefficient;
↵‖ Pearson correlation coefficient.
- Table 3.
Model-Based SAE State Prevalence Estimate, and County Statistics Summarized by State for PSA Screening Among Men Aged ≥40 Years, for 50 States, the District of Columbia, and 3142 Counties, 2018
State State Mean* County Summary Statistic* Min Q1 Mean Median Q3 Max Range† Alabama 24.98 20.03 23.13 24.45 24.53 25.50 30.24 10.21 Alaska 19.14 7.87 13.56 16.57 17.82 19.40 22.39 14.52 Arizona 21.76 10.97 15.92 19.15 19.17 21.81 26.71 15.74 Arkansas 23.12 18.38 21.47 27.67 22.40 23.96 27.33 8.95 California 15.85 11.65 15.01 16.94 16.38 18.84 23.22 11.57 Colorado 17.36 11.56 16.93 18.73 18.86 20.33 24.36 12.80 Connecticut 21.69 18.25 20.68 21.62 22.25 22.81 23.23 4.97 Delaware 24.43 22.00 22.00 25.10 23.75 29.54 29.54 7.54 District of Columbia 17.76 17.76 Florida 25.61 19.21 22.58 25.38 24.87 27.68 38.14 18.94 Georgia 24.14 17.78 23.22 24.47 24.23 25.63 32.01 14.23 Hawaii 15.64 14.98 15.46 15.83 15.73 16.10 16.88 1.90 Idaho 20.17 15.42 18.74 20.55 20.65 22.16 24.66 9.24 Illinois 19.44 16.30 21.14 22.11 22.09 23.15 25.88 9.57 Indiana 19.43 16.71 18.94 19.78 19.76 20.53 22.79 6.08 Iowa 21.22 16.63 21.23 22.22 22.32 23.14 27.31 10.68 Kansas 22.55 14.46 23.13 23.99 24.43 25.47 29.06 14.60 Kentucky 21.86 16.74 20.84 21.98 22.00 23.11 27.60 10.86 Louisiana 23.81 17.01 21.94 23.02 22.92 24.14 27.21 10.20 Maine 15.84 13.71 14.49 15.93 15.74 16.81 19.21 5.49 Maryland 19.55 16.43 18.21 20.57 19.84 22.96 25.74 9.30 Massachusetts 18.39 16.11 17.78 19.10 18.37 19.68 25.69 9.58 Michigan 20.27 17.20 19.94 21.31 21.16 22.44 26.51 9.31 Minnesota 17.69 14.67 18.09 19.14 19.26 19.99 23.54 8.87 Mississippi 23.53 17.31 22.01 23.02 23.16 24.53 27.75 10.43 Missouri 23.93 19.26 23.00 24.00 24.07 25.12 29.74 10.47 Montana 23.87 15.48 23.02 24.56 25.52 26.73 29.16 13.67 Nebraska 20.12 16.09 21.26 22.64 23.08 24.00 28.83 12.74 Nevada 17.21 15.81 17.20 19.02 18.58 19.52 25.94 10.13 New Hampshire 19.29 15.38 17.04 19.02 19.59 20.02 23.31 7.92 New Jersey 24.20 18.95 23.24 24.63 25.49 26.80 29.03 10.08 New Mexico 14.36 8.37 13.75 14.98 14.69 16.33 20.44 12.07 New York 20.68 14.45 19.03 20.43 20.68 22.03 28.58 14.13 North Carolina 23.66 17.19 22.67 24.17 23.94 25.29 32.34 15.14 North Dakota 21.37 10.70 21.57 22.97 23.79 24.86 27.87 17.17 Ohio 21.97 17.09 21.11 22.28 21.92 23.50 27.88 10.79 Oklahoma 23.32 17.24 22.56 23.33 23.22 24.36 27.18 9.94 Oregon 15.97 13.27 16.23 17.09 17.22 18.46 20.15 6.88 Pennsylvania 21.90 18.76 21.30 22.32 22.38 23.10 25.86 7.10 Rhode Island 20.60 18.53 20.56 22.91 23.25 25.37 26.82 8.29 South Carolina 26.14 20.44 23.16 25.14 24.95 26.17 34.97 14.53 South Dakota 21.73 8.57 19.94 21.37 22.70 24.16 26.06 17.49 Tennessee 23.25 18.99 22.99 23.88 23.90 24.97 30.26 11.23 Texas 18.59 11.22 18.22 20.30 20.60 22.64 29.21 17.99 Utah 16.52 12.43 16.95 18.19 18.61 20.30 23.07 10.64 Vermont 15.02 12.62 13.65 15.15 15.34 16.08 19.14 6.52 Virginia 20.94 15.11 20.41 22.06 22.13 23.67 27.82 12.70 Washington 15.44 13.01 15.52 17.45 17.13 19.92 22.68 9.67 West Virginia 27.00 22.52 25.56 26.79 26.77 27.96 31.79 9.38 Wisconsin 19.56 12.96 19.65 20.49 20.42 21.46 25.03 12.07 Wyoming 24.57 20.86 22.96 24.74 24.56 26.83 29.82 8.96 SAE, small area estimation; PSA, prostate-specific antigen; Min, Minimum; Max, Maximum; Q1, 25th percentile; Q3, 75th percentile; BRFSS, Behavioral Risk Factor Surveillance System.
↵* State prevalence is presented as means and estimates are presented as percentages (%). Model-based results are based on data from the 2018 BRFSS, US Census 2018 American Community Survey 5-year county-level poverty estimates, and the US Census estimated county population counts.
↵† Range means the difference between the minimum and maximum estimated percentages.
- Table 4.
Model-Based SAE State Prevalence Estimate and County Statistics Summarized by State for PSA Screening among Men Aged 55 to 69 Years and ≥70 Years for 50 States, the District of Columbia, and 3142 Counties, 2018
State State Mean‡ 55 to 69 Years * ≥70 Years†* County Summary Statistic‡ State Mean County Summary Statistic‡ Min Q1 Mean Median Q3 Max Range§ Min Q1 Mean Median Q3‖ Max Range§ Alabama 31.05 22.31 27.83 29.90 29.77 31.72 40.47 18.15 40.73 31.97 36.09 39.20 39.20 41.86 52.37 20.40 Alaska 25.32 10.52 19.16 22.03 22.49 26.45 28.79 18.27 33.32 18.14 24.37 28.45 28.75 31.96 40.36 22.22 Arizona 27.42 14.07 21.58 24.08 23.81 27.90 32.07 18.01 35.76 17.94 25.58 29.03 29.96 32.33 40.45 22.51 Arkansas 31.13 24.10 27.36 29.03 28.90 30.31 40.51 16.41 35.05 27.86 31.93 33.82 33.38 35.56 45.15 17.29 California 21.98 15.39 20.45 22.16 22.04 24.01 29.10 13.71 28.47 20.60 26.81 27.94 28.33 29.53 34.57 13.97 Colorado 25.63 17.51 23.93 25.41 25.62 27.21 32.52 15.01 28.65 22.23 27.30 29.70 29.64 31.97 36.03 13.80 Connecticut 27.19 20.38 25.25 26.60 27.74 28.37 29.72 9.34 34.02 30.50 32.46 33.89 33.25 34.96 39.33 8.83 Delaware 32.84 27.89 27.89 32.15 32.64 35.92 35.92 8.03 37.19 34.15 34.15 38.11 39.29 40.91 40.91 6.77 District of Columbia 23.24 23.24 30.20 30.20 Florida 31.10 23.43 27.51 30.30 30.15 32.58 40.45 17.02 39.76 30.65 36.07 39.39 39.34 42.46 48.43 17.78 Georgia 31.56 24.35 28.00 30.02 29.78 31.41 39.21 14.86 39.80 31.20 37.02 39.00 38.98 40.61 48.06 16.86 Hawaii 18.94 18.29 18.86 20.64 20.38 22.69 23.01 4.72 31.68 18.89 24.59 26.99 28.28 29.09 34.10 15.21 Idaho 28.48 22.60 25.53 27.40 27.35 28.79 31.43 8.82 30.96 25.31 29.17 31.09 31.42 33.25 36.74 11.44 Illinois 25.94 22.05 27.48 28.59 28.58 29.38 33.03 10.99 29.61 23.96 32.13 33.01 33.08 34.25 36.44 12.48 Indiana 26.83 22.19 25.83 27.09 26.87 28.09 32.93 10.74 30.53 24.78 28.64 30.11 29.81 31.50 38.81 14.03 Iowa 29.43 24.44 28.30 29.41 29.40 30.77 36.83 12.38 31.38 24.88 29.81 31.53 31.35 32.91 40.97 16.09 Kansas 29.70 21.65 28.83 30.31 30.51 31.67 38.46 16.82 36.25 23.66 33.34 35.06 34.72 36.75 45.32 21.66 Kentucky 29.03 23.56 26.91 28.70 28.39 30.23 36.19 12.62 37.14 27.51 35.61 37.59 37.56 39.00 46.00 18.49 Louisiana 30.75 22.72 27.73 29.68 29.24 31.46 37.92 15.19 35.82 29.12 32.84 34.62 34.51 36.08 43.81 14.69 Maine 21.64 15.84 19.03 22.09 22.13 25.01 29.07 13.23 24.68 18.79 21.37 23.55 23.44 25.67 28.88 10.09 Maryland 26.16 20.65 25.34 27.01 26.52 29.56 33.52 12.84 32.87 25.41 30.51 32.66 32.64 34.48 41.20 15.79 Massachusetts 25.82 21.91 23.86 26.26 26.11 28.66 31.32 9.41 27.02 21.51 25.84 27.75 27.87 29.75 34.57 13.06 Michigan 26.91 19.75 26.04 27.56 27.59 28.95 34.13 14.39 32.22 24.85 30.09 31.89 31.35 33.54 40.49 15.64 Minnesota 24.05 19.46 23.62 25.19 25.20 26.54 31.81 12.35 29.49 22.9 28.12 30.25 30.41 31.87 38.10 15.20 Mississippi 27.74 19.24 24.53 26.39 26.46 28.59 35.32 16.09 41.23 32.61 37.96 40.36 40.02 42.58 47.07 14.46 Missouri 30.10 23.63 27.53 28.86 28.77 30.28 34.82 11.19 37.79 30.56 36.09 38.00 37.74 39.47 45.93 15.37 Montana 31.08 21.07 28.74 30.33 30.95 32.25 37.13 16.06 35.85 25.96 33.55 35.78 36.37 37.52 45.39 19.44 Nebraska 26.03 18.79 26.59 28.12 28.01 30.32 35.78 16.99 33.09 24.96 30.73 32.92 32.58 35.22 39.37 14.41 Nevada 23.60 20.79 23.69 24.79 24.28 25.47 31.55 10.77 30.79 23.00 27.40 28.71 28.60 29.96 35.97 12.97 New Hampshire 24.09 18.63 20.24 23.39 12.73 25.81 27.66 9.03 33.97 24.15 30.11 32.33 33.03 35.32 37.65 13.50 New Jersey 30.56 23.27 27.17 30.96 31.52 35.34 38.28 15.00 38.49 33.09 37.53 38.84 38.98 40.89 45.03 11.94 New Mexico 17.88 11.36 17.08 18.85 18.37 20.59 26.26 14.90 24.74 15.5 20.55 22.76 22.55 24.88 29.70 14.09 New York 27.58 16.24 24.08 26.73 25.91 29.85 35.79 19.55 31.92 21.9 27.75 31.03 30.52 34.23 43.95 22.05 North Carolina 30.48 20.74 27.86 29.82 29.70 31.75 38.02 17.28 38.83 31.51 36.08 38.00 37.72 48.58 50.47 18.96 North Dakota 29.47 15.83 28.19 29.63 29.74 31.69 35.01 19.18 30.80 21.66 29.24 31.70 31.57 33.64 39.12 17.47 Ohio 28.74 22.07 27.09 29.06 29.25 30.53 39.00 16.93 34.95 27.23 32.60 35.20 34.83 37.34 50.59 23.36 Oklahoma 27.67 19.36 24.50 26.33 26.01 28.14 31.84 12.49 40.13 33.17 37.35 39.66 39.57 41.37 50.38 17.21 Oregon 21.42 17.42 20.46 21.23 21.36 22.19 26.62 9.20 29.78 25.68 28.13 29.78 29.43 31.18 36.94 11.26 Pennsylvania 31.93 26.56 30.52 31.92 31.46 33.42 37.72 11.16 30.37 25.89 28.84 30.43 30.20 31.90 37.49 11.60 Rhode Island 27.04 24.62 26.27 29.64 31.21 32.33 33.78 9.16 31.68 28.81 29.67 34.51 34.81 35.00 44.26 15.45 South Carolina 32.41 24.12 28.35 30.40 29.37 33.04 38.63 12.77 39.85 30.94 34.16 37.51 37.22 40.46 49.43 18.50 South Dakota 27.88 12.20 24.60 26.75 28.32 29.87 37.29 25.08 34.63 19.18 31.37 32.63 33.38 35.02 44.57 25.39 Tennessee 29.74 23.02 28.61 30.14 30.06 31.32 37.65 14.63 37.81 31.10 36.21 37.74 37.67 39.14 45.02 13.93 Texas 25.67 14.96 23.55 25.07 25.46 27.12 32.78 17.83 33.10 21.32 31.48 32.93 33.59 35.15 45.19 23.87 Utah 25.22 17.75 23.56 25.15 25.39 26.75 32.72 14.97 29.85 23.93 28.46 30.29 29.94 32.11 39.82 15.89 Vermont 18.79 15.45 16.68 18.98 19.50 20.37 24.83 9.38 24.40 17.99 21.35 23.99 23.10 27.95 29.08 11.09 Virginia 28.62 22.58 26.96 28.90 28.90 30.71 35.76 13.18 35.54 27.67 33.59 35.56 35.25 37.50 45.75 18.08 Washington 19.87 15.98 18.51 20.33 20.11 21.76 26.87 10.89 28.73 23.42 27.58 30.41 29.60 34.60 40.05 16.62 West Virginia 31.91 25.84 29.62 31.51 31.70 33.73 39.52 13.68 44.18 36.56 40.59 42.94 42.51 44.89 52.66 16.10 Wisconsin 26.45 15.73 26.14 27.08 27.16 28.5 33.47 17.74 30.06 23.46 28.56 29.93 29.54 31.73 34.85 11.38 Wyoming 29.44 22.28 27.30 29.37 29.50 32.21 35.69 13.41 39.53 33.73 35.10 38.25 37.77 40.47 46.94 13.21 SAE, small area estimation; PSA, Prostate-specific antigen; Min, Minimum; Max, Maximum; Q1, 25th percentile; Q3, 75th percentile; BRFSS, Behavioral Risk Factor Surveillance System.
* The age group for which the USPSTF recommendations suggest that benefits might exist after discussion with a health care provider.
↵† This age group is not recommended by the USPSTF for routine PSA screening after discussion with a health care provider.
↵‡ State prevalence is presented as means and estimates are presented as percentages (%).
Model-based results are based on data from the 2018 BRFSS, US Census 2018 American Community Survey 5-year county-level poverty estimates, and the US Census estimated county population counts.
↵§ Range means the difference between the minimum and maximum estimated percentages.
↵‖ Bold percentages in the 75th percentiles are ≥40.0%.
- Appendix Table 1.
Unweighted and Weighted Percentages of PSA Screening Within One Year by Age and Race and Ethnicity Groups, BRFSS 2018, (n = 116,654)*†
Age Group, years Sample Size Unweighted %‡ Weighted % (95% CI) 40 to 49 22,561 4.32 4.51 (4.04-5.03) 50 to 59 29,595 16.90 16.81 (15.98-17.68) 60 to 69 33,718 30.79 30.30 (29.25-31.36) 70 to 79 21,449 37.28 37.50 (35.96-39.05) ≥80 9,331 23.50 23.38 (21.48-25.39) Race and ethnicity NH white 92,133 24.43 22.26 (21.75-22.78) NH black 8,044 21.12 18.40 (17.01-19.87) NH AIAN 2,009 12.10 12.46 (9.42-16.31) NH Asian 2,076 14.45 12.26 (9.72-15.33) NH PI 369 10.57 11.48 (7.11-18.00) NH ≥2 races 2,024 15.12 15.02 (12.79-19.40) Hispanic 6,572 11.41 11.65 (10.04-13.48) BRFSS, Behavioral Risk Factor Surveillance System; PSA, Prostate-Specific Antigen; CI, Confidence interval; NH, Non-Hispanic; AIAN, American Indian Alaska Native; PI, Pacific Islander.
↵* We excluded the NH other race group in our analysis to match the US Census race and ethnicity categorization, which we used in our simulation models.
↵† Sample size is the number of men who answered the question whether they had had a PSA test in the past year (Yes/No or never).
↵‡ An unweighted percentage is the percentage of men reporting having had a PSA screening test within 1 year of the interview in a specific age or race and ethnicity group category. Weighted percentage is an estimate of the prevalence of having had a PSA screening test in the past year in a specific age or race and ethnicity group in the study population.


