
Article Figures & Data
Figures
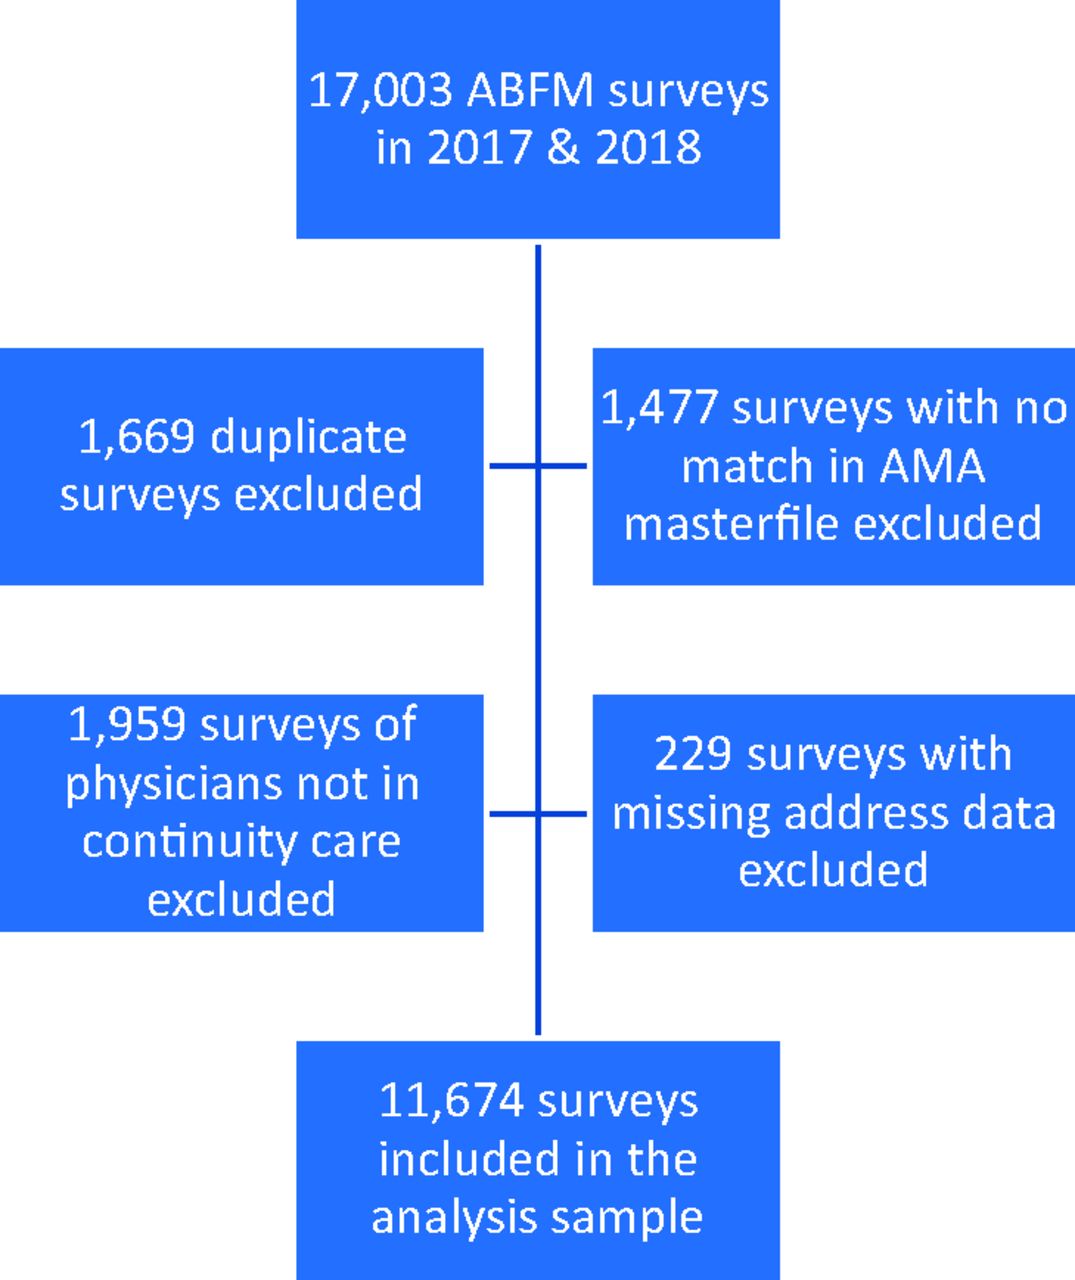
- Figure 1.
Study flow diagram showing the analysis sample: American Board of Family Medicine (ABFM) Certification examination practice demographic questionnaire data (2017 to 2018). Lack of exact match between the National Provider Identifier (NPI) and physician’s identification number from the American Medical Association (AMA) because some physicians do not have an NPI or may have changed last name (n = 1477).
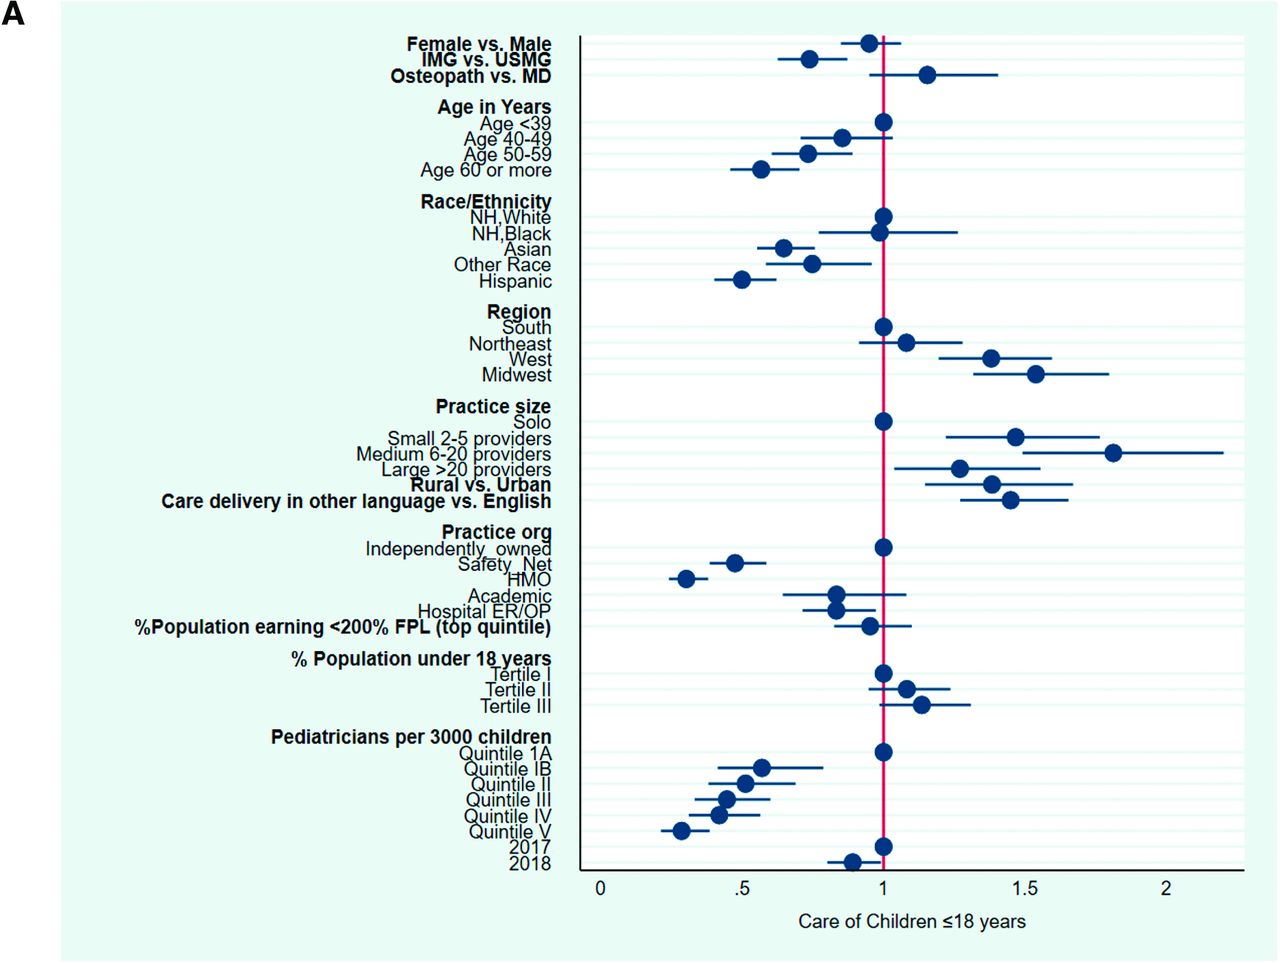
- Figure 2.
A, Factors associated with family physicians’ provision of care to children (≤ 18 years): ABFM certification examination demographic questionnaire data (2017 to 2018) (n = 11,674). B, Factors associated with family physicians’ provision of care to children (< 5 years and 5 to 18 years): ABFM certification examination demographic questionnaire data (2017 to 2018) (n = 11,674). Adjusted odds ratios from multivariate logistic regression examining association between demographic and practice characteristics of family physicians and likelihood of providing care to children under 18 years of age (A), under 5 years of age and 5 to 18 years of age (B). ABFM, American Board of Family Medicine; HMO, health maintenance organization; IMG, international medical graduate; USMG, United States medical graduate; MD, doctor of medicine; NH, non-Hispanic; ER/OP, emergency room or outpatient facility; FPL, federal poverty level.
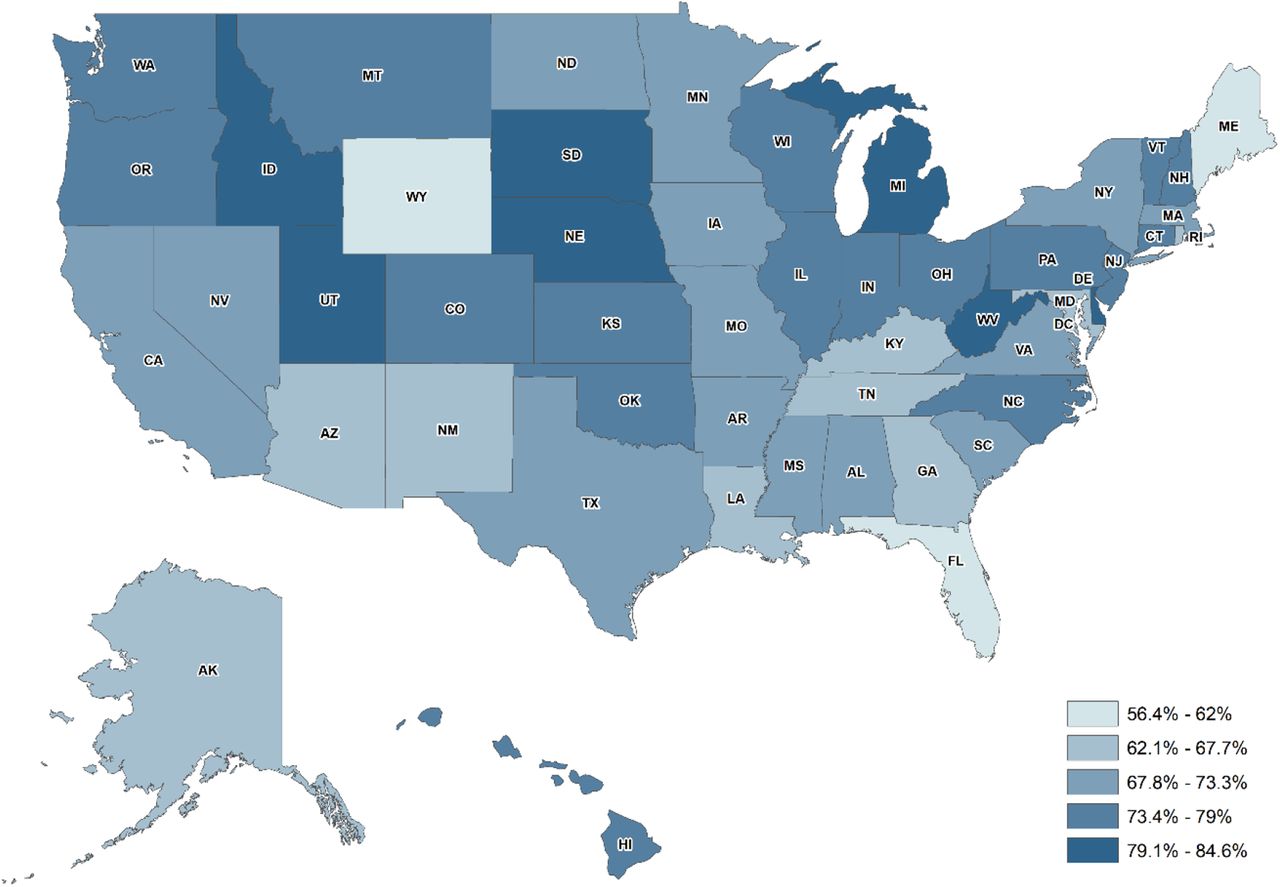
- Figure 3.
Percentage of family physicians registering for the ABFM certification examination who report caring for children under the age of 18 years, 2017 to 2018.


Tables
- Table 1.
Demographic Characteristics of Family Physicians Providing Care to Children (n = 11,674): American Board of Family Medicine Certification Examination Practice Demographic Questionnaire Data (2017 to 2018)
Characteristics Demographics Care of Children ≤ 18 Years P-Value < 5 Years P-Value 5 to 18 Years P-Value n % n % n % n % Gender Female 5094 43.6 4183 82.1 < .001 3341 65.6 < .001 4174 81.9 < .001 Male 6580 56.4 5561 84.5 4527 68.8 5553 84.4 Age in years < 39 1419 12.1 1233 86.9 < .001 1056 74.4 < .001 1232 86.8 < .001 40 to 49 4314 37.0 3632 84.2 2939 68.1 3624 84.0 50 to 59 3936 33.7 3260 82.8 2606 66.2 3255 82.7 60+ 2005 17.2 1619 80.7 1267 63.2 1616 80.6 Location of medical school International medical graduate 1200 10.3 936 78.0 < .001 694 59.0 < .001 934 77.8 < .001 United States medical graduate 10,474 89.7 8808 84.1 7174 69.2 8793 84.0 Type of medical degree Osteopath 1146 9.8 997 87.0 < .001 813 70.9 .006 996 86.9 < .001 MD 10,528 90.2 8747 83.1 7055 67.0 8731 82.9 Race/ethnicity Non-Hispanic, White 8296 71.1 7102 85.6 < .001 5944 71.6 < .001 7093 85.5 < .001 Non-Hispanic, Black 547 4.7 439 80.3 310 56.7 437 79.9 Asian 1605 13.7 1250 77.9 881 54.9 1246 77.6 Non-Hispanic, Other 532 4.6 431 81.0 332 62.4 430 80.8 Hispanic 694 5.9 522 75.2 401 57.8 521 75.1 - Table 2.
Characteristics of Practice and Geographic Areas Served by Family Physicians Providing Care to Children (n=11,674): American Board of Family Medicine Certification Examination Practice Demographic Questionnaire Data (2017-2018)
Characteristics Practice & Geographic Characteristics Care of Children ≤ 18 Years Under 5 Years 5 to 18 years n % n % P-Value n % P-Value n % P-Value Census region South 3799 32.5 3052 80.3 < .001 2202 58.0 < .001 3047 80.2 < .001 Northeast 1699 14.6 1400 82.4 1140 67.1 1400 82.4 West 3089 26.5 2547 82.5 2032 65.8 2540 82.2 Midwest 3087 26.5 2745 88.9 2494 80.8 2740 88.8 Practice size Solo 1421 12.2 1154 81.2 < .001 790 55.6 < .001 1152 81.1 < .001 Small 3962 33.9 3374 85.2 2708 68.3 3370 85.1 Medium 3647 31.2 3131 85.9 2691 73.8 3125 85.7 Large 2644 22.7 2085 78.9 1679 63.5 2080 78.7 Practice organization* Independently owned 3910 33.5 3473 88.8 < .001 2710 69.3 < .001 3471 88.8 < .001 Safety-net 1175 10.1 999 85.0 879 74.8 997 84.9 Health Maintenance Organization 678 5.8 484 71.4 328 48.4 483 71.2 Academic 701 6.0 607 86.6 536 76.5 604 86.2 Hospital-owned 4137 35.4 3698 89.4 3097 74.9 3691 89.2 Other 1073 9.2 483 45.0 318 29.6 481 44.8 Rurality of location Rural 1963 16.8 1779 90.6 < .001 1612 82.1 < .001 1777 90.5 < .001 Urban 9711 83.2 7965 82.0 6256 64.4 7950 81.9 Language of care delivery English 8012 68.6 6676 83.3 .534 5449 68.0 .038 6668 83.2 .672 Other Language 3662 31.4 3068 83.8 2419 66.1 3059 83.5 Poverty status Percent population earning < 200% of federal poverty Level (top quintile) 2252 19.3 1886 83.7 .690 1523 67.6 .795 1881 83.5 .773 Percent census tract population < 18 years Tertile I (0.01-22.3) 3871 19.4 80.8 < .001 62.5 < .001 80.6 < .001 Tertile II (22.3-25.1) 3890 23.7 84.5 70.2 84.4 Tertile III (25.1-42.0) 3913 27.8 85.0 69.7 84.9 Pediatricians per 3000 children Quintile IA (0) 1298 82.2 < .001 77.3 < .001 82.1 < .001 Quintile IB (0.09-0.73) 1467 74.6 64.3 74.4 Quintile II (0.73-1.38) 2767 73.4 60.2 73.3 Quintile III (1.38-2.07) 2763 70.7 56.3 70.6 Quintile IV (2.07-3.32) 2767 70.6 54.1 70.4 Quintile V (3.33 to 59.8) 2763 65.5 48.1 65.3 Year of recertification 2017 6220 53.3 5243 53.8 .010 4249 54 .024 5237 53.8 .007 2018 5454 46.7 4501 46.2 3619 46 4490 46.2 ↵* Practice organizations were collapsed into 6 categories from 11 responses on the survey. The “independently owned” category included respondents selecting “independently owned medical practice.” The “safety-net” category included federally qualified health centers or look-alikes; rural health clinics (federally qualified); Indian Health Service; and governmental non-federal clinics such as the state, county, city, maternal and child health and public health centers. The “managed care/HMO, health maintenance organization” category included managed care or HMO-owned clinics. The “academic” category included academic medical centers and faculty practices. The “hospital ER/OP, emergency room or outpatient facility” included all hospital or health system-owned medical practices, which excludes managed care or HMOs. The “other” category included federal (military, Veterans Administration/Department of Defense), workplace clinics, and other practice types not listed.
Appendix Table 1: Factors Associated with Family Physicians Provision of Care to Children
Characteristics Care of Children < 5 Years, OR (95% CI) 5 to 18 Years, OR (95% CI) ≤ 18 Years, OR (95% CI) Gender Male Female 0.92* (0.84-1.00) 0.95 (0.85-1.06) 0.95 (0.85-1.06) Age (years) < 39 40 to 49 0.80‡ (0.69-0.92) 0.84* (0.70-1.02) 0.85 (0.71-1.03) 50 to 59 0.66‡ (0.57-0.77) 0.73‡ (0.60-0.88) 0.73‡ (0.60-0.89) 60 or over 0.52‡ (0.44-0.62) 0.56‡ (0.45-0.70) 0.58‡ (0.46-0.70) Location of medical school USMG IMG 0.73‡ (0.63-0.83) 0.74‡ (0.63- 0.88) 0.74‡ (0.63-0.87) Type of medical degree MD Osteopath 0.97 (0.83-1.12) 1.16 (0.95-1.41) 1.16 (0.95-1.41) Race/ethnicity Non-Hispanic, White Non-Hispanic, Black 0.74‡ (0.61-0.90) 0.97 (0.76-1.24) 0.99 (0.77-1.26) Asian 0.53‡ (0.47-0.61) 0.64‡ (0.55-0.75) 0.65‡ (0.55-0.76) Non-Hispanic, other 0.69‡ (0.569-0.849) 0.75† (0.58-0.96) 0.75† (0.58-0.96) Hispanic 0.60‡ (0.50-0.73) 0.51‡ (0.41-0.63) 0.50‡ (0.40-0.62) Census region South Northeast 1.57‡ (1.37-1.80) 1.09 (0.92-1.29) 1.08 (0.91-1.28) West 1.65‡ (1.47-1.85) 1.37‡ (1.18-1.58) 1.38‡ (1.19-1.60) Midwest 2.52‡ (2.23-2.85) 1.52‡ (1.31-1.78) 1.54‡ (1.32-1.80) Practice size Solo Small (2 to 5 providers) 1.67‡ (1.45-1.93) 1.48‡ (1.23-1.77) 1.47‡ (1.22-1.77) Medium (6 to 20 providers) 2.36‡ (2.02-2.75) 1.81‡ (1.49-2.20) 1.81‡ (1.49-2.20) Large (> 20 providers) 1.72‡ (1.46-2.02) 1.28† (1.04-1.56) 1.27† (1.04-1.56) Rural Urban 1.60‡ (1.38-1.85) 1.39‡ (1.15-1.67) 1.38‡ (1.15-1.67) Speaks second language No, speaks English Yes, Spanish/other 1.33‡ (1.20-1.48) 1.43‡ (1.25-1.63) 1.45‡ (1.27-1.65) Practice organization Independently owned Safety-net 0.80‡ (0.68-0.95) 0.47‡ (0.38-0.58) 0.48‡ (0.39-0.59) HMO 0.38‡ (0.31-0.46) 0.30‡ (0.24-0.38) 0.30‡ (0.24-0.38) Academic 1.320‡ (1.07-1.62) 0.81 (0.62-1.04) 0.83 (0.64-1.08) Hospital owned 0.91 (0.82-1.02) 0.82† (0.70-0.96) 0.83† (0.71-0.97) Other 0.16‡ (0.14-0.19) 0.096‡ (0.08-0.11) 0.096‡ (0.081-0.11) Poverty status of the PCSA of practice location Percent population < 200% FPL (top quintile) 0.96 (0.86-1.08) 0.94 (0.82-1.09) 0.95 (0.83-1.10) Percent population < 18 years Tertile I Tertile II 1.31‡ (1.18-1.4) 1.087 (0.951-1.241) 1.082 (0.947-1.237) Tertile III 1.36‡ (1.21-1.52) 1.14* (0.99-1.32) 1.14* (0.99-1.31) Pediatrician density per 3000 children Quintile IA Quintile IB 0.53‡ (0.42-0.68) 0.57‡ (0.41-0.79) 0.57‡ (0.41-0.79) Quintile II 0.42‡ (0.34-0.53) 0.51‡ (0.38-0.69) 0.512‡ (0.38-0.69) Quintile III 0.36‡ (0.29-0.45) 0.45‡ (0.34-0.605) 0.44‡ (0.33-0.60) Quintile IV 0.34‡ (0.27-0.42) 0.42‡ (0.31-0.57) 0.42‡ (0.31-0.56) Quintile V 0.26‡ (0.21-0.32) 0.29‡ (0.21-0.39) 0.29‡ (0.21-0.39) 2017 2018 0.92* (0.85-1.01) 0.88† (0.79-0.98) 0.89† (0.80-0.99) Constant 3.62‡ (2.70-4.84) 15.80‡ (10.78-23.15) 15.73‡ (10.72-23.11) Observations 11,674 11,674 11,674 OR, Odds Ratio; CI, Confidence Interval; MD; Doctor of Medicine; IMG, International Medical Graduate; USMG, United States Medical Graduate; HMO, Health Maintenance Organization; PCSA, Primary Care Service Area; FPL, Federal Poverty Level.
Source: 2017 and 2018 American Board of Family Physician Recertification Examination Application Survey.
↵* P < .1.
↵† P < .05.
↵‡ P < .01.
In this issue


Jump to section
Related Articles
Cited By...
- Factors Influencing Changing Scopes of Practice Among Contemporary Graduates of the Nations Largest Family Medicine Residency
- Regional Variation in Scope of Practice by Family Physicians
- The Association of Practice Type and the Scope of Care of Family Physicians
- Advancing Research Methods for Common Problems in Family Medicine and Family Medicine Practice Management