
Article Figures & Data
Figures
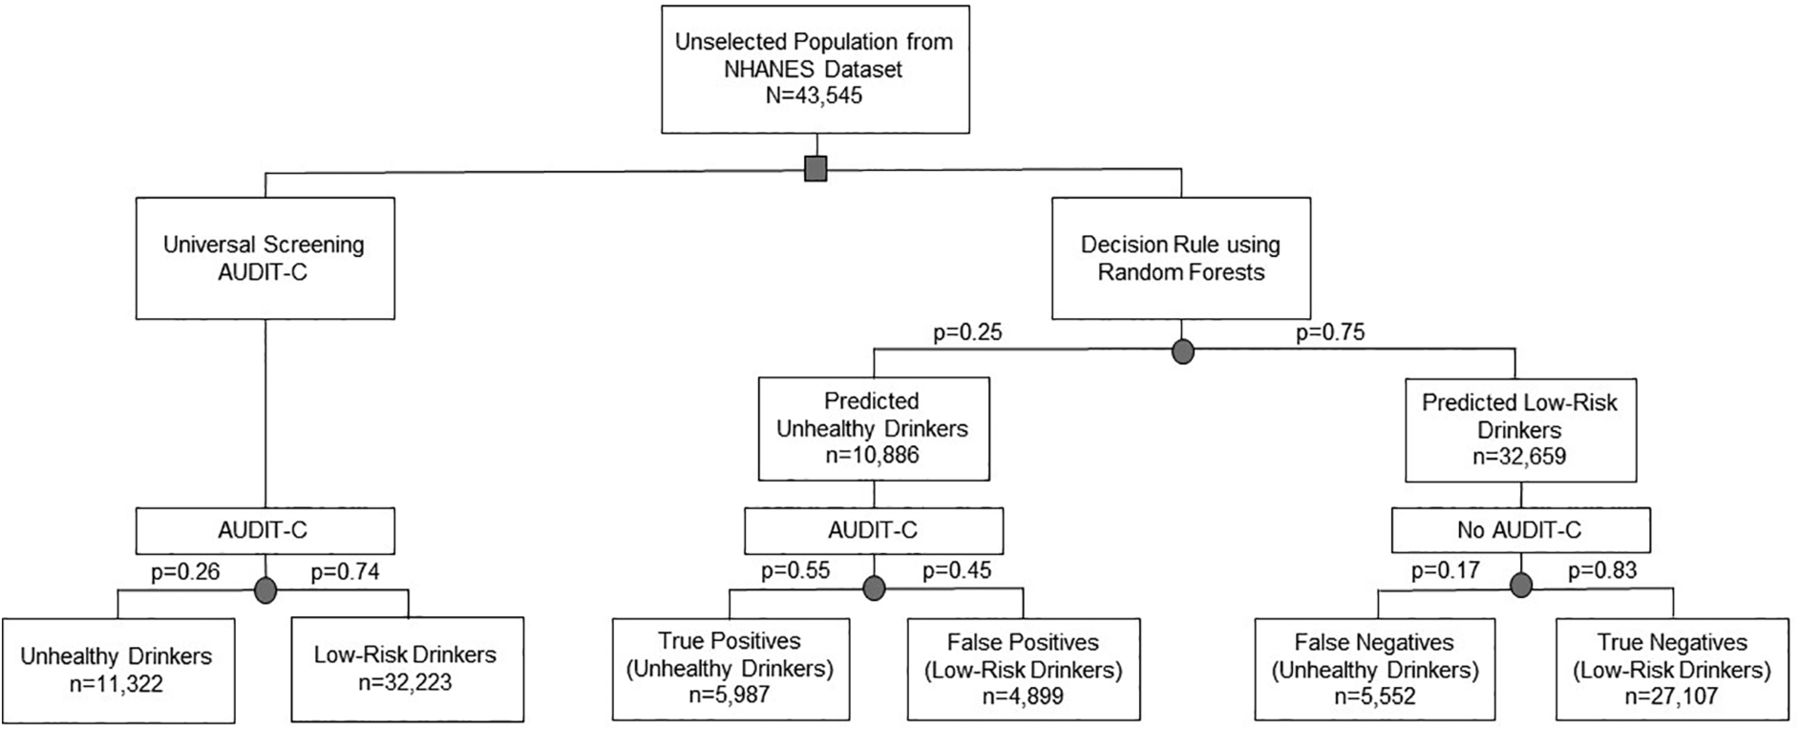
- Figure 1.
Random Forest AUC for training, validation, and test sets. Abbreviations: AUC, area under the receiver operating characteristic curve.
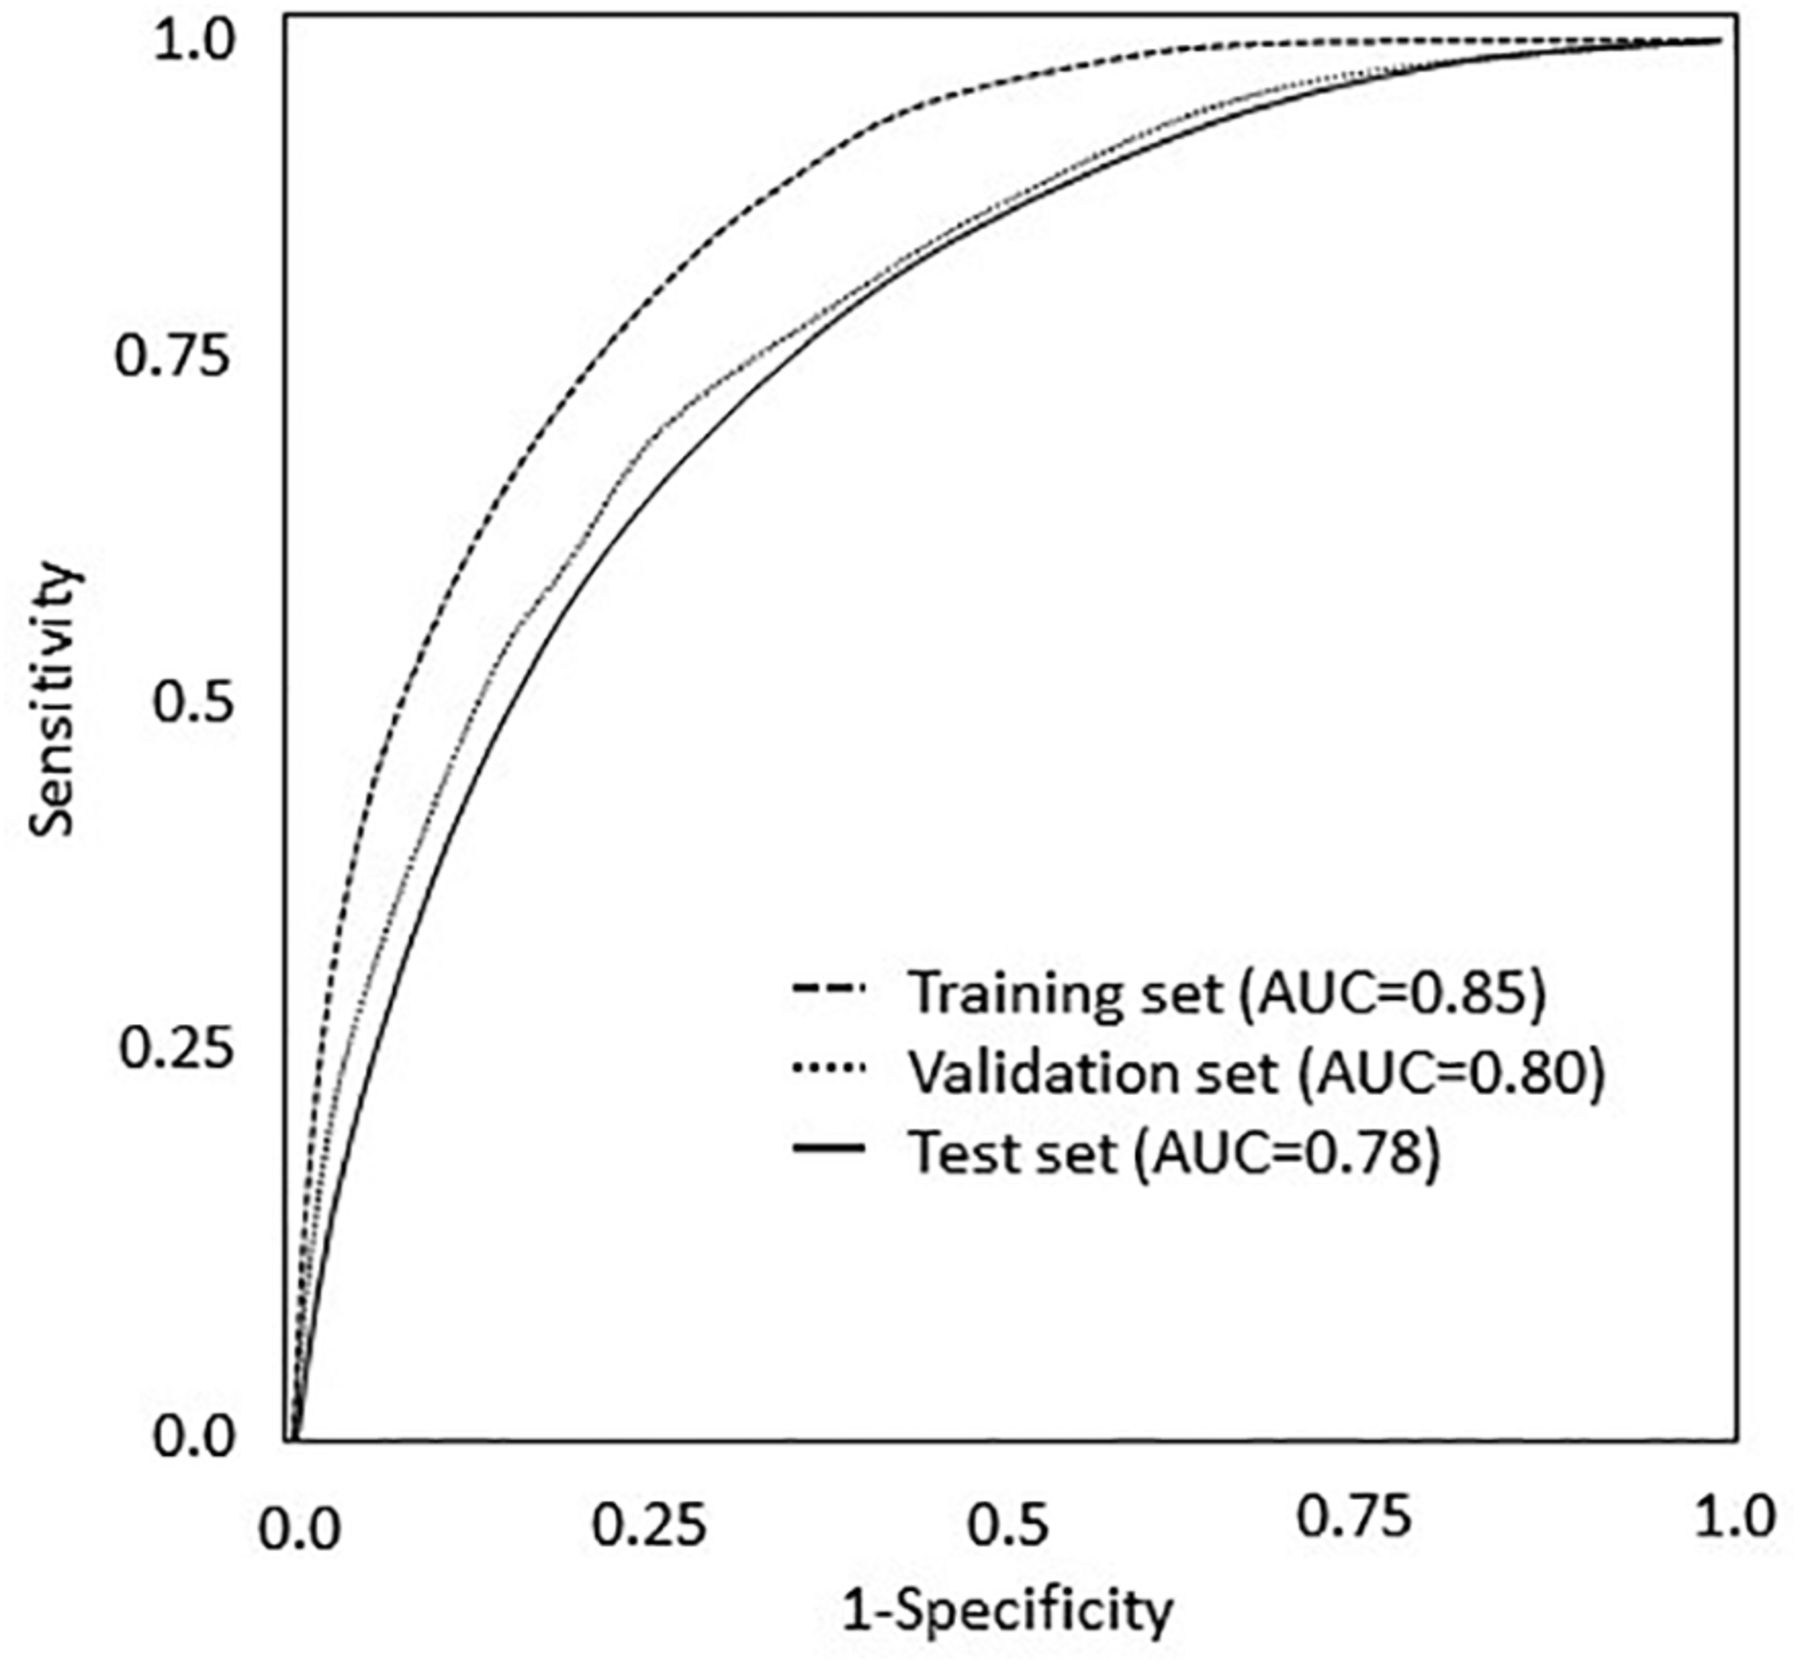
- Figure 2.
Population effect of using the clinical prediction rule to identify unhealthy drinking compared with universal screening. Abbreviations: NHANES, National Health and Nutrition Examination Survey; AUDIT-C, Alcohol Use Disorders Identification Test – alcohol consumption questions.

Tables
Demographic Information Reference Group P Value* Unhealthy Drinkers (n = 11,464), % or Median Low-Risk Drinkers (n = 32,081), % or Median Sex, male† 67% 42% <0.001 Smoking, current† 36% 15% <0.001 Age, years† 38 53 <0.001 Clinical Information Height, cm 171.2 165.4 <0.001 Weight, kg 80 77.3 <0.001 Systolic blood pressure, mm Hg† 120 122 <0.001 Diastolic blood pressure, mm Hg 72 70 <0.001 Resting pulse rate, 60-second count 72 72 0.13 Chemistry Calcium, mg/dL 9.4 9.4 <0.001 Chloride, mmol/L 104 104 <0.001 Phosphorus, mg/dL 3.7 3.7 <0.001 Potassium, mmol/L 4 4 0.006 Sodium, mmol/L 139 139 <0.001 Blood urea nitrogen, mmol/L† 4.3 4.6 <0.001 Creatinine, mg/dL† 0.86 0.82 <0.001 Bicarbonate, mmol/L 25 25 <0.001 Glucose, mg/dL 90 93 <0.001 Uric acid, mg/dL† 5.6 5.2 <0.001 Serum osmolality, mOsm/kg 277 278 <0.001 Liver function Bilirubin, mg/dL 0.7 0.6 <0.001 Alanine aminotransferase, U/L 23 20 <0.001 Aspartate aminotransferase, U/L 24 23 <0.001 Alkaline phosphatase, U/L 65 68 <0.001 Gamma-glutamyl transpeptidase, U/L† 23 19 <0.001 Lactate dehydrogenase, U/L† 124 130 <0.001 Protein, g/dL 7.2 7.2 <0.001 Albumin, g/L† 44 42 <0.001 Hematology Hemoglobin, g/dL† 14.8 13.9 <0.001 Hematocrit, %† 43.4 41.2 <0.001 Mean corpuscular volume, fL† 90.5 89.8 <0.001 Mean cellular hemoglobin, pg† 30.9 30.5 <0.001 Red blood cell distribution width, % 12.6 12.9 <0.001 White blood cell count, 1000/µL 7.1 6.9 <0.001 Platelet count, 1000/µL 8.1 8.1 <0.001 Lipids Total cholesterol, mg/dL 194 193 0.25 High density lipoprotein, mg/dL† 51 50 <0.001 Calculated low density lipoprotein, mg/dL 110 111.4 0.002 Triglyceride, mg/dL 118 121 0.18 - Table 2.
Performance of the Various Machine Learning Models in the Validation Set Using All 38 Variables*
Model Training Validation Test AUC (95% CI) AUC (95% CI) Sensitivity Specificity PPV NPV Overall Accuracy Savings AUC (95% CI) Sensitivity Specificity PPV NPV Overall Accuracy Savings Universal Screening (No rule) — — 1.0 1.0 0.26 0.74 1.0 0% — 1.0 1.0 0.26 0.74 1.0 0% Random Forest 0.85 (0.84–0.86) 0.80 (0.79–0.81) 0.45 0.90 0.58 0.82 0.79 85% 0.78 (0.77–0.79) 0.50 0.88 0.55 0.83 0.76 75% Support Vector Machines 0.81 (0.80–0.82) 0.77 (0.76–0.78) 0.34 0.89 0.50 0.79 0.74 82% — — — — — — — Neural Networks 0.79 (0.78–0.80) 0.78 (0.77–0.78) 0.36 0.90 0.58 0.80 0.76 82% — — — — — — — K-nearest Neighbors 0.78 (0.78–0.79) 0.75 (0.74–0.76) 0.35 0.84 0.45 0.78 0.71 79% — — — — — — — Decision Trees 0.77 (0.76–0.78) 0.75 (0.73–0.76) 0.34 0.90 0.56 0.79 0.75 83% — — — — — — — Logistic Regression 0.76 (0.75–0.77) 0.71 (0.70–0.73) 0.48 0.85 0.55 0.81 0.74 76% — — — — — — — ↵* Sensitivity, specificity, PPV, NPV, Overall Accuracy, and Savings are all calculated at the selected optimum operating point in each case.
PPV, positive predictive value; NPV, negative predictive value; AUC, area under the receiver operating characteristic curve; CI, confidence interval.
Reference Group Information Gain (%) Age 28.1 Current smoker 10.7 Hemoglobin 7.7 Sex 7.3 High density lipoprotein 6.3 Hematocrit 6.0 Gamma-glutamyl transpeptidase 5.4 Mean cellular hemoglobin 4.8 Uric acid 4.4 Albumin 3.7 Lactate dehydrogenase 3.2 Mean corpuscular volume 3.2 Systolic blood pressure 3.1 Creatinine 3.1 Blood urea nitrogen 3.0 - Appendix.
Selected Machine Learning Methods for Classification of Unknown Cases into Mutually Exclusive Categories
Method Advantage Disadvantage Random forest Low computational cost
Uses missing data to inform model
Can handle large number of records and variables
Provides estimates of the information gained by each input variable
Works well with nonlinear data
Not ideal for rare outcomes
Very difficult to interpret individual variable contributions to classification
Time consuming hyperparameter tuning
Overfitting of data
Support Vector Machines Low computationally cost
Effective when number of variables> number of records (very wide data)
Need a clear margin of separation between outcomes (unhealthy drinking vs low-risk)
Time consuming hyperparameter tuning
Not efficient with large number of records
Neural Networks Works well with nonlinear data
High computational cost during training
Extremely useful with large number of predictors (high dimensionality (e.g. image data))
Time consuming hyperparameter tuning
Any numeric data can be used
Need relatively large number of records for training set
Very difficult to interpret individual variable contributions to classification
Must have many records per variable
Overfitting of data
K-nearest neighbors Very simple construction requiring minimal specifications (a.k.a. hyperparameters)
Intuitive methodology
High computational cost
Challenging with large number of variables (wide data)
Cannot handle imbalanced data
Very sensitive to outliers
Cannot handle missing data
Decision Trees Can handle missing data
Highly biased to training set
No data preprocessing needed
Provides highly intuitive explanation over the prediction
Relatively inaccurate compared to other models
Logistic Regression Common and understood by most
Proper selection of features is required
Relatively easy to implement
Cannot handle missing data
Loss function is always convex
Needs data preprocessing and handling to cover non-linear data
Cannot handle large number of categorical predictors


