
Article Figures & Data
Figures
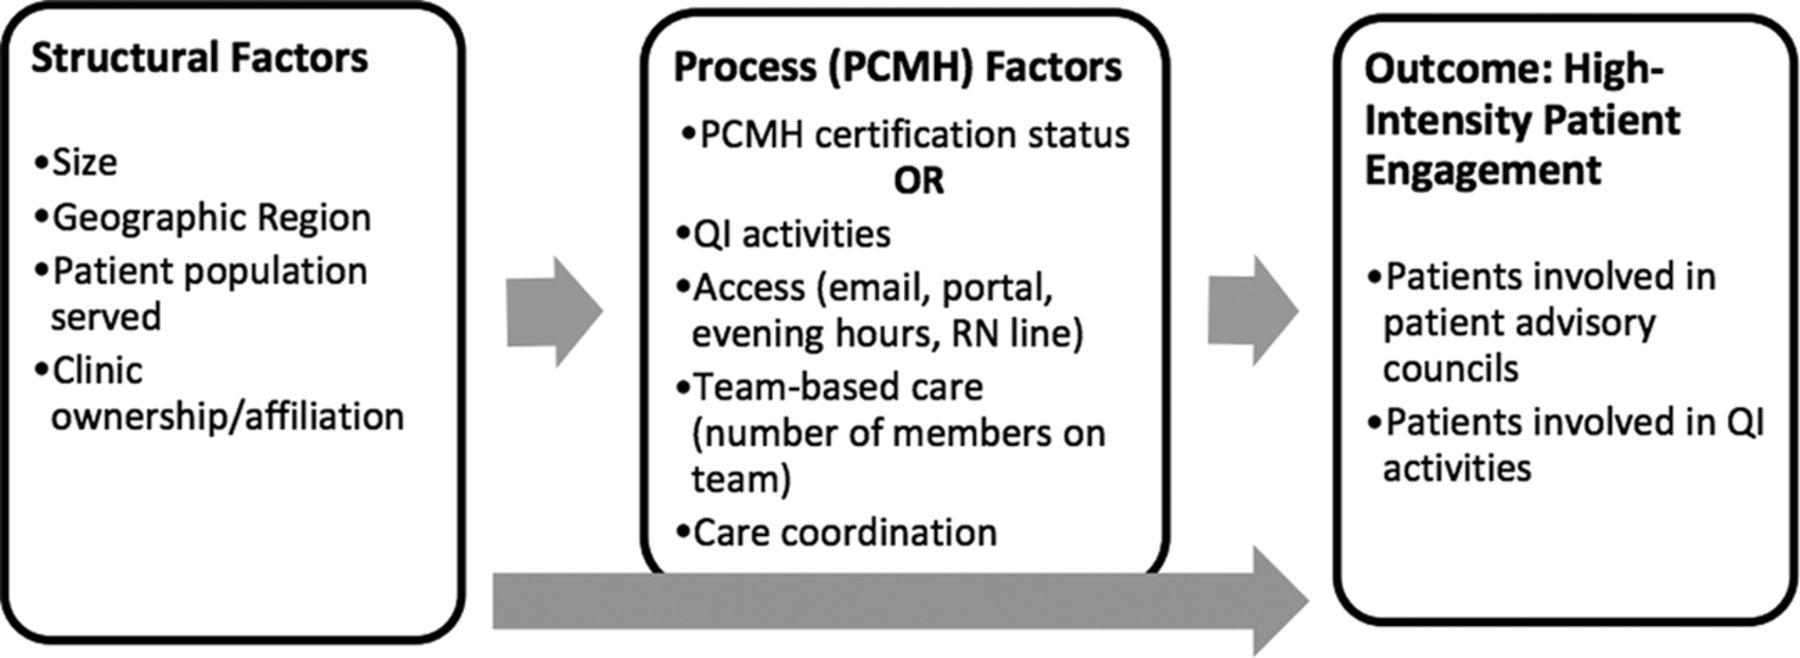
- Figure 1.
Conceptual Model of structure, process, and outcome factors. PCMH, patient-centered medical home; QI, quality improvement.
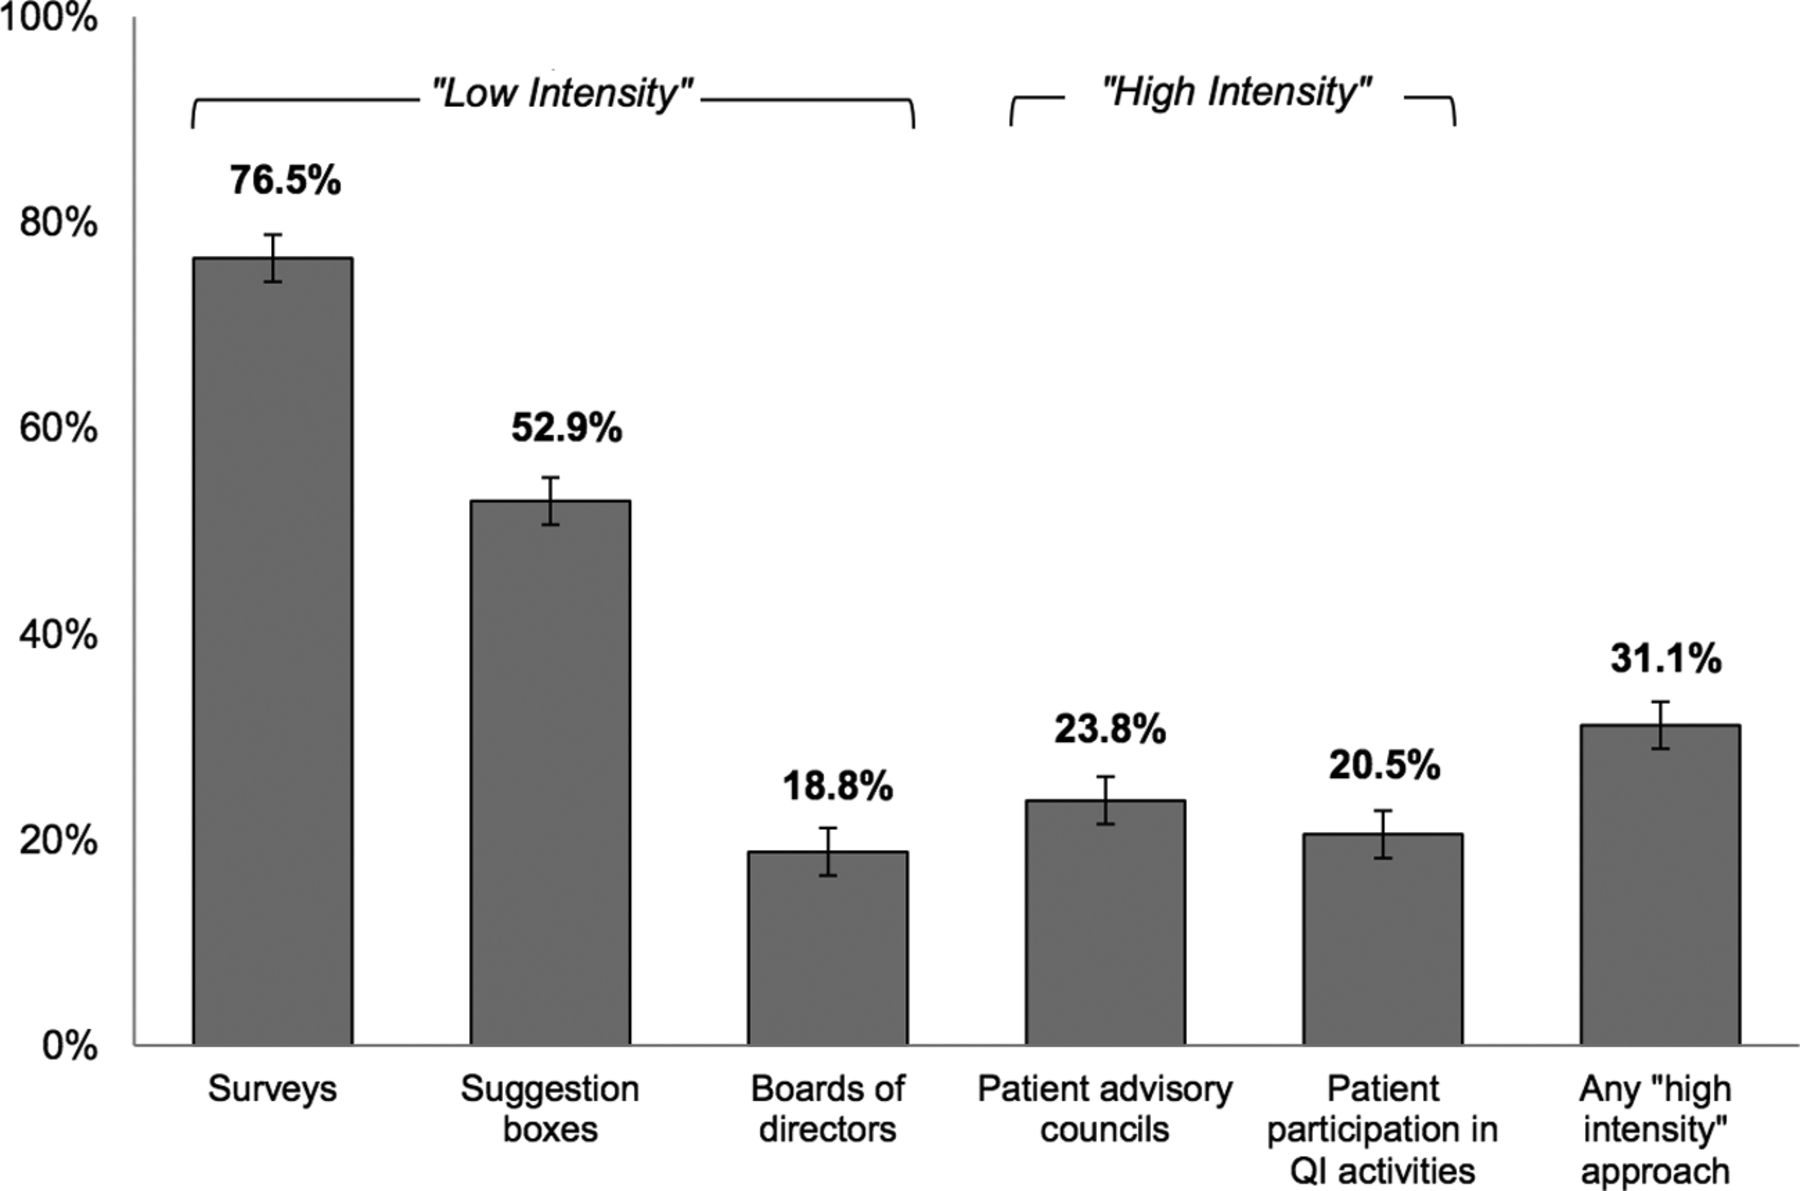
- Figure 2.
Percent of ambulatory primary care respondents reporting practice-level patient engagement activities. QI, quality improvement.


Tables
- Table 1.
Demographic Differences between Low and High Patient Engagement (Unadjusted, Raw Percentages), Restricted to Respondents in Ambulatory Care Who Responded to Patient-Centered Medical Home Survey Module
Factor Level All Respondents, N = 1368 Low-Intensity Patient Engagement N = 942 High-Intensity Patient Engagement N = 426 P value* Sex, N (column %) Female 569 (41.6%) 368 (39.1%) 201 (47.2%) .005 Male 799 (58.4%) 574 (60.9%) 225 (52.8%) Age, mean (SD) 51.4 (9.0) 51.5 (9.0) 51.2 (9.0) .61 Race, N (column %) American Indian or Alaska Native 13 (1.0%) 7 (0.7%) 6 (1.4%) .044 Asian 208 (15.2%) 133 (14.1%) 75 (17.6%) Black or African American 79 (5.8%) 46 (4.9%) 33 (7.7%) Native Hawaiian or other Pacific Islander 6 (0.4%) 3 (0.3%) 3 (0.7%) Other 38 (2.8%) 25 (2.7%) 13 (3.1%) White 1024 (74.9%) 728 (77.3%) 296 (69.5%) Ethnicity, N (column %) Hispanic or Latino 77 (5.6%) 58 (6.2%) 19 (4.5%) .21 Non-Hispanic 1291 (94.4%) 884 (93.8%) 407 (95.5%) Practice size (small to large), N (column %) Solo practice 181 (13.2%) 153 (16.2%) 28 (6.6%) <.001 Small (2 to 5 providers) 516 (37.7%) 396 (42.0%) 120 (28.2%) Medium (6 to 20 providers) 443 (32.4%) 281 (29.8%) 162 (38.0%) Large (20+ providers) 228 (16.7%) 112 (11.9%) 116 (27.2%) Practice ownership, N (column %) Private/solo/group practice 752 (55.0%) 563 (59.8%) 189 (44.4%) <.001 Hospital/HMO based 265 (19.4%) 173 (18.4%) 92 (21.6%) FQHC or similar 168 (12.3%) 102 (10.8%) 66 (15.5%) Other 92 (6.7%) 62 (6.6%) 30 (7.0%) Academic practice 91 (6.7%) 42 (4.5%) 49 (11.5%) % Vulnerable patients, N (column %) <10% 370 (27.0%) 298 (31.6%) 72 (16.9%) <.001 10% to 50% 775 (56.7%) 509 (54.0%) 266 (62.4%) >50% 223 (16.3%) 135 (14.3%) 88 (20.7%) Census region, N (column %) Midwest 376 (27.5%) 243 (25.8%) 133 (31.2%) .002 Northeast 186 (13.6%) 133 (14.1%) 53 (12.4%) South 471 (34.4%) 352 (37.4%) 119 (27.9%) West 335 (24.5%) 214 (22.7%) 121 (28.4%) PCMH certification Stages, N (column %) Not applying 487 (35.6%) 393 (41.7%) 94 (22.1%) <.001 Applying 278 (20.3%) 195 (20.7%) 83 (19.5%) PCMH accredited 603 (44.1%) 354 (37.6%) 249 (58.5%) Number of non-MD disciplines represented on care team (0 to 7), mean (SD) 2.56 (2.06) 2.22 (1.93) 3.30 (2.16) <.001 Presence of care coordinator (yes or no/unsure), N (column %) No/unsure 500 (36.5%) 417 (44.3%) 83 (19.5%) <.001 Yes 868 (63.5%) 525 (55.7%) 343 (80.5%) Number of patient access attributes, mean (SD) 2.94 (1.04) 2.80 (1.07) 3.26 (0.91) <.001 Number of quality improvement activities, mean (SD) 3.10 (1.20) 2.89 (1.28) 3.57 (0.83) <.001 ↵* P values calculated for χ2 test for categorical variables and t test for continuous variables.
SD, standard deviation; HMO, Healthcare Maintenance Organization; FQHC, Federally Qualified Health Center; PCMH, Patient-Centered Medical Home; MD, Medical Doctor.
Predictor Model 1: High-Intensity Patient Engagement Including Structural Predictors and PCMH Certification Status, N = 1368; OR (95% CI) Model 2: High-Intensity Patient Engagement Including Structural Predictors and PCMH Subcomponents, N = 1368; OR (95% CI) Practice Size (ref: Solo practice) Small 1.32 (0.82, 2.11) 1.10 (0.67, 1.79) Medium 1.98 (1.22, 3.21) 1.42 (0.83, 2.41) Large 3.30 (1.96, 5.57) 2.07 (1.12, 3.82) Practice ownership (ref: private practice) Hospital 1.08 (0.78, 1.49) 1.02 (0.73, 1.43) FQHC 1.13 (0.74, 1.73) 1.21 (0.77, 1.91) Other 1.22 (0.74, 2.00) 1.22 (0.72, 2.09) Academic 1.58 (0.96, 2.59) 1.75 (1.05, 2.89) % Vulnerable patients served (ref: <10%) 10% to 50% 1.77 (1.29, 2.43) 1.71 (1.24, 2.36) >50% 1.83 (1.18, 2.84) 1.89 (1.19, 2.99) Census region (ref: Midwest) Northeast 0.65 (0.44, 0.98) 0.70 (0.46, 1.06) South 0.67 (0.49, 0.92) 0.74 (0.53, 1.02) West 0.90 (0.65, 1.25) 0.88 (0.63, 1.22) PCMH stage (ref: not applying) Applying 1.66 (1.16, 2.36) Accredited 2.19 (1.62, 2.97) Number of non-MD disciplines represented on care team (0 to 7 possible disciplines) 1.06 (0.98, 1.16) Care coordination (yes/no to having a care coordinator) 1.75 (1.28, 2.39) Access (0 to 4 patient access features) 1.11 (0.96, 1.30) Quality improvement activities (0 to 4 score) 1.56 (1.34, 1.81) PCMH, patient-centered medical home; OR, odds ratio; CI, confidence interval; FQHC, Federally Qualified Health Center; MD, medical doctor. Underlined odds ratios indicate P-value <.05.
Variable Question Text/Response Options Recoding/Analysis Notes Outcome Patient Engagement How do you, or your office practice, involve patients who are seen in your clinical site, or their families and caregivers, in practice improvement? High-intensity engagement = “Yes” to participation on an advisory group OR participation as volunteers Suggestion boxes Yes No Unsure Patient or family/caregiver surveys Yes No Unsure Participation on a governing board Yes No Unsure Participation on an advisory group dedicated to practice improvement (separate from a governing board) Yes No Unsure Participation as volunteers or workers on specific practice improvement projects Yes No Unsure Inclusion Criteria Practice Site My primary practice site is (select best option)… a. Correctional Facility Include if Practice Site = Free Standing Ambulatory Clinic OR Hospital Based Clinic b. Emergency Department c. Free Standing Ambulatory Clinic d. Hospice e. Hospital f. Hospital Based Clinic g. Not Applicable h. Nursing Home i. Other j. Patient's Home k. Public Health Department l. School m. Urgent Care Clinic n. Work Site Demographics/Predictors Race a. American Indian or Alaska Native b. Asian c. Black or African American d. Native Hawaiian or Other Pacific Islander e. White f. Other Ethnicity a. Non-Hispanic b. Hispanic or Latino Practice Size Which of the following describes your primary practice site size? (Select one) a. Solo practice “Other” free text recoded based on response or as missing. b. Small (2 to 5 Providers) c. Medium (6 to 20 Providers) d. Large (>20 Providers) e. Other free text Practice ownership Which of the following describe(s) your primary practice site ownership? (Select one) a. Private solo or group practice Private/solo/group practice if ownership = a b. Freestanding urgent care center c. Hospital emergency department Hospital/HMO based if ownership = c*, d, m d. Hospital outpatient department e. Ambulatory surgical center FQHC or similar if ownership = h, i, j, k, o f. Industrial outpatient facility g. Mental health center Academic practice if ownership = l h. Non-federal government clinic (eg, state, county, city, and maternal and child health) i. Federally Qualified Health Center or Look-Alike Other if ownership = b, e, f, g, n, p j. Rural Health Clinic k. Indian Health Service Institutional setting (School-based Clinic, Nursing home, prison) l. Academic Health Center/Faculty Practice m. Health maintenance organization (eg, Kaiser Permanente) n. Federal (Military, Veterans Administration/Department of Defense) o. Public Health Service p. Other (Free text) % Vulnerable patients What percentage of your patient population in your primary practice site is part of a vulnerable group (i.e. uninsured, Medicaid, homeless, low income, non-English speaking, racial/ethnic minority, or otherwise traditionally underserved group)? a. <10% b. 10% to 19% c. 20% to 29% d. 30% to 39% e. 40% to 49% Consolidate % vulnerable patients to 3 categories: f. >50% ∙ <10% ∙ 10% to 50% ∙ >50% Census Region Constructed based on respondent address PCMH Certification Stages Is your practice a certified PCMH? Yes Recode to 3 categories: No ∙ Certified ∙ Applying If not, are you considering applying? (only available if answers no to 1) ∙ Not Applying a. Yes ∙ b. No ∙ Disciplines on Care team The following type of provider works at my practice: a. Licensed Social Worker Recode: sum of “Yes” responses (possible range = 0 to 4) b. Psychologist c. Psychiatric Nurse Practitioner d. Pharmacist Care Coordinator In my primary practice site, providers: Have access to someone who functions as a care coordinator or provides patient population management services. Recode “Unsure” to “No” Yes No Unsure Access Providers regularly communicate with patients via e-mail Yes Recode: sum of “Yes” responses (possible range = 0 to 4) No Unsure Patients can be seen outside of the hours 8AM-5PM, Mon-Fri Yes No Unsure Patients can receive telephone advice on clinical issues Yes No Unsure Patients have access to an interactive practice website/patient portal Yes No Unsure Quality Improvement Providers participate in quality improvement collaboratives Yes recode: sum of “Yes” responses (possible range = 0 to 4) No Unsure Providers are given regular performance feedback on measures of chronic disease care Yes No Unsure Providers regularly use decision support tools for the care of chronic disease Yes No Unsure In the last year have you personally participated in a quality improvement project? Yes No ↵* Respondents solely working in Hospital emergency department were ultimately excluded based on variable “Practice Site”.
Stata code: pca PPrac_NP_Rc2 PPrac_RN_Rc2 PPrac_LPN_Rc2 PPrac_PA_Rc2 PPrac_BehaviorSpec_Rc2 PPrac_SocialWork_Rc2 PPrac_CareCoordinator_Rc2 PPrac_PtPortal_Rc2 PPrac_PhoneAdvice_Rc2 PPrac_EmailPts_Rc2 PPrac_ExtendedHours_Rc2 PPrac_QualFeedback_Rc2 PPrac_QI_Rc2 QILastYear_Rc2 PPrac_DecisionSupport_Rc2, components(4) Variable Comp1 Comp2 Comp3 Comp4 Unexplained PPrac_NP_Rc2 0.1944 0.2971 0.1974 0.0271 0.6133 PPrac_RN_Rc2 0.2468 0.3871 −0.0454 −0.0950 0.4168 PPrac_LPN_∼2 0.2234 0.3222 −0.0433 −0.1101 0.5613 PPrac_PA_Rc2 0.1470 0.2752 0.4232 0.2149 0.5032 PPrac_Beha∼2 0.2595 0.3118 −0.2016 −0.1875 0.4479 PPrac_Soci∼2 0.2342 0.3728 −0.2658 −0.0861 0.3916 PPrac_Care∼2 0.3274 −0.0803 −0.1128 −0.0059 0.5817 PPrac_PtPo∼2 0.2614 −0.2009 0.3008 −0.4180 0.3793 PPrac_Phon∼2 0.1993 −0.2768 0.2751 −0.2925 0.5065 PPrac_Emai∼2 0.2823 −0.2225 0.1163 −0.3855 0.4268 PPrac_Exte∼2 0.1580 0.0625 0.5932 0.2876 0.4347 PPrac_QI_Rc2 0.3386 −0.1373 −0.1050 0.3358 0.4111 PPrac_Qual∼2 0.3547 −0.2576 −0.2461 0.1465 0.3 QILastYear∼2 0.2139 −0.1112 0.0277 0.4970 0.5493 PPrac_Deci∼2 0.3187 −0.2678 −0.2237 0.1284 0.3921 rotate, orthogonal varimax.
Variable Comp1 Comp2 Comp3 Comp4 Unexplained PPrac_NP_Rc2 0.2688 −0.0484 0.0222 0.3011 0.6133 PPrac_RN_Rc2 0.4620 −0.0331 0.0015 0.0850 0.4168 PPrac_LPN_∼2 0.4035 −0.0293 0.0288 0.0568 0.5613 PPrac_PA_Rc2 0.1181 −0.0509 −0.0348 0.5522 0.5032 PPrac_Beha∼2 0.4775 0.0128 0.0428 −0.1013 0.4479 PPrac_Soci∼2 0.5026 0.0420 −0.0886 −0.0983 0.3916 PPrac_Care∼2 0.1470 0.2888 0.1411 −0.0376 0.5817 PPrac_PtPo∼2 0.0097 −0.0486 0.6056 0.0690 0.3793 PPrac_Phon∼2 −0.1054 0.0140 0.5114 0.0682 0.5065 PPrac_Emai∼2 0.0468 0.0521 0.5308 −0.0684 0.4268 PPrac_Exte∼2 −0.1020 0.0282 0.0713 0.6687 0.4347 PPrac_QI_Rc2 0.0225 0.4907 −0.0655 0.1081 0.4111 PPrac_Qual∼2 0.0257 0.5043 0.0689 −0.1203 0.3 QILastYear∼2 −0.1010 0.4331 −0.1939 0.2655 0.5493 PPrac_Deci∼2 −0.0029 0.4679 0.0782 −0.1215 0.3921 Comp 1: interdisciplinary team
Comp 2: quality/safety
Comp 3: access
Comp 4: care coordination
Variable Comp1 Comp2 Comp3 Comp4 Unexplained PPrac_NP_Rc2 0.2751 −0.0438 0.0238 0.3162 0.6133 PPrac_RN_Rc2 0.4647 −0.0240 0.0037 0.1099 0.4168 PPrac_LPN_∼2 0.4056 −0.0208 0.0306 0.0786 0.5613 PPrac_PA_Rc2 0.1287 −0.0515 −0.0332 0.5594 0.5032 PPrac_Beha∼2 0.4773 0.0238 0.0453 −0.0761 0.4479 PPrac_Soci∼2 0.5024 0.0513 −0.0855 −0.0725 0.3916 PPrac_Care∼2 0.1512 0.2948 0.1471 −0.0315 0.5817 PPrac_PtPo∼2 0.0124 −0.0382 0.6053 0.0725 0.3793 PPrac_Phon∼2 −0.1025 0.0206 0.5116 0.0648 0.5065 PPrac_Emai∼2 0.0481 0.0627 0.5320 −0.0642 0.4268 PPrac_Exte∼2 −0.0882 0.0245 0.0737 0.6643 0.4347 PPrac_Qual∼2 0.0307 0.5071 0.0779 −0.1228 0.3 PPrac_QI_Rc2 0.0314 0.4900 −0.0561 0.1053 0.4111 QILastYear∼2 −0.0906 0.4269 −0.1857 0.2562 0.5493 PPrac_Deci∼2 0.0015 0.4702 0.0863 −0.1252 0.3921 Detailed stata code and codebook available upon author request.
- Appendix C.
Prevalence of Patient Engagement Activities in Entire ABFM Ambulatory Practice Sample (N = 6,900) Versus Those Who Completed Patient-Centered Medical Home Module (N = 1,368)
Patient Engagement Modality N = 6900 (95% CI) N = 1368 (95% CI) Difference Patient feedback survey 0.7566667 (0.7465396 to −0.7667937) 0.7653509 (0.7428661 to 0.7878356) −0.0086842 Patient suggestion box 0.5318841 (0.5201076 to −0.5436606) 0.5285088 (0.5020231 to 0.5549945) 0.0033753 Patient advisory council 0.23 (0.2200679 to 0.2399321) 0.2375731 (0.2149919 to 0.2601543) −0.0075731 Patient membership on governing board 0.1823188 (0.1732063 to 0.1914314) 0.1878655 (0.1671409 to 0.2085901) −0.0055467 Other 0.0352174 (0.030867 to 0.0395677) 0.0416667 (0.0310643 to 0.052269) −0.0064493 Analysis conducted 9/11/17.
CI, confidence interval.
In this issue


Jump to section
Related Articles
Cited By...
- Comparative Analysis of Three Surveys on Primary Care Providers Experiences with Interoperability and Electronic Health Records
- The American Board of Family Medicine's Data Collection Method for Tracking Their Specialty
- Health Care Integration and Coordination with Emphasis on Mental Health, but Not for Medical Marijuana