
Article Figures & Data
Figures
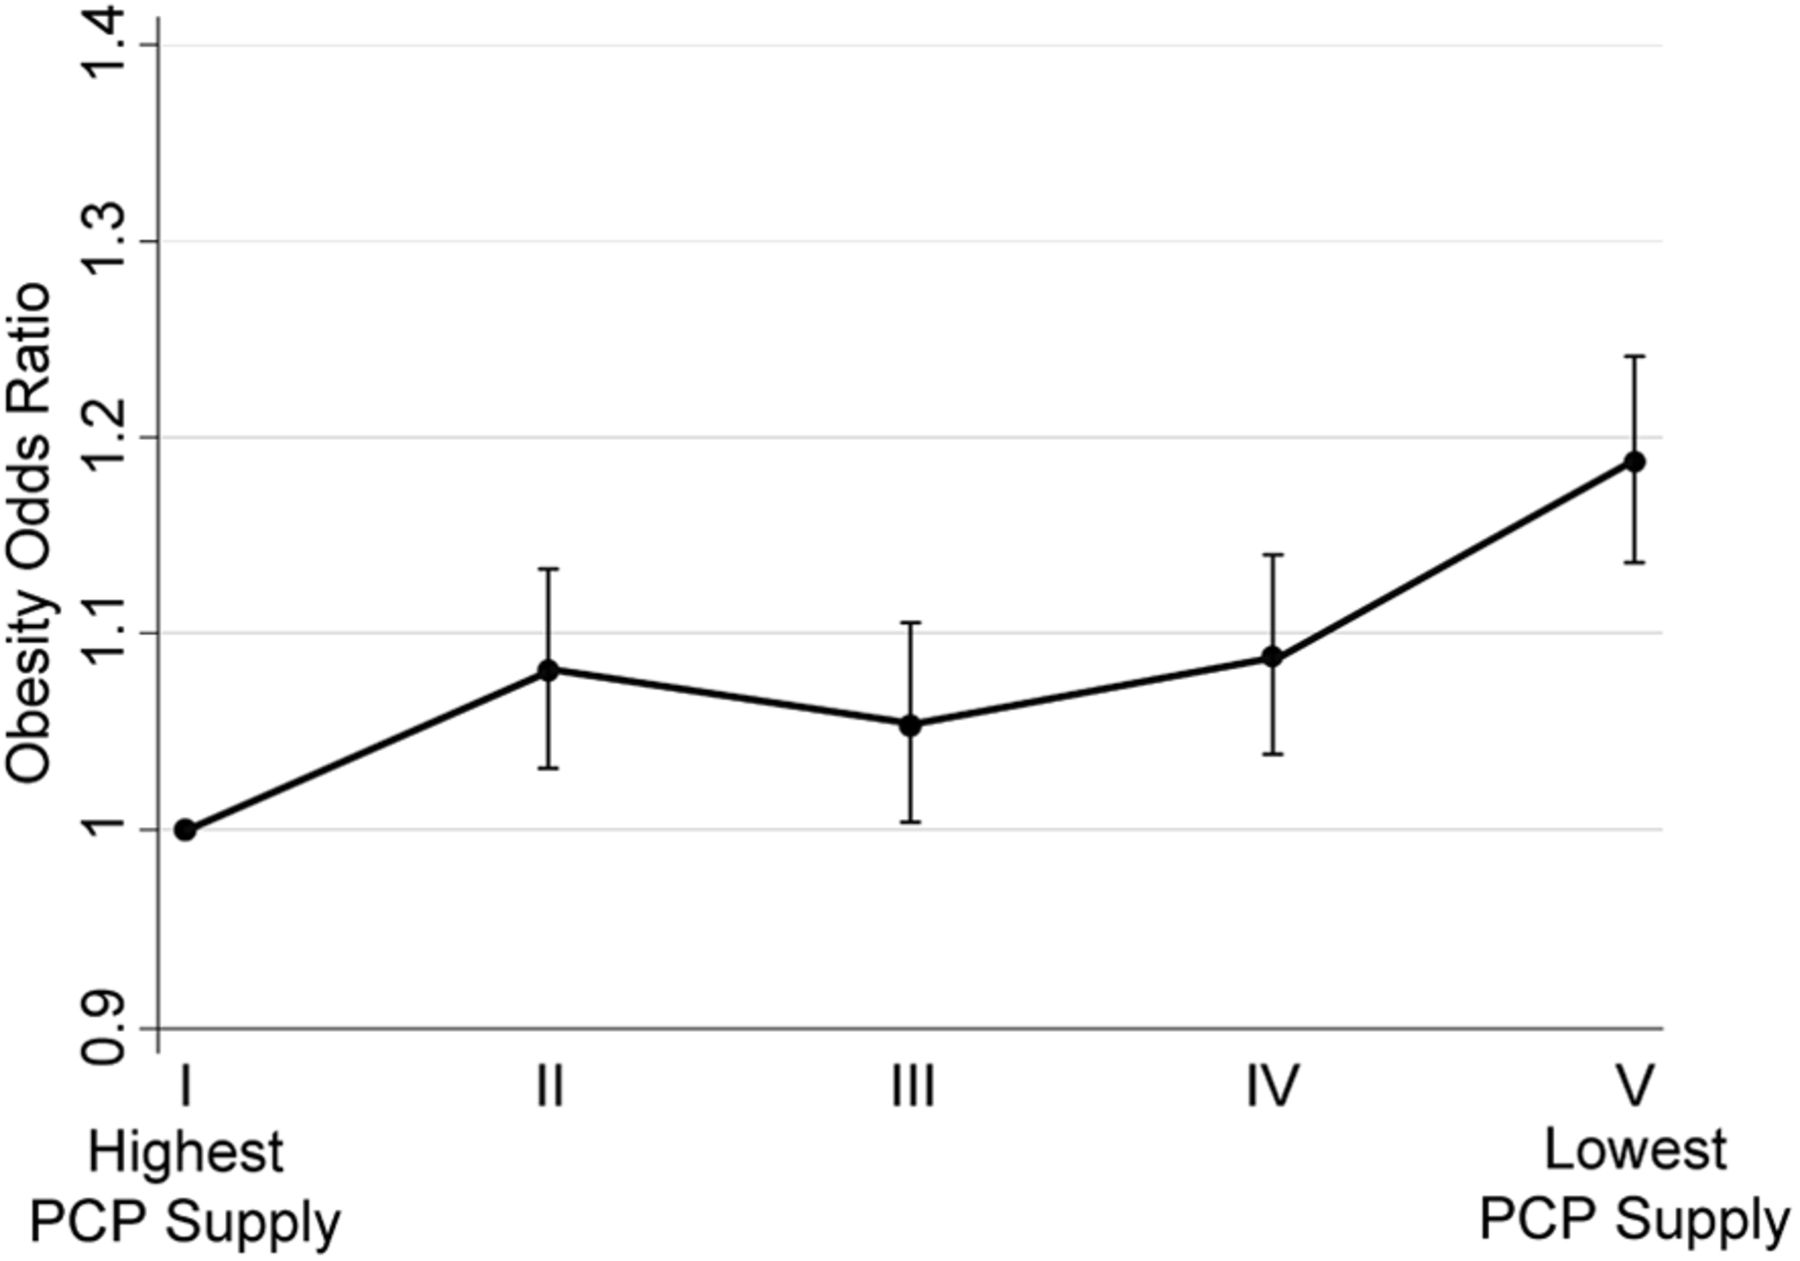
- Figure 1.
Obesity odds ratios across quintiles of US counties from the highest to lowest primary care physician (PCP) supply. Obesity odds ratios are based on a model that controls for individual and county characteristics. Obesity is defined as a body mass index >30 kg/m2. Population-to-PCP ratios varied in each quintile: I (highest PCP supply), 339–1232 people/PCP; II, 1233–1430 people/PCP; III, 1431–1657 people/PCP; IV, 1658–2126 people/PCP; V (lowest PCP supply) >2126 people/PCP. Data are from the 2012 Behavioral Risk Factor Surveillance System, the 2012 AMA Physician Masterfile, and 2010 Census estimates of county population.
Tables
- Table 1. Distribution of Individual and County-Level Variables by Quintile of Primary Care Physician Supply
Quintile I (Highest PCP Supply) Quintile II Quintile III Quintile IV Quintile V (Lowest PCP Supply) Mean Individual variables Obesity prevalence* 25.8 27.1 26.8 28.2 30.8 27.7 Demographic Mean age (years) 47.5 47.7 47.6 47.6 47.5 47.6 Is a parent 33.9 36.2 36.8 38.6 38.6 36.8 Is insured 84.8 85.0 83.0 80.3 79.4 82.5 Education <High school education 12.1 11.5 13.3 16.1 16.9 14 High school graduate 25.5 27.2 28.1 29.4 32.4 28.5 Some college 30.1 31.0 30.9 31.0 31.2 30.8 College/postgraduate 32.3 30.2 27.5 23.5 19.4 26.6 Race/ethnicity White 66.4 67.0 63.5 62.4 68.7 65.6 Black 13.4 14.3 12.4 10.6 9.5 12.0 Hispanic 13.1 8.4 15.7 19.8 16.7 14.8 Other 7.1 10.2 8.4 7.1 5.1 7.6 Income ($/year) <15,000 5.1 4.6 5.1 5.8 6.1 5.4 <20,000 7.4 6.8 7.3 7.3 8.1 7.4 <25,000 7.9 7.8 7.5 8.9 9.1 8.2 <35,000 9.2 9.2 9.6 9.7 10.1 9.6 <50,000 12.2 12.5 12.4 12.4 13.0 12.5 <75,000 13.3 14.1 13.0 13.3 14.0 13.5 ≥75,000 27.5 28.8 27.5 24.3 21.5 25.9 Smoking history Current smoker 18.0 18.4 17.6 18.4 20.9 18.6 Former smoker 25.3 25.2 25.2 24.8 24.4 25.0 Never smoker 55.1 55.0 55.9 55.5 53.4 55.0 County-level variables Black category Low 11.7 8.8 6.0 7.2 16.6 10.1 Low/medium 15.6 16.5 18.8 13.9 17.7 16.5 Medium 17.9 13.4 25.2 27.6 25.4 21.9 Medium/high 24.8 32.1 23.9 30.9 18.7 26.1 High 30.0 29.3 26.2 20.4 21.7 25.5 In a metropolitan area 85.6 91.3 90.0 81.2 68.9 83.4 Poverty Low 17.3 27.9 22.5 20.7 20.6 21.8 Low/mid 30.0 22.4 22.7 14.2 20.9 22.0 Mid/high 32.6 27.1 30.2 44.5 23.5 31.6 High 20.1 22.5 24.6 20.6 35.1 24.6 Data are percentages unless otherwise indicated (N = 392,535 individuals).
↵* Obesity is defined as a body mass index ≥30 kg/m2.
Data sources: 2012 Behavioral Risk Factor Surveillance System, 2012 AMA Masterfile, 2010 Census estimates, 2003 rural-urban continuum codes, 2012–2013 area resource files.
- Table 2. Obesity Odds Ratios by Individual and Contextual Variables from the Multivariate Regression Model That Adjusted for Individual and County-Level Variables
Variables Odds Ratio 95% Confidence Interval PCP supply in county of residence Quintile 1 (most access) 1.000 Index Quintile 2 1.081* 1.031–1.133 Quintile 3 1.053† 1.004–1.105 Quintile 4 1.088* 1.039–1.139 Quintile 5 (least access) 1.187* 1.136–1.241 Individual variables Demographic Age 1.120* Education Some high school 1.080* 1.023–1.141 High school graduate 1.00 Index Some college 0.966 0.931–1.002 College graduate 0.668* 0.642–0.694 Parental status No children 1.00 Index Parent 1.063* 1.023–1.104 Race/ethnicity Non-Hispanic white 1.00 Index Black 1.611* 1.527–1.701 Hispanic 1.124* 1.061–1.191 Other race 0.681* 0.631–0.735 Marital status Married 1.00 Index Never married 1.048 0.999–1.100 Divorced 0.993 0.956–1.030 Insured** 1.076 1.025–1.130 Income ($/year) <15,000 1.119* 1.025–1.130 15,000–20,000 1.022† 1.025–1.222 20,000–25,000 1.002 0.924–1.086 25,000–35,000 0.890* 0.821–0.966 35,000–50,000 0.827* 0.766–0.894 50,000–75,000 0.842* 0.766–0.894 >75,000 0.659* 0.682–0.713 Smoking status Never smoker 1.00 Index Smoker 0.768* 0.735–0.802 Former smoker 1.175* 1.136–1.215 County-level variables Black race (%) 1.042 0.916–1.185 Rural-urban continuum codes 1 (Most urban) 1.000 Index 2 1.133* 1.089–1.178 3 1.171* 1.117–1.227 4 1.222* 1.156–1.292 5 1.179* 1.098–1.265 6 1.187* 1.122–1.256 7 1.190* 1.110–1.274 8 1.081 0.950–1.231 9 (Most rural) 1.245* 1.070–1.448 County poverty Low 1.000 Index Low/mid 1.038 0.994–1.084 Mid/high 1.049 1.006–1.094 High 1.095 1.043–1.150 Data are based on N = 392,535 individuals. Obesity is defined as body mass index ≥30 kg/m2.
↵* P ≤ .05.
↵† P ≤ .01.
Data Sources: 2012 Behavioral Risk Factor Surveillance System, 2012 AMA Masterfile, 2010 Census estimates of county population, 2003 rural urban continuum codes, and 2012–2013 Area Resource Files.
PCP, primary care physician.


