
Article Figures & Data
Figures
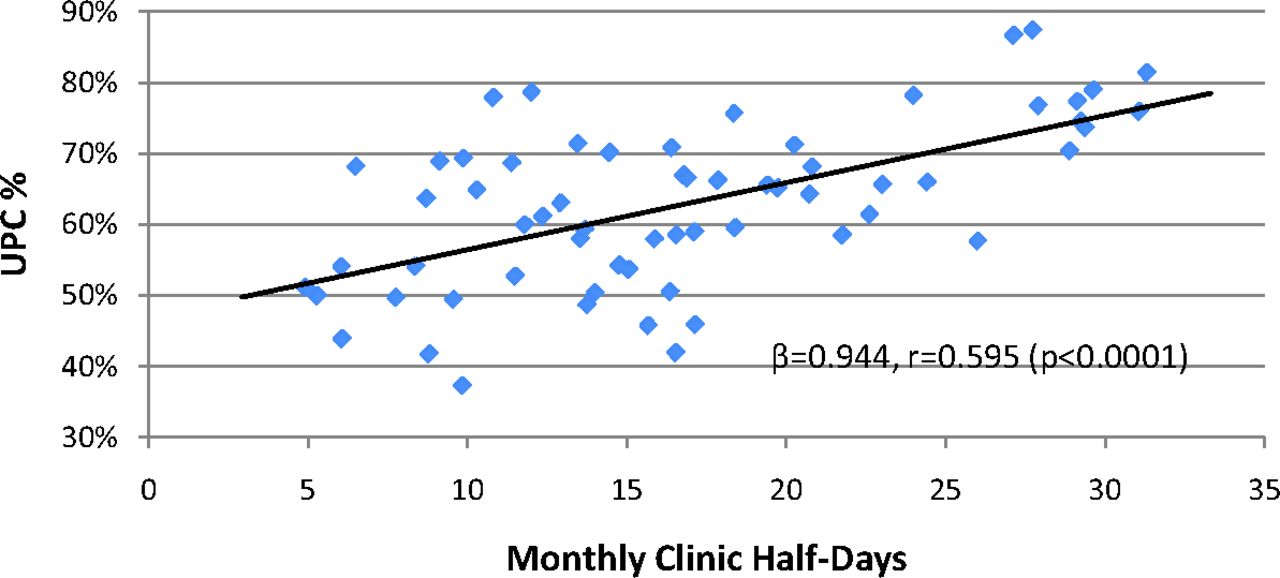
- Figure 1.
Simple linear regression of Usual Provider Continuity Index (UPC) (percentage of total clinic visits with assigned provider) on clinic frequency (monthly half-day clinic sessions held).
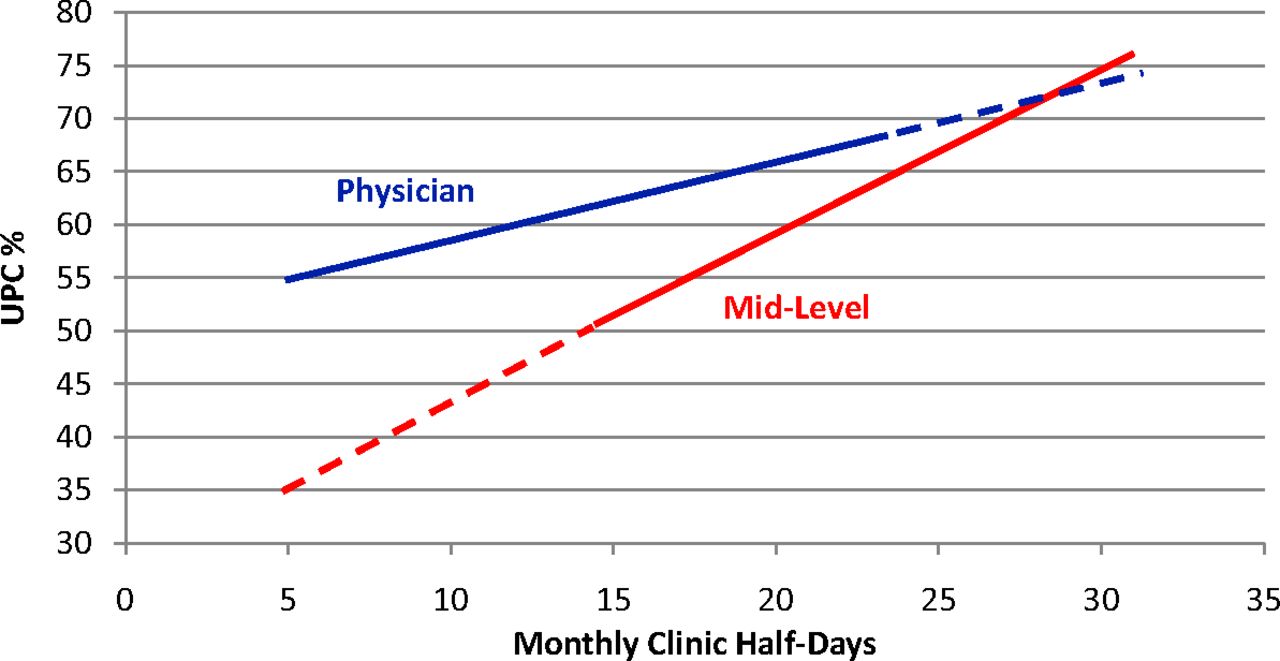
- Figure 2.
Simple linear regression of Usual Provider Continuity Index (UPC) (percentage of total clinic visits with assigned provider) on patient load (panel size-to-clinic frequency ratio).
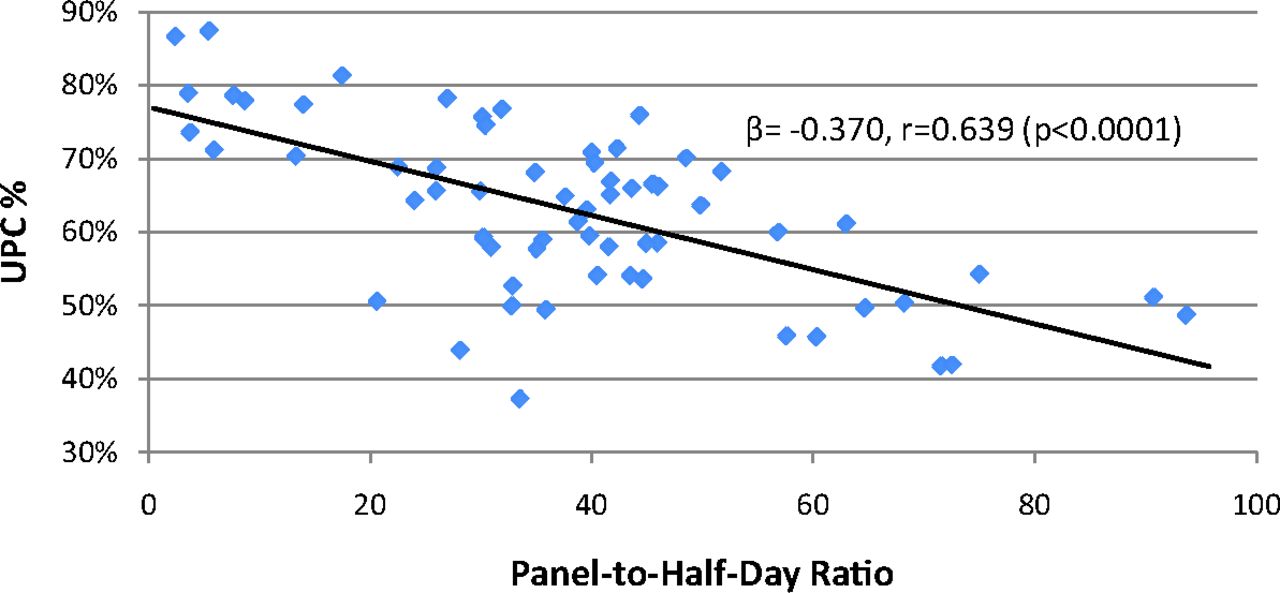
- Figure 3.
Multivariate prediction of Usual Provider Continuity Index (UPC) (percentage of total clinic visits with assigned provider) based on clinic frequency (monthly half-day clinic sessions held), stratified by provider type (physicians vs. mid-level providers). Predicted UPC calculated at fixed values for patient load (panel-to-half-day ratio, 38.2) and duration in practice (6.35 years). Dashed lines denote data extrapolation outside of the observed range of clinic frequency for either provider type.


Tables
- Table 1. Descriptive Summary of Outcome and Predictor Variables, Stratified by Provider Type
Variable Mean SD Min Max P* UPC (%)† All providers 62.92 11.55 37.30 87.40 Physician 60.97 9.84 37.29 78.64 .033 Mid-level 67.78 14.16 41.93 87.41 Clinic frequency (monthly half-day clinic sessions held) All providers 16.83 7.27 4.92 31.30 Physician 13.63 5.04 4.92 24.42 .000 Mid-level 24.85 5.63 15.06 31.30 Panel size (count of patients assigned to provider) All providers 577.4 315.8 65 1377 Physician 540.5 274.3 92 1288 .144 Mid-level 669.7 395.4 65 1377 Patient load (ratio of panel size to half-day clinic frequency) All providers 38.21 19.96 2.40 93.67 Physician 41.32 18.80 5.90 93.70 .049 Mid-level 30.41 21.22 2.41 72.55 Attendance ratio‡ All providers 1.01 0.26 0.56 2.15 Physician 1.04 0.30 0.56 2.14 .140 Mid-level 0.93 0.13 0.68 1.29 Duration in practice (years) All providers 6.35 6.38 0.42 24.92 Physician 7.19 6.85 0.67 24.92 .099 Mid-level 4.26 4.50 0.42 16.75 - Table 2. Simple Linear Regression of Usual Provider Continuity Index* on Predictor Variables
Predictor Variable Β 95% CI r P Clinic Frequency† 0.944 0.618–1.271 0.595 <.0001 Panel Size‡ −0.009 −0.018 to 0.000 0.209 .044 Patient Load§ −0.370 −0.483 to −0.256 0.639 <.0001 Attendance Ratio‖ 0.050 −0.06 to 0.162 0.115 .370 Duration in Practice¶ −0.265 −0.724 to 0.193 0.146 .252 - Table 3. Optimal Multivariate Linear Model for Prediction of Usual Provider Continuity Index*
Variables β 95% CI P† Clinic frequency 1.52 0.84–2.19 <.001 Patient load −0.32 −0.45 to −0.20 <.001 Duration in practice 0.61 0.27–0.95 .001 Provider type‡ 23.01 5.62–40.41 .010 Type and patient load interaction −0.81 −1.58 to −0.04 .039 Intercept§ 62.91 54.74–71.07 <.001 ↵* Percentage of total clinic visits with assigned provider.
↵† P values reflect partial F-tests for significance of individual terms within the model.
↵‡ Reference group is mid-level providers (mid-level = 0, physician = 1).
↵§ Data centered around mean clinic frequency of 16.8 monthly clinic half-days (mean clinic frequency for all providers).
Themes Subthemes Description 1. Clinic diversity 1.1 PCP assignment accuracy Clinics have different systems for ensuring that PCP fields are frequently updated and accurate. 1.2 Scheduling Clinics place variable importance on scheduling patients with their PCP rather than the first available provider. 1.3 Location/type University, FQHC, and rural clinics may have intrinsic differences in patient population and structure. 2. Provider diversity 2.1 Provider type Physician (MD/DO) and mid-level (PA/FNP) providers may have differences in both scope of practice and approach to care. 2.2 Provider sex Female and male providers may have differences in both scope of practice and approach to care. 2.3 Scope of practice Providers who provide maternity care, inpatient care, sports medicine, suboxone, resident precepting, etc., may have different UPC patterns than providers who solely conduct outpatient continuity clinics. 2.4 Nonclinical duties Providers with more academic/administrative responsibilities may have different UPC patterns than those with strictly clinical practices. 2.5 Clinic scheduling Providers with more open schedules or night/weekend clinics may have different UPC patterns than those with primarily prescheduled daytime clinics. 2.6 Location of residency Providers who trained at OHSU may have more developed panels for their year in practice than providers who trained elsewhere. 3. Patient diversity 3.1 Panel demographics SES, sex, race, ethnicity, age, medical complexity, visit frequency, and other panel demographics are likely to influence UPC for a given provider. 3.2 Importance of continuity to patient Some patients frequently change providers for a variety of reasons, making their PCP field relatively arbitrary. 4. Visit type 4.1 Acute care Acute care visits may not be as important as chronic or ongoing care in terms of actual continuity. 4.2 Nonoffice visits Current calculation of UPC does not take into account phone, E-mail, or MyChart encounters, where a meaningful interaction occurs without face-to-face contact. 5. Non-PCP continuity 5.1 Team continuity Patients may value continuity with a team of providers more than with a specific provider. 5.2 Clinic continuity Patients may value continuity with a particular clinic more than with an individual or team of providers. 5.3 Family continuity Continuity across families may be more important than continuity with individual patients. 6. Absences 6.1 Planned vs. unplanned Are all absences from clinic a diversion from continuity (eg, deliveries, inpatient), or is it just unplanned absences (eg, illness)? 6.2 New parent leave Specific extended absence that may behave differently than other absences in terms of continuity. DO, osteopathic doctor; FNP, family nurse practitioner; FQHC, federally qualified health center; MD, medical doctor; OHSU, Oregon Health & Sciences University; PA, physician assistant; PCP, primary care provider; UPC, Usual Provider Continuity Index.
In this issue


Jump to section
Related Articles
Cited By...
- What Humans Need
- Relational Continuity, Physician Payment, and Team-Based Primary Care in the Canadian Health Care System
- Direct Primary Care: Applying Theory to Potential Changes in Delivery and Outcomes
- How Evolving United States Payment Models Influence Primary Care and Its Impact on the Quadruple Aim
- Common Illnesses, Patient Physician Interactions, Continuity, and Practice Organization