
Article Figures & Data
Figures
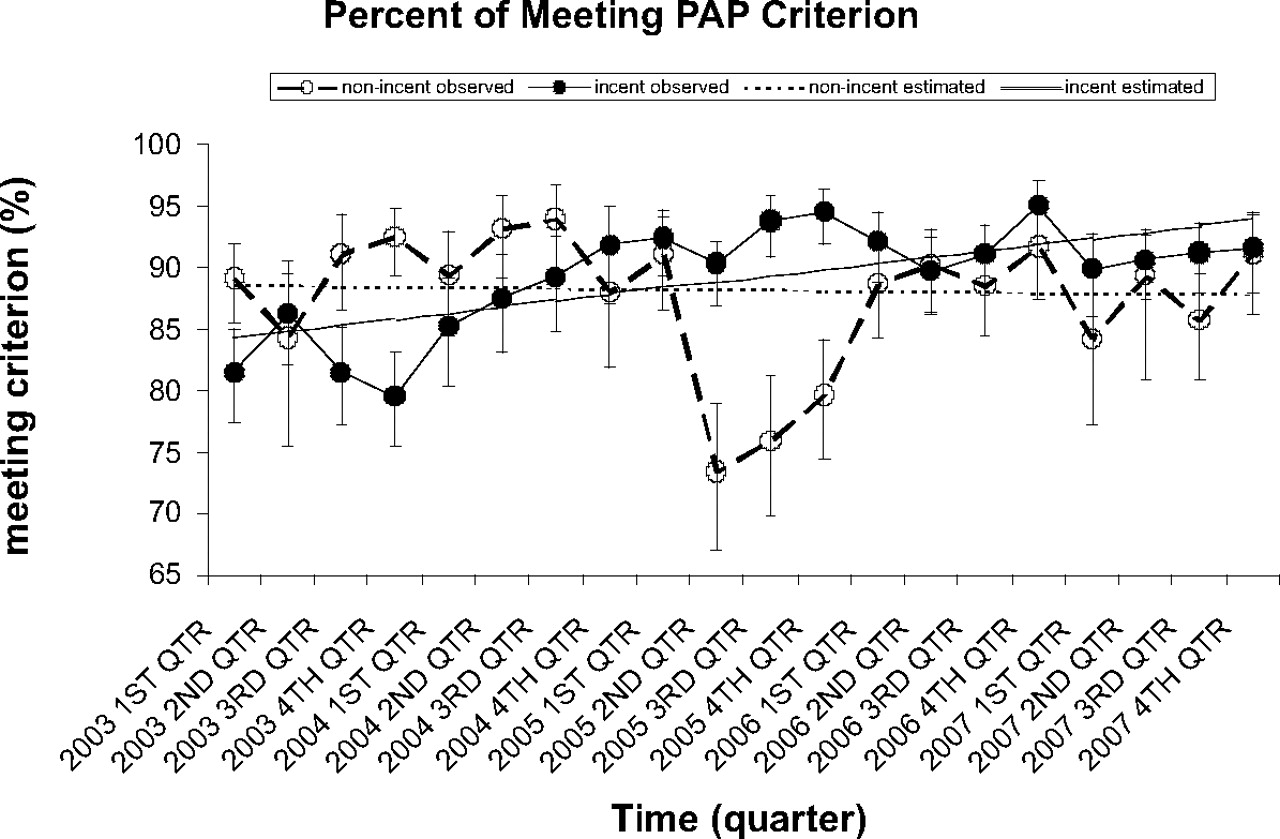
- Figure 1.
Observed and linear mixed model estimated percent of meeting Papanicolaou criterion by group over time.
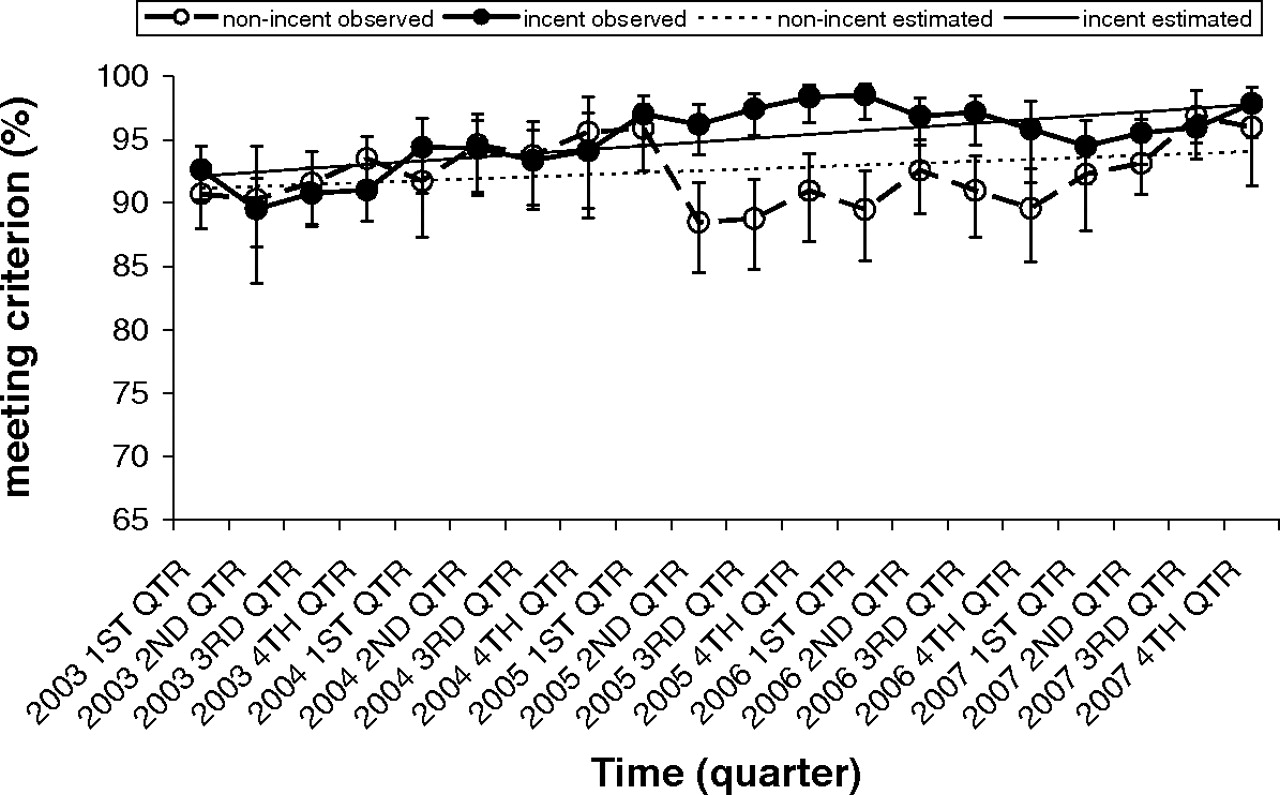
- Figure 2.
Observed and linear mixed model estimated percent of meeting mammography criterion by group over time.
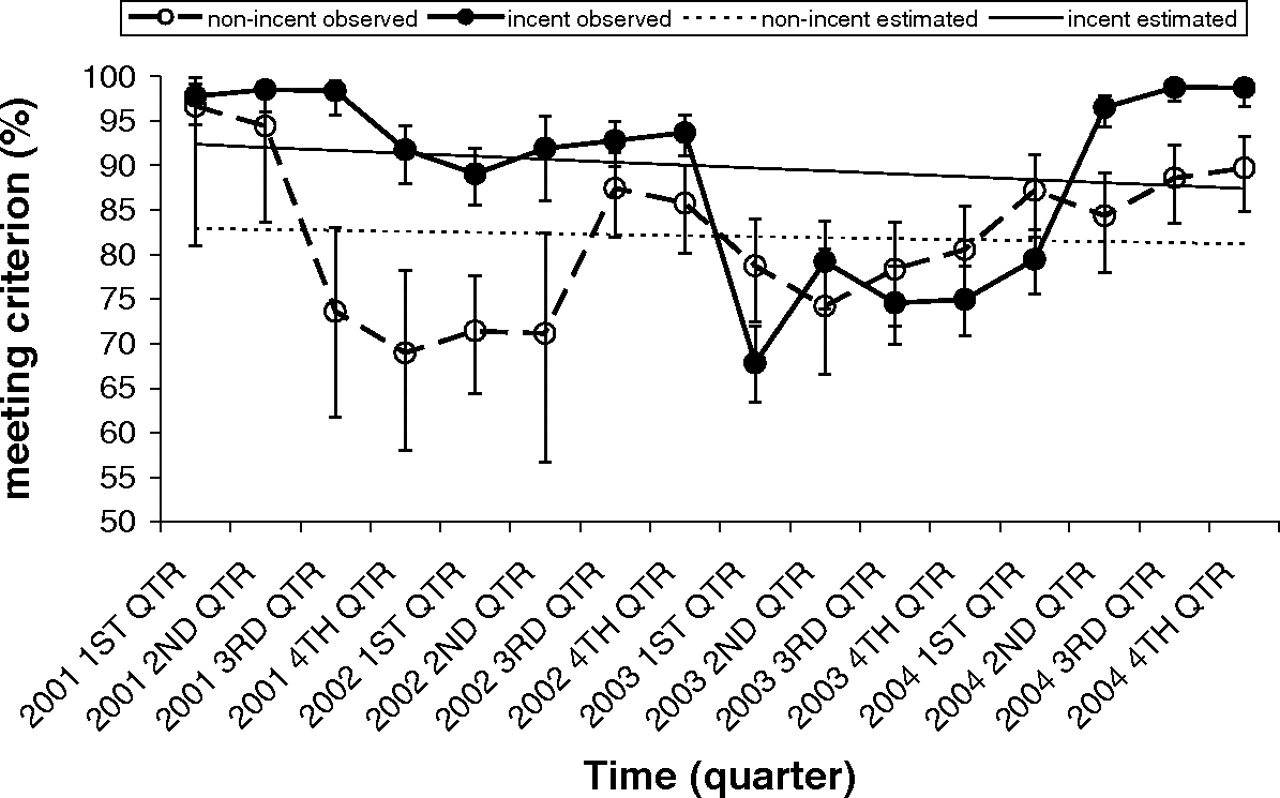
- Figure 3.
Observed and linear mixed model estimated percent of meeting pediatric immunization criterion by group over time.


Tables
- Table 1.
Papanicolaou Smears: Chart Reviewed and Percent of Meeting Criterion by Center by Time
Time Nonincentivized Group* Incentivized Group† P‡ Total Charts Reviewed (n) Charts Meeting Criterion (n [%]) Total Charts Reviewed (n) Charts Meeting Criterion (n [%]) 2003 1st quarter 405 361 (89.14) 443 361 (81.49) .187 2nd quarter 102 86 (84.31) 356 307 (86.24) .545 3rd quarter 236 215 (91.10) 389 317 (81.49) .010 4th quarter 387 358 (92.51) 450 358 (79.56) .002 2004 1st quarter 235 210 (89.36) 278 237 (85.25) .362 2nd quarter 251 234 (93.23) 289 253 (87.54) .214 3rd quarter 199 187 (93.97) 270 241 (89.26) .078 4th quarter 167 147 (88.02) 209 192 (91.87) .316 2005 1st quarter 246 224 (91.06) 435 402 (92.41) .390 2nd quarter 222 163 (73.42) 404 365 (90.35) .0003 3 rd quarter 237 180 (75.95) 420 394 (93.81) <.0001 4th quarter 285 227 (79.65) 423 400 (94.56) <.0001 2006 1st quarter 291 258 (88.66) 392 361 (92.09) .087 2nd quarter 328 296 (90.24) 417 374 (89.69) .922 3rd quarter 332 294 (88.55) 425 387 (91.06) .462 4th quarter 242 222 (91.74) 305 290 (95.08) .089 2007 1st quarter 152 128 (84.21) 335 301 (89.85) .573 2nd quarter 282 252 (89.36) 427 387 (90.63) .686 3rd quarter 280 240 (85.71) 421 384 (91.21) .420 4th quarter 205 187 (91.22) 323 296 (91.64) .844 * Nonincentivized had a higher percent of meeting Papanicolaou criterion during some early time periods: 3rd and 4th quarters of 2003 (P < .05 for all).
† Incentivized had a higher percent of meeting Papanicolaou criterion during some late time periods: 2nd, 3rd, and 4th quarters of 2005 (P < .05 for all).
‡ Within-clinic clustering adjusted.
Time Nonincentivized Group Incentivized Group P* Total Charts Reviewed (n) Charts Meeting Criterion (n [%]) Total Charts Reviewed (n) Charts Meeting Criterion (n [%]) 2003 1st quarter 571 518 (90.72) 651 603 (92.63) .366 2nd quarter 134 121 (90.30) 535 479 (89.53) .545 3rd quarter 392 359 (91.58) 638 579 (90.75) .588 4th quarter 615 575 (93.50) 669 609 (91.03) .227 2004 1st quarter 242 222 (91.74) 268 253 (94.40) .985 2nd quarter 223 211 (94.62) 298 281 (94.30) .796 3rd quarter 224 210 (93.75) 301 281 (93.36) .668 4th quarter 114 109 (95.61) 153 144 (94.12) .494 2005 1st quarter 267 256 (95.88) 370 359 (97.03) .552 2nd quarter 339 300 (88.50) 421 405 (96.20) .002 3rd quarter 338 300 (88.76) 429 418 (97.44) .011 4th quarter 299 272 (90.97) 369 363 (98.37) .0008 2006 1st quarter 314 281 (89.49) 404 398 (98.51) <.0001 2nd quarter 350 324 (92.57) 414 401 (96.86) .048 3rd quarter 344 313 (90.99) 422 410 (97.16) .026 4th quarter 288 258 (89.58) 192 184 (95.83) .196 2007 1st quarter 272 251 (92.28) 363 343 (94.49) .463 2nd quarter 350 326 (93.14) 448 428 (95.54) .260 3rd quarter 350 339 (96.86) 420 403 (95.95) .600 4th quarter 250 240 (96.00) 279 273 (97.85) .288 No difference was found between nonincentivized and incentivized before 2nd quarter 2005, whereas incentivized had a higher percent of meeting mammography criterion from 2nd quarter 2005 to 3rd quarter 2006 (P < .05 for all); no difference was found in 2007.
* Within-clinic clustering adjusted.
- Table 3.
Pediatric Immunization: Chart Reviewed and Percent of Meeting Criterion by Center by Time
Time Nonincentivized Group Incentivized Group P* Total Charts Reviewed (n) Charts Meeting Criterion (n [%]) Total Charts Reviewed (n) Charts Meeting Criterion (n [%]) 2001 1st quarter 30 29 (96.67) 226 221 (97.79) .582 2nd quarter 54 51 (94.44) 272 268 (98.53) .139 3rd quarter 72 53 (73.61) 248 244 (98.39) <.0001 4th quarter 87 60 (68.97) 316 290 (91.77) .055 2002 1st quarter 189 135 (71.43) 403 359 (89.08) .013 2nd quarter 52 37 (71.15) 149 137 (91.95) .002 3rd quarter 207 181 (87.44) 458 425 (92.79) .056 4th quarter 211 181 (85.78) 493 462 (93.71) .017 2003 1st quarter 207 163 (78.74) 488 331 (67.83) .092 2nd quarter 159 118 (74.21) 279 221 (79.21) .636 3rd quarter 208 163 (78.37) 405 302 (74.57) .775 4th quarter 216 174 (80.56) 495 371 (74.95) .853 2004 1st quarter 219 191 (87.21) 511 406 (79.45) .830 2nd quarter 179 151 (84.36) 489 472 (96.52) .0001 3rd quarter 228 202 (88.60) 488 482 (98.77) <.0001 4th quarter 224 201 (89.73) 320 316 (98.75) <.0001 No difference was found between nonincentivized and incentivized groups in the 1st and 2nd quarters of 2001. The incentivized group had a higher percent of meeting pediatric immunization criterion during the 3rd quarter of 2001; the 1st, 2nd, and 4th quarters of 2002 (P < .05 for all); and the 2nd to 4th quarters of 2004 (P < .05 for all).
* Within-clinic clustering adjusted.
Year Mean per Full Time Equivalent (US$) Median (US$) 2002 3905 3900 2003 5841 4834 2004 7904 6300 2005 9146 6504 2006 8617 6100


