
Abstract
Purpose:The efficacy of rewarding physicians financially for preventive services is unproven. The objective of this study was to evaluate the effect of a physician pay-for-performance program similar to the Medicare Physician Quality Reporting Initiative program on quality of preventive care in a network of community health centers.
Methods:A retrospective review of administrative data was done to evaluate a natural quasi-experiment in a network of publicly funded primary care clinics. Physicians in 6 of 11 clinics were given a financial incentive twice the size of the current Centers for Medicare and Medicaid Services’ incentive for achieving group targets in preventive care that included cervical cancer screening, mammography, and pediatric immunization. They also received productivity incentives. Six years of performance indicators were compared between incentivized and nonincentivized clinics. We also surveyed the incentivized clinicians about their perception of the incentive program.
Results:Although some performance indicators improved for all measures and all clinics, there were no clinically significant differences between clinics that had incentives and those that did not. A linear trend test approached conventional significance levels for Papanicolaou smears (P = .08) but was of very modest magnitude compared with observed nonlinear variations; there was no suggestion of a linear trend for mammography or pediatric immunizations. The survey revealed that most physicians felt the incentives were not very effective in improving quality of care.
Conclusion:We found no evidence for a clinically significant effect of financial incentives on performance of preventive care in these community health centers. Based on our findings and others, we believe there is great need for more research with strong research designs to determine the effects, both positive and negative, of financial incentives on clinical quality indicators in primary care.
A variety of strategies have been used to improve the quality of health care services delivered. Financial incentives based on performance have a long history of use in industry to increase productivity and achieve specific quality improvement targets. Their use in medicine for quality as opposed to financial performance has occurred only recently with the introduction of industrial management methods. Incentives have been used widely in ambulatory medical care to increase visit productivity.1 Productivity rates are often benchmarked to Medical Group Management Association standards for physicians via use of individual production-based compensation formulae. In recent years, there has been growing interest in applying this methodology to increase performance of physicians in achievement of specific quality targets, most often in preventive care and chronic disease management.
We conducted a retrospective analysis of a natural experiment using financial incentives in a system of safety-net community health centers staffed by 2 medical schools, only one of which used incentives.
Methods
Setting
The safety net system of 11 public community health centers in Houston/Harris County (Community Health Program [CHP]), administered by Harris County Hospital District, delivers approximately 600, 000 medical visits annually to low-income patients, many of whom have chronic disease. Physicians are contractually provided by 2 medical schools; one school staffs 6 primary care health centers and the other staffs 5. As part of a system-wide quality improvement program, data are collected monthly at each clinic for a variety of standard preventive health indicators. A unified ambulatory quality assurance (QA) staff conducts audits, compiles reports, and recommends changes for all clinics, regardless of medical school affiliation.
Specific quality indicators and their respective targets (generally 80% to 90%) are chosen jointly by the health care system and medical representatives from the 2 affiliated medical schools. The indicators and targets are modified periodically based on evidence from such sources as the US Preventive Services Task Force and relevance to the local population. Performance improvement targets were set annually for the clinic system and adjusted up incrementally as performance improved over time. The county hospital district employs QA nurses who abstract data from patient medical records monthly and tabulate performance outcomes. These results are made available to health center medical directors and staff, as well as governing bodies with specific recommendations for improvement.
Quality improvement initiatives and reviews were directed at the entire system of clinics, not by individual medical school. Physicians were given regular feedback about performance and recommendations to improve based on specific audit results. QA nurse reviewers reported charts not meeting criteria and why to the patient’s primary care physician as well as to the medical director for review. Performance by health center was reported to physicians via their medical director quarterly and in an annual report that compared clinics. An expectation of physicians was to improve care by ordering or performing the designated tests at a high rate. All quality initiatives were directed at the entire ambulatory network and not one group of clinics selectively. The clinics did not have an electronic health record during the study period. This study was approved by the Institutional Review Board for the Protection of Human Subjects at Baylor College of Medicine.
Intervention
In 2002, one of the 2 medical schools, which had been using financial incentives based on individual physician visit and relative value unit (RVU) productivity in the clinics it staffed, added performance on 3 quality indicators in preventive care to the incentive formula. One third of the available incentive pool was awarded for each of the following: quality indicators, RVU productivity, and visit volume performance.
Quality Indicators
One third of the total incentive allocation was based on quality indicator performance. The financial incentive was paid to eligible members of the group if the clinic as a whole met or exceeded the thresholds for 2 of 3 indicators: Papanicolaou smears, mammography, and childhood immunizations. The thresholds, usually 80% to 90%, were determined by the hospital district Performance Improvement Committee and were changed each year based on previous performance. The potential $4000 annual payout based on achieving quality targets represented approximately 3% to 4% of a provider’s total salary. If the clinic reached 2 out of 3 targets, all physicians in the clinic received the incentive to encourage teamwork. All physicians were aware of the incentive program because results were reviewed regularly during monthly staff meetings. The incentivized indicators intentionally were not emphasized more in the quality program than other nonincentivized indicators (prostate screening, cholesterol, adult immunization, tuberculosis screening, and diabetic foot, eye, and glycated hemoglobin) to avoid selective performance of those incentivized indicators. The maximum potential incentive per physician was $12, 000 annually, representing $4000 each for quality, RVU productivity, and visit productivity.
Participants and Data Collection
Approximately 110 physicians and 2 physician assistants from the 2 medical schools practiced actively at CHP clinics. The faculty staffed by one medical school represented the intervention group; staff from the other medical school represented the control group. The quality indicator data were abstracted from charts of patients seen in the CHP, which, for convenience reasons, primarily sampled patients with chronic disease for the adult indicators because they represented a majority of patients who were seen on an ongoing basis. The measures monitored consisted of patients receiving appropriate screening for cholesterol, diabetes control (glycated hemoglobin), diabetic eye and foot issues, cervical cancer (Papanicolaou smear), prostate cancer, and breast cancer (mammography), along with pediatric and adult immunizations and tuberculosis testing. Only cervical cancer screening, mammography, and pediatric immunizations were used in the incentive formula.
The information technology department provided a monthly sample for audit of all clinics balanced for age and provider panel based on the specific indicators to be reviewed. Seventy-five charts per physician were targeted for each monthly review. Exclusions based on age, sex, etc (as appropriate for individual indicators) led to actual review of 250 to 500 charts per clinic per month, depending on the indicator. Performance was reported as the proportion of tests completed monthly for each clinic. Initial data for 2001 for pediatric immunizations and 2002 for all 3 indicators were used as baseline. For years 2001 to 2004, immunization data was used for incentive effect, and for the years 2003 to 2007, Papanicolaou smears and mammography were used. The financial incentive ended in 2007.
Survey
A survey created through Surveymonkey.com was offered to all CHP physicians. It asked them to rate the effectiveness of the incentive program in terms of quality of care by themselves and others, and the relative influence of the incentive program on the quality of care compared with other factors.
Statistical Analyses
We tabulated data quarterly by clinic as the number of audited charts meeting each criterion and the total number of audited charts. A χ2 test was used to assess the between-group difference (incentivized versus nonincentivized) in the proportion of charts meeting the criterion (%) during each quarter. We modeled the proportion of a clinic’s audited charts that were up to date on each criterion (Papanicolaou smears, mammograms, and pediatric immunizations) using mixed effects models with time in quarters of a year as a linear factor (quarter = 0, 1, 2, . . ., 19) and group as the independent variable. Models were constructed with a first-order auto regressive variance–covariance structure specified to account for the within-center correlations. The variance–covariance structure was chosen according to Akaike information criteria. In the mixed-model, group and time were treated as fixed effects and individual clinics were treated as random effects. A group by time interaction test was used to evaluate if the slopes for control and intervention groups were different. The multivariate normality assumption for the dependent variable (% of charts meeting the criterion) by group by time was assessed by Shapiro-Wilk tests and was regarded fulfilled. The parameters were estimated via restricted maximum likelihood. Proc Mixed in SAS software version 9.1 (SAS Institute, Inc., Cary, NC) was used to conduct the modeling. We used the standard, two-sided P < .05 criterion to define statistical significance, whereas .05 < P < .10 was considered marginally statistically significant.
We performed post hoc statistical power analysis as follows. With a sample size of 6 clinics in group 1 and 5 clinics in group 2, an intraclass correlation of 0.85 estimated from pediatric immunization data, and 2-sided significance level of .05, we had an 80% power to detect a mean difference between the 2 groups of 11% at the last time point of 16 repeated assessment times, which corresponded to an effect size of 0.5 (considered a moderate effect size). The power and sample size calculation was performed using a Fortran program rmass2 developed by Hedeker and Gibbons.2
A generalized estimating equations model was used to account for the within-center correlations at each time point. Charts reviewed from the same center were assumed to have a similar pattern with respect to the response, whether they met the criterion or not. An exchangeable working correlation was selected, given that the level of chart was much more than the level of the main effect, group, and incentivized versus nonincentivized.
Results
Performance on Quality Measures
Rates of Papanicolaou screening, mammography, and child immunizations show nonsignificant differences between the groups at baseline except for Papanicolaou screening, for which nonincentivized group had a higher percent of meeting the criterion at baseline. Both groups had gradual improvements that converged over time. There was a transient decrease in both groups’ performance in 2002. Overall, there was no clinically significant effect of incentives on performance.
Papanicolaou Smears
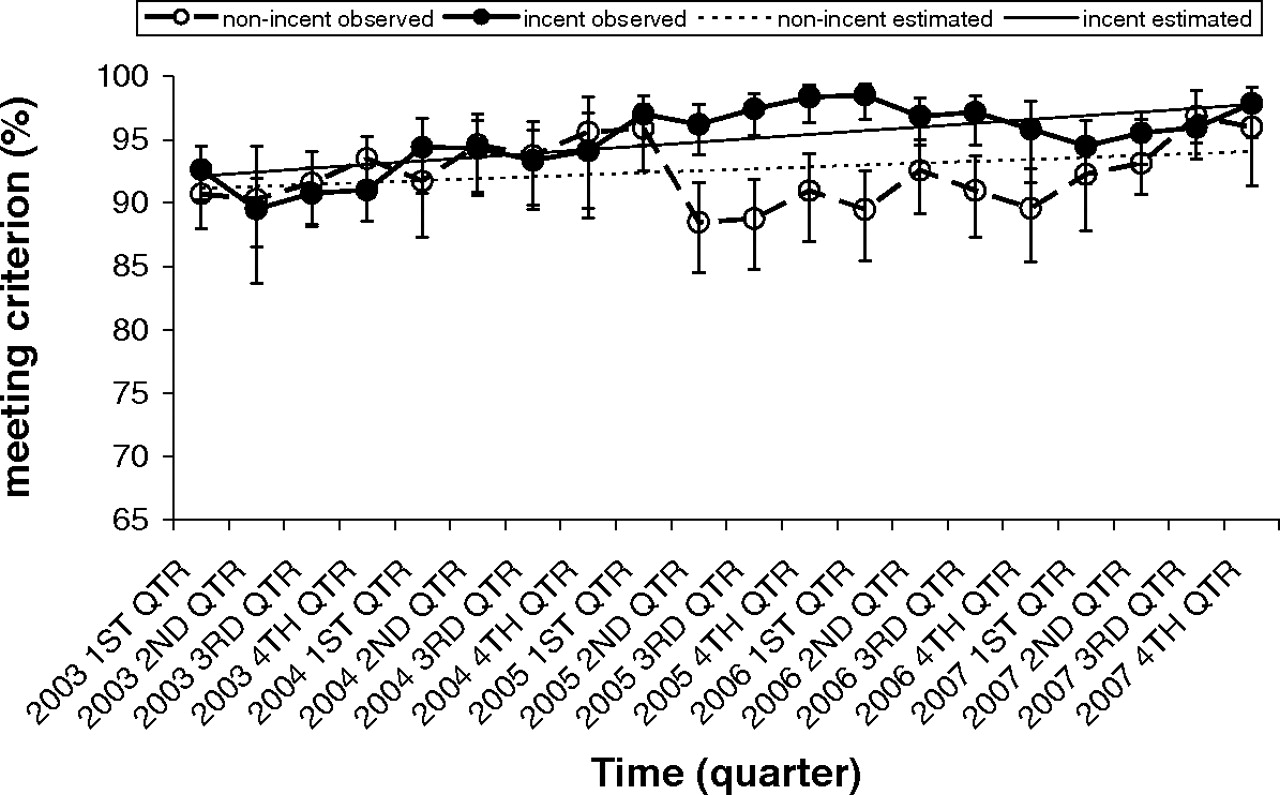
For Papanicolaou smears (Figure 1 and Table 1), the χ2 test revealed that the nonincentivized group had a higher percent of carts that met the Papanicolaou criterion during some early time periods (1st, 3rd, and 4th quarters of 2003 and the 2nd quarter of 2004; P < .05 for all), whereas the incentivized group had a higher percent of meeting the Papanicolaou criterion during some late time periods (2nd, 3rd, and 4th quarters of 2005 and 3rd quarter of 2007; P < .05 for all). The linear mixed model revealed that the interaction term comparing linear trends between the incentivized and nonincentivized groups was marginally statistically significant (P = .053), with a slightly positive linear trend (slope, 0.005) in incentivized clinics and slightly negative linear trend (slope, −0.004) in nonincentivized clinics.

Observed and linear mixed model estimated percent of meeting Papanicolaou criterion by group over time.
Papanicolaou Smears: Chart Reviewed and Percent of Meeting Criterion by Center by Time
Mammography
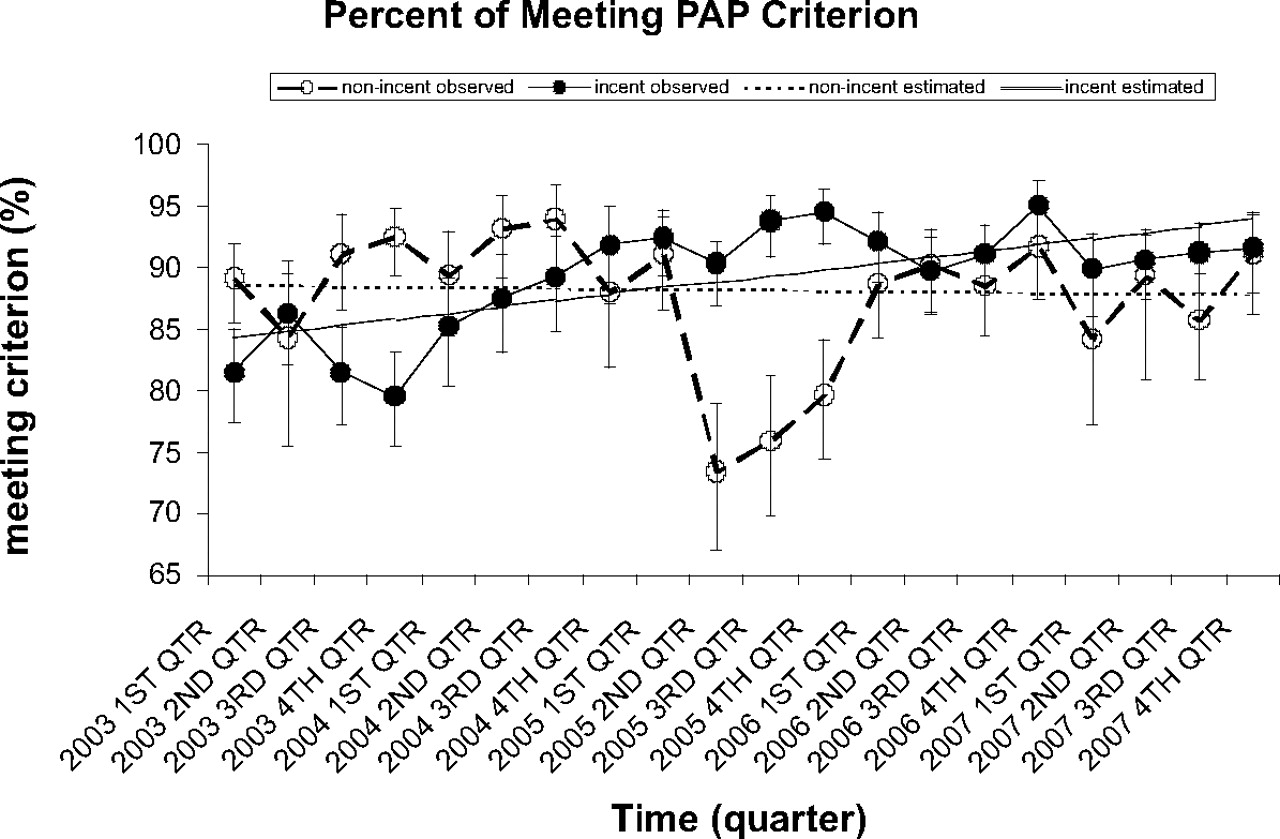
For mammography (Figure 2 and Table 2), the groups started and ended up with similar rates, although they diverged in 2005 to 2006. The χ2 test did not reveal any difference between the nonincentivized and incentivized groups before 1st quarter 2005, but revealed that the incentivized group had a higher percent of charts that met mammography criterion from 2nd quarter 2005 to 4th quarter 2006 (P < .05 for all). In addition, no between-group difference was found in 2007 with respect to the percent of charts that met the criterion. The linear mixed model revealed that the interaction term comparing linear trend between the incentivized and nonincentivized groups was marginally statistically significant (P = .076), suggesting a slightly faster increasing trend in incentivized clinics (slope, 0.003 vs 0.0015).
Observed and linear mixed model estimated percent of meeting mammography criterion by group over time.
Mammography: Chart Reviewed and Percent of Meeting Criterion by Center by Time
Pediatric Immunization
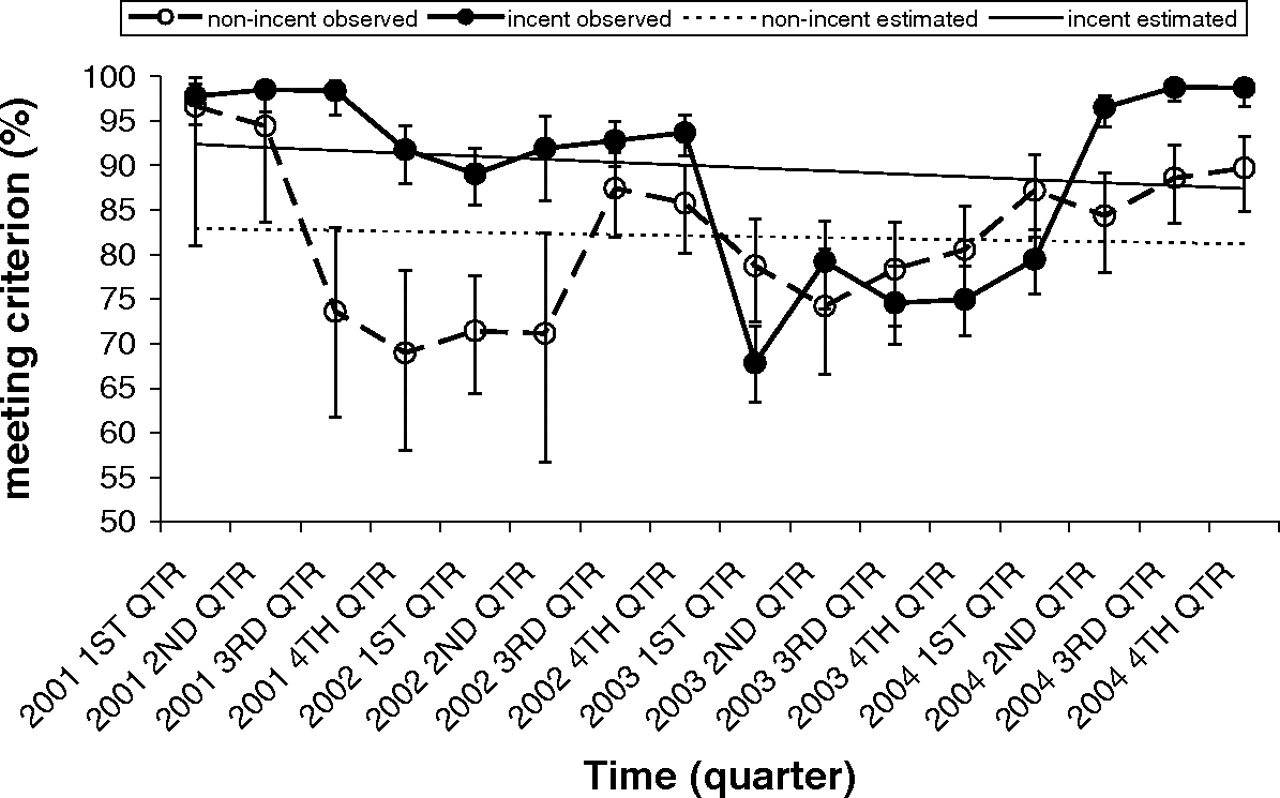
For pediatric immunizations (Figure 3 and Table 3), the χ2 test did not reveal any between-group difference in the 1st and 2nd quarters of 2001, but revealed that the incentivized group had a higher percent of charts that met the pediatric immunization criterion from 3rd quarter 2001 to 1st quarter 2003 (P < .05 for all), and from the 2nd quarter to the 4th quarter of 2004 (P < .0001 for all). The nonincentivized group had a higher percent of charts that met the criteria during the 1st quarter 2004. Although both groups of clinics exhibited complicated, nonlinear patterns, the interaction term comparing linear trends was not significant (P = .79).

Observed and linear mixed model estimated percent of meeting pediatric immunization criterion by group over time.
Pediatric Immunization: Chart Reviewed and Percent of Meeting Criterion by Center by Time
Bonuses Received
The maximum potential incentive per physician was $12, 000 annually in the intervention group, representing $4000 each for quality, RVU productivity, and visit productivity. The total incentive amount that was added to physicians’ annual salaries ranged from $3905 to $9146, with an average of $7083. Table 4 shows the amounts of the rewards during the years of the study in the intervention group (trends are not shown).
Incentive Pay for Incentivized Physicians
Provider Survey Results
The response rate to the survey was 50% (55 of 110). Approximately 50% of respondents thought that several quality indicators were part of the incentive program that were not (diabetic foot exams, glycated hemoglobin, and prostate cancer screening). The respondents’ ratings of perceived effectiveness of incentives for improving quality of care showed a wide range: “extremely effective, ” 9%; “very effective, ” 17%; “somewhat effective, ” 44%; “slightly effective, ” 6%; “not effective, ” 24%. The ratings for perceived effectiveness of incentives for “other physicians” were similar. The respondents ranked factors that were perceived to be most important in improving quality of care. The rankings were: (1) individual physician dedication and hard work; (2) teamwork with nursing staff; (3) how the patient care system is set up; (4) group accountability effect from monitoring/reporting results and targets; and (5) financial incentives.
Discussion
This natural experiment did not support the hypothesis that financial incentives increase the delivery of preventive services. The baseline performance rates and the change over time were not significantly different between the incentivized and nonincentivized groups. Except for pediatric immunizations, both the intervention and control clinics tended to improve screening performance, regardless of incentives. These secular trends toward improvement in all clinics were not unexpected because all physicians were employed staff and participated as a group in an organized effort to improve performance.
Although there are many pay-for-performance initiatives sponsored by health plans, employers, and government purchasers, 3 there is little evidence they improve health care. A 2004 review of the evidence about strategies to support quality-based purchasing of health care evaluated 5045 publications and found only 9 randomized controlled trials. Focus on a single aspect of care and methodological problems limited the validity of the findings.4 In 2006, Rosenthal and Frank5 reviewed the evidence for the efficacy of using incentives to improve quality. They reported that the empirical foundations for this effort were rather weak and the methodologically strongest studies yielded null results. Another recent systematic review found few empirical studies of financial incentives for quality. Five of 6 studies of physician-level financial incentives found partial or positive effects on measures of quality, with some evidence of unintended effects of incentives.6
Important factors in studies included the size of the bonus as well as physician perception and motivation relative to the effort required to make necessary practice changes. In addition, it may take longer than 18 months for practices to adjust procedures to show the influence of incentives. Small-scale interventions do not seem to influence physicians, partly because of the confusing array of payor contracts that effectively dilute the size of the incentive.6 Even a large incentive may be too trivial to deal with if it only affects a small proportion of one’s patients. A recent analysis of a large pay-for-performance program with family practitioners in the British National Health Service reported improved quality of care for 2 of 3 chronic conditions followed by the slowing of improvement and a reduction in continuity of care7 as well as unintended changes in staff and practitioner–patient dynamics.8 Overall, the aggregate evidence available is difficult to interpret because of the wide variety of interventions, target behaviors, and health care environments represented.
These findings are limited by the nonrandomized nature of this experiment, the small number of clinics, and the lack of data to adjust for potential confounders. Clinics received the intervention based on their physician staffing, not by randomization. However, clinics staffed by the 2 medical schools jointly participated in the quality improvement program, which had standardized reporting of performance by clinic and individual physician feedback. Therefore, it is unlikely that a difference in medical school would account for a difference in performance. Four to 5 years of monthly data were available for aggregate retrospective review, yet, because of the small number of clinics, the study had power to detect only a relatively large difference. However, the observed differences were quite small and not clinically important. Performance transiently decreased in 2003 for several indicators because of a change in leadership but subsequently improved throughout the system with an increased emphasis on improvement.
Several factors may have mitigated against a potential effect of incentive pay. First, individual clinical production incentives may have overwhelmed the group quality incentives. Incentivizing the group may lead to better teamwork and group collaboration.9 The Institute of Medicine has called for measures and rewards that foster shared accountability and coordination of care.10 In current US clinical practice, most patients with chronic illnesses would normally receive care from multiple physicians during a year.11 Even for the individual-level productivity incentives, we detected a modest effect at most.
Second, because the QA program emphasized improvement on all the indicators, a significant number of physicians were unclear about which quality indicators were being rewarded, which potentially weakened any effect of the incentives. The managers insisted that the quality program should focus on the broader group of services, whether or not they were incentivized, and that it should not selectively reward some indicators at the expense of others. Third, the physicians as a whole did not believe that financial incentives majorly contributed to overall quality of care. Fourth, because the physician pay scale is not as generous as in the private sector, it is possible that these physicians are less motivated by financial incentives than primary care physicians in other settings. Fifth, it has been estimated that adherence to all preventive guidelines would take an inordinate amount of clinicians’ time.12 This powerful barrier to performance of preventive care was, perhaps, stronger than the financial incentives.
Finally, the size of the quality incentive, $4000, may have been too small. The more successful program used by the United Kingdom’s National Health Service had substantially larger incentives in a much different national health system.13 This incentive amount represented 3% of physicians’ income, which is twice the 1.5% payment bonus (recently increased to 2%) available to physicians participating in the Centers for Medicare and Medicaid Services Physician Quality Reporting Initiative.14
Randomized, controlled trials of payment for performance are extremely difficult to conduct for a number of reasons. The many potential confounding factors require large sample sizes, particularly if the unit of intervention/observation is the clinic and not the individual provider. If payers can be convinced to fund the experiment, getting them to agree on metrics and incentives may be impossible, or even a violation of antitrust law. Politics and business decisions might interfere with true random assignment. Blinding for condition is impossible and the physicians who do not receive incentives might actually manifest decreases in productivity because of perceived deprivation. Thus, although done as a retrospective review and subject to a number of limitations, evaluation of the potential effects of pay-for-performance incentives has come from and is likely to continue to come from evaluations of natural experiments such as this one and nonrandomized experimental trials.
Despite considerable initial enthusiasm for the use of financial incentives for quality improvement, this study does not support the efficacy of this approach at the incentive level, such as that currently used by Medicare in the Physician Quality Reporting Initiative program over other approaches to improve care. Many other factors are related to the performance of prevention in primary care offices, including availability of information technology, provider factors and training, and reimbursement. In real-world settings, treatment delivery models, reimbursement strategies, and clinic business models can all affect outcomes.15 Implementation of national pay for performance initiatives should await better evidence that demonstrates the effectiveness of these programs.
Acknowledgments
The authors would like to acknowledge the statistical assistance of Valory Pavlik, PhD.
Notes
This article was externally peer reviewed.
Current affiliation: University of Chicago and NorthShore University HealthSystem, Evanston, IL (TFG).
Funding: none.
Conflict of interest: none declared.
- Received for publication August 10, 2007.
- Revision received May 7, 2010.
- Accepted for publication May 11, 2010.


