
Abstract
Objective: To test the reliability and validity of a new alcohol biomarker.
Design: Cross-sectional with matched control. Alcohol use, symptoms of alcohol dependence, health status, current medications, carbohydrate-deficient transferrin (CDT) levels, and γ-glutamyl transferase levels were assessed. Validity of the %CDT test was estimated using a drinking cutoff of 90 or more drinks in the previous 30 days.
Participants: Sample (n = 799) included 89 patients with type 2 diabetes, 299 patients with hypertension, 209 patients with hypertension and type 2 diabetes, and 202 matched control subjects with neither diabetes nor hypertension.
Results: Three hundred ninety-six women and 403 men ages 30 to 60 participated in the study. Six percent (45 of 799) reported drinking more than 14 drinks per week, 2% (n = 17) met criteria for alcohol abuse, and 3% (n = 23) met DSM-IV criteria for dependence. The overall sensitivity of the %CDT test was 61% with a specificity of 85%. A receiver operating characteristic curve was used to determine that the best fit was for persons who reported >90 drinks per month and a CDT level >2.5% with an area under the curve of 0.83. Test-retest reliability (R) was 0.94.
Conclusions: %CDT levels are useful in detecting and/or confirming high-risk drinking in patients being treated for type 2 diabetes and hypertension.
Alcohol use is an important factor in the etiology and treatment of type 2 diabetes and hypertension. Alcohol use can affect glucose levels and blood pressure1–4 and increase the risk for medical complications, such as ketoacidosis, peripheral vascular disease, peripheral neuropathy, heart disease, and cerebrovascular accidents.5–8 Although there is a continuing debate on how much is too much for persons with diabetes and hypertension,9 consistent evidence shows that high doses are harmful.10
As a result, there has been increasing interest in developing more accurate alcohol screening questions and laboratory tests to identify and treat patients who use alcohol above recommended limits. The current standard of care includes asking consumption questions, administering the CAGE questions, or using a screening questionnaire such as the Alcohol Use Disorder Inventory Test.11 Clinical experience, however, suggests that patients often minimize their alcohol use, especially those who are alcohol-dependent. Simply asking patients how much they drink is likely to miss a significant number of persons who could benefit from a reduction in alcohol use.
Traditional alcohol biomarkers include blood alcohol levels, liver function tests, such as γ-glutamyl transferase (GGT), and hematologic tests, such as mean corpuscular hemoglobin (MCV). Another method involves combining a number of routine blood chemistries, high-density lipoprotein levels, and hematologic measures using discriminant function analysis techniques.12 Alcohol bio-markers currently being tested in research studies include hemoglobin-associated acetaldehyde, fatty acid esters, and β-hexosaminidase isoenzyme B activity.13,14 None of these laboratory tests, however, is sufficiently sensitive or specific for screening or monitoring, and none of these tests has been approved by the FDA as an alcohol biomarker.
The first test to receive FDA approval15 as an alcohol biomarker was the carbohydrate-deficient transferrin (CDT) test. CDT was approved for use in the US health care system in 2001. This test has been used by life insurance companies in the US since 1995 to screen persons for heavy alcohol use.16 CDT is also widely used in Europe to monitor abstinence, assess preoperative alcohol risk, and identify high-risk drinking in surgical and medical settings.17–21
The goal of the study was to determine the reliability and validity of %CDT levels in a sample of primary care patients being treated with medication for type 2 diabetes and/or hypertension using well-validated patient self-report as the criterion standard. This is the first large-scale study of CDT in general medical care settings in the United States.
Methods
Design
%CDT levels were measured in a sample of 799 patients selected from 8 primary care clinics located in a rural/urban county in the Midwest. The CDT test used for this study was the %CDT turbidimetric immunoassay (TIA) (Bio-Rad, Hercules, CA). To assess test/retest reliability, CDT levels were repeated at 2- and 4-months after baseline in persons who had an initial CDT test greater than 2.5% and in those subjects who reported drinking >2 drinks per day. Medical record reviews were conducted to determine physician identification of treatment of persons with elevated CDT levels. The University of Wisconsin Health Sciences Committee for the Protection of Human Subjects approved the study. Patient self-reported alcohol use, using a 30-day timeline follow-back interview, was used to determine the validity of the %CDT test in this population.
Sample Recruitment
Subjects were recruited from 8 primary care sites. Four of the clinics were academic teaching sites of the University of Wisconsin Department of Family Medicine. The fifth site was a private practice site staffed by 7 primary care physicians. The 3 other primary care sites were part of a staff model HMO staffed by 21 primary care physicians. The sample was obtained with the assistance of 72 primary care physicians practicing in these 8 clinics.
Subjects between the ages of 30 and 60 were recruited into 1 of 4 groups. Group 1 consisted of patients being treated with medication for type 2 diabetes. Group 2 patients were being treated for hypertension. Group 3 subjects were being treated for both hypertension and diabetes. Group 4, the control group, consisted of patients who had neither diabetes nor hypertension. Some of the control subjects had other medical conditions, such as elevated lipids or heart disease.
Potential subjects were identified in the 8 primary care clinics through the use of ICD-9 billing codes using a clinic data warehouse. Computerized searches of the data warehouse used ICD-9 codes related to diabetes, hypertension, and their complications, such as renal, eye, and heart disease. A random selection process was used to select subjects for the study. Each selected subject received a letter from his/her physician with an invitation to participate in the study. An opt-out postcard method (subjects who did not return the postcard were contacted by telephone) was used in 5 clinics, and an opt-in procedure (subjects had to return a postcard before telephone contact) was used in 3 clinics.
Potential research subjects were then contacted by telephone, screened for eligibility criteria, and invited for a face-to-face interview and a blood test. Eligibility criteria included: currently taking medication for type 2 diabetes and/or hypertension, age 30 to 60, and no current pregnancy. Persons with type 1 diabetes were not eligible for the study. Control group patients were obtained from the same clinical sites matched on age and gender. Signed informed consent was obtained at the time of the interview. Subjects were paid $50 for the interview and blood test. Subjects who participated in the 2- and 4-month follow-up procedures were paid an additional $60.
Measurement of %CDT
Carbohydrate-deficient transferrin is present at low levels in most adults (<2.6% of total transferrin levels), including persons who do not drink alcohol. Human transferrin (a carrier protein for iron) occurs in at least 6 isoforms. These isoforms include penta-, tetra-, tri-, di-, mono-, and asialo transferrin. The asialo, monosialo, and disialo isoforms of transferrin are referred to as carbohydrate-deficient transferrin (CDT). The CDT isoforms of transferrin are elevated in persons who use excessive quantities of alcohol. There are also factors besides alcohol use that may affect CDT levels, including age,22 genetic variants,14 medication,23 female hormones,24 iron stores,25 tobacco use,26 and other factors.27,28
The %CDT TIA is the test used for this study. Of the 12 tests that measure CDT levels, this is the only CDT test currently approved by the FDA in the US. The %CDT TIA procedure measures the sum of CDT isoforms relative to the total amount of transferrin. The %CDT TIA is a heterogeneous immunoassay with column separation followed by turbidimetric measurement. Serum transferrin in the sample is saturated with Fe 3+. The mixture is applied to an ion-exchange column. Because of the different amounts of sialic residues on transferrin, the isoforms carry different charges and are separated in the column. The CDT isoforms are eluted. The CDT content of the collected eluate is determined by turbidimetric measurement. The eluted CDT isoforms form immune complexes with anti-transferrin antibodies. Total transferrin content of the sample is determined separately, using the same anti-transferrin antibodies. The measurements are evaluated using a calibration curve, and the %CDT value is calculated.
A research scientist at the University of Wisconsin Hospital Laboratories performed the %CDT tests reported in the study. Validation of the %CDT test was performed at 2 reference labs using methods developed by Bean.29
Analysis
Descriptive statistics were used to characterize the 4 groups who participated in the study. Alcohol use was determined using a 30-day calendar interview method.30 A standard drink was defined as 12 ounces of beer, 5 ounces of wine, 1.5 ounces of spirits, or 14 g of alcohol. The total amount of alcohol reported each day was added together to compute the total 30-day quantity. Drinkers were categorized as abstinent, 30 or more drinks in the previous month, 60 or more, 90 or more, and 120 or more. These categories correspond to 1, 2, 3, and 4 drinks per day, which are commonly used in epidemiologic studies.31
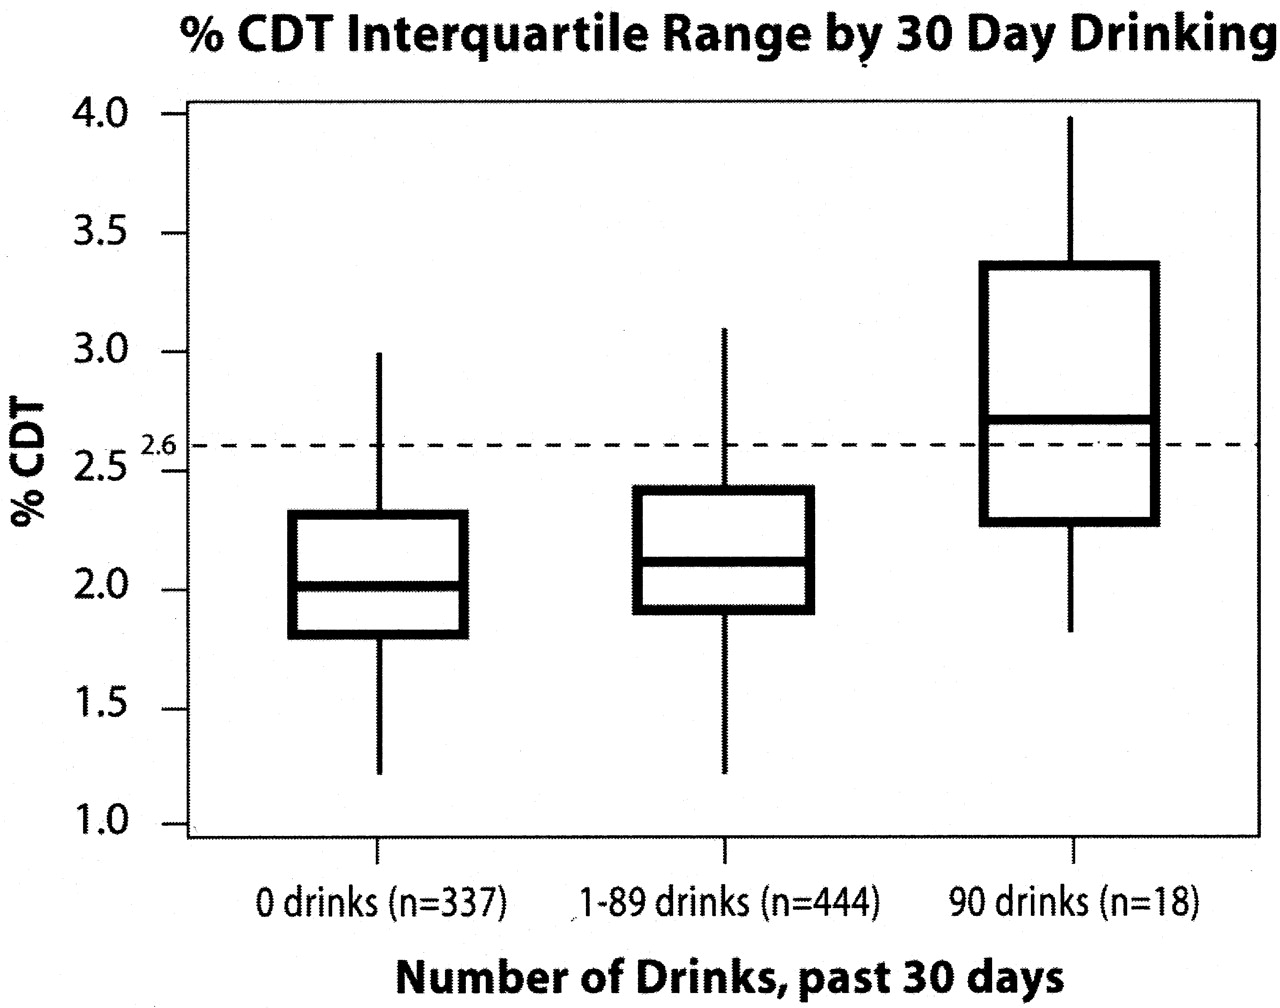
High-risk drinkers are defined as persons drinking 3 or more drinks per day and those who meet DSM-IV criteria for abuse or dependence. To meet criteria for current alcohol abuse subjects needed to be positive for at least 1 of the 3 DSM-IV abuse criteria. To meet criteria for dependence, subjects need to report a minimum of 3 of the 7 DSM-IV dependence criteria. The sensitivity and specificity of the %CDT test in the sample was calculated using 90 or more drinks in the previous 30 days as a true case and %CDT >2.5 as a positive %CDT test. The box and whiskers plots of %CDT scores reported in Figure 1 provide %CDT interquartile ranges and medians by reported alcohol consumption. The receiver operating characteristic (ROC) curve plots sensitivity vs. (1 − specificity) of various cutoffs for positive %CDT test results.

This figure displays the interquartile range of %CDT values for subjects who were abstinent (0 drinks), moderate alcohol drinkers (1 to 89 drinks), and high-risk drinkers (90 or more drinks) in the past 30 days. The median %CDT level increases from 2.0 for abstainers, to 2.1 for moderate drinkers, and to 2.7 for heavy drinkers. A %CDT level of 2.6 or higher is used to positively identify heavy alcohol use.
Results
A computer search of the data warehouse for the 8 clinics generated a list of 3016 patients with dia-betes and/or hypertension. An additional list of 335 patients was generated for the control group matched on gender and age. Potential subjects were randomly selected to receive letters of invitation in batches of 30 to 50 letters until our sample of 799 subjects was obtained.
Of the 1608 patients mailed letters using the opt-out postcard method, 246 returned the opt-out postcard and declined to participate. Seven hundred twenty-four persons in this group met the inclusion criteria and were enrolled in the study. Of the 348 subjects mailed letters using the opt-in method, 71 subjects participated in the study. Subject recruitment was lower using the opt-in postcard method compared with the opt-out method (20% vs. 45%). Fifty-four subjects met 1 of the exclusion criteria and were not eligible for the study. Of the 799 patients who completed the baseline interview, 151 patients either had a baseline CDT level of >2.5% or reported heavy alcohol use and participated in a face-to-face interview and blood draw at 2 and 4 months after baseline.
The sample included 396 women with a mean age of 50.1 and 403 men with a mean age of 49.4. Table 1 lists a number of characteristics of the sample. Sixty-eight percent were married or living with a partner. Eight percent were African American, 2% were Asian, 3% were Hispanic, and 87% were white. The mean education level was high, with 70% having more than a high school education. The majority of patients in the 4 groups reported at least 1 health problem (eg, asthma, depression, hepatitis C, or hyperlipidemia).
Sociodemographics and Health Status of 799 Persons, 30 to 60 Years Old, Recruited from 8 Primary Care Clinics
Rates of abstinence, alcohol use, abuse, and dependence among the 4 groups are illustrated in Table 2. Nearly 42% (n = 337) of the sample was abstinent; the highest rates of abstinence were in the diabetic sample. Six percent (n = 45) of subjects drank 2 or more drinks (28 g) of alcohol per day and 2% (n = 18) reported drinking 3 or more drinks per day. Two percent met current criteria for alcohol abuse, and 3% met criteria for dependence. Of the persons who met criteria for abuse or dependence, 10% reported abstinence in the previous 30 days, 57% reported 1 to 3 drinks per day, and 33% reported 3 or more drinks/day.
Frequency of Six Categories of Alcohol Consumption and Presence of DSM-IV Criteria for Alcohol Abuse or Dependence by Diabetes and Hypertension Status (N = 799)
Table 3 lists the sensitivity and specificity of the %CDT in the sample by group. The overall sensitivity of the %CDT test was 61% using 90 or more drinks in 30 days as a definition of a true positive. Eleven of the 18 patients who drank 90 or more drinks (3 drinks or 42 g of alcohol per day) had a %CDT level higher than 2.5%. The specificity of the %CDT test was 85%. Combining the patients who drank 90 or more drinks and the patients who met current criteria for alcohol abuse and dependence as true cases lowered the sensitivity to 40% and lowered specificity to 80%.
Sensitivity and Specificity of %CDT in a Sample of Patients with Diabetes and/or Hypertension and Control Subjects (n = 799)
Figure 1 illustrates the interquartile range of the %CDT levels in the total sample. The sample is divided into 3 groups: persons who were abstinent, persons who reported 1 to 89 drinks in the previous 30 days, and persons drinking 90 or more drinks in the last 30 days. The median %CDT level was 2.0 in the abstinent group, 2.1 in the moderate drinking group, and 2.7 in the high-risk drinking group. The %CDT levels ranged from 0.8 to 6.4 in the abstinent group, 0.9 to 11 in the moderate group, and 1.8 to 7.4 in the high-risk drinking group.
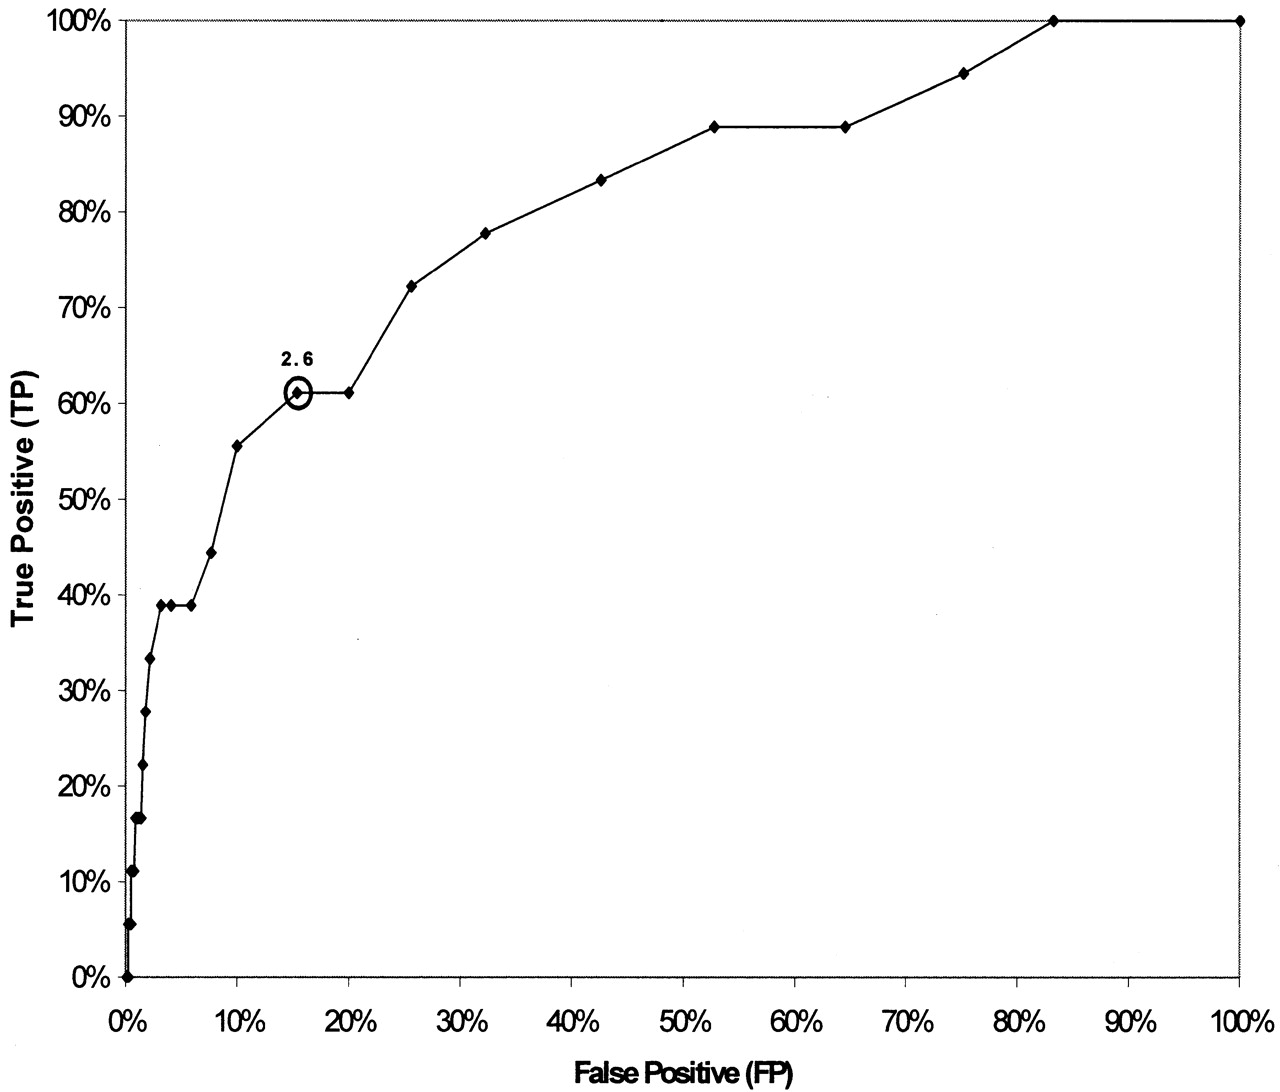
Figure 2 presents a ROC curve for the CDT test in the population of 799 subjects. True cases were defined as persons who reported 90 or more standard drinks in the previous 30 days. Using a CDT cut-off score of 2.6 or greater provided a sensitivity of 61% and a specificity of 85%. The area under the ROC curve is 0.803. The ROC allows clinicians and health care systems to weigh the tradeoffs in terms of sensitivity and specificity when alternate cut-off values are used to indicate a positive %CDT test. For example, if clinicians want to minimize the risk of false-positive tests, they may want to increase the CDT cutoff level to 3.0, where the false-positive rate decreases from 15% to 3%. Test sensitivity falls to 39% when using 3.0 as the cutoff value for a positive %CDT.

Receiver operator curve for %CDT test in a sample of 799 patients with diabetes and/or hypertension and control subjects. The ROC curve plots sensitivity (true-positive) vs. 1 − specificity (false-positive) rates for the %CDT test. A case was defined as a subject who reported 90 or more standard drinks in the previous 30 days. The specificity and sensitivity will vary depending on the %CDT value selected. For example, if one selects the cut-off currently recommended, 2.6% CDT, the sensitivity is 61% and specificity is 85%. If one selects 3.0% CDT, the sensitivity decreases to 40% and the specificity increases to 97%. The area under the ROC curve = 0.803.
Test-retest reliability was determined by inviting all subjects with an elevated CDT and those who drank 60 or more drinks in the previous 30 days to participate in repeat CDT tests 2 and 4 months after baseline. Eighty-two subjects with a %CDT >2.5, and 26 persons drinking 60 or more drinks in the previous 30 days participated in repeat CDT testing. The test-retest reliability of the CDT test in the sample with 2- and 4-month data found a reliability coefficient α of 0.92 and the analysis of variance intraclass correlation R was 0.94. This suggests the repeat testing is stable for at least 4 months’ follow-up.
Discussion
This is the first large study examining the psychometric properties of the %CDT test in primary care patients being treated with medication for type 2 diabetes and hypertension. Prior research found that the CDT test has reasonable psychometric properties in patients being treated for alcohol dependence32 and for screening high-risk medical and surgical patients.18,20 The study suggests CDT tests can provide useful information to primary care clinicians in their care of persons with these chronic illnesses. This study found that the %CDT test was positive in more than 60% (ie, sensitivity) of adults drinking 90 or more drinks in the previous 30 days (42 or more grams of alcohol per day). The specificity was 85%. There were minimal differences in the validity of the test by gender or group. The test-retest reliability was 0.94.
Strengths of the study included a large sample of 799 primary care patients. The study population was randomly selected from all patients being treated for diabetes and hypertension from a diverse sample of patients receiving care at 8 primary care clinics. These clinics included urban and rural sites that are representative of primary care practices in the Midwest. The findings may be generalizable to other primary care practices in the United States with similar patient demographics. Experienced research staff conducted face-to-face confidential interviews with research subjects to minimize under-reporting of alcohol use. The %CDT testing was conducted by an experienced laboratory scientist at the University of Wisconsin Hospital. The %CDT test results obtained at the University of Wisconsin were very similar to those obtained on a subsample retested at 2 reference laboratories.
Limitations of the study are related to the selection process, criterion standard, and confirmation of self-report. First, there is the potential for selection bias, because this study depended on volunteer participation and subject’s ability to participate in the research interviews. The project attempted to minimize selection bias by guaranteeing patient confidentiality, providing financial incentives, and using experienced research staff. The selection of a “criterion standard” for alcohol biomarkers continues to depend primarily on patient self-report. The study used the current state-of-the-art method of collecting alcohol use information, namely the 30-day timeline follow-back calendar method. Traditional alcohol biomarkers such as MCV and GGT levels have been shown to be less sensitive than self-report and are not useful as criterion standards.
Other potential methods of confirming patient self-report include medical record reviews and family member collaboration. For this study, we conducted medical record reviews on all 799 patients. We discovered no alcohol use not reported by the patient, and more than half of the medical records of heavy-drinking research subjects revealed no documentation of the patient’s alcohol use. Prior studies conducted by the authors found that family members interviewed to corroborate patient self-report reported less alcohol use than provided by the research subject.33 These observations confirm that patient self-report, using standard research methods, is the most valid “criterion standard” in a primary care sample.
The sensitivity of the %CDT test has been reported to vary from 20% to 95% depending on the population of interest. Studies testing the %CDT in samples of persons recruited from alcohol treatment programs found the highest sensitivity rates of 80% to 95%,34,35 whereas those studies that identified subjects in general medical settings reported the lowest sensitivity rate of 15% to 60%.36,37 Studies in high-risk trauma patients and surgical patients found sensitivities in the range of 40% to 80%.18,20 As with most screening tests, the accuracy of the %CDT test varies depending on the prevalence of heavy alcohol use in the population being studied. The sensitivity reported in our sample (61%) is higher than reported in previous general clinical settings.
The specificity of the %CDT test also varies by population and clinical setting. Although initial studies suggested %CDT tests were highly specific for high-risk alcohol use,38 newer studies suggest a more complicated picture. Biological factors that may increase %CDT levels are female hormones, iron stores, medication, end-stage liver disease, genetic variants, low body mass index, catabolic states, and chronic pulmonary disease.24–28 Common mechanisms that have been proposed include a redirection of glycan synthesis to the sialylated forms of transferrin and increased enzymatic removal of carbohydrate chains from circulating transferrin.39,40
In this study, we found a specificity of 85%. The 120 persons who were classified as false-positives were 62% women, and the mean age of this false-positive group was similar to that of the total sample (48.8 versus 49.7, respectively) and were distributed proportionally across the 4 groups. A number of potential explanations exist for false-positive %CDT tests in this sample. First, some of these patients may have been under-reporting their alcohol use. Second, unknown factors, such as medication interaction, may affect %CDT levels. Third, metabolic factors related to diabetes, lipid disorders, hypertension, and other chronic illnesses may affect %CDT levels. This is the first study of the validity of %CDT levels a large sample of patients with chronic medical problems. Additional research in primary care samples is needed to assess the issue of false positive %CDT levels.
The clinical utility of the %CDT test in primary care is not known. However, until additional studies are conducted, this study provides sufficient evidence for primary care physicians to begin to use this test in conjunction with other methods, such as questionnaires and other alcohol biomarkers such as blood alcohol levels, MCV and GGT in high-risk patients. Because the predictive value of the %CDT test seems to be marginal in populations with a low prevalence of heavy alcohol use, primary care providers may want to limit the use of %CDT to diabetic or hypertensive patients who are not under good control. As with other screening tests, such as mammography, prostate screening, and cholesterol, careful evaluation and follow-up is necessary for patients with an elevated %CDT test.
This study could have important implications for primary care physician treatment and follow-up strategies for patients with hypertension and/or diabetes. In this study, 9% (29 of 298) of the diabetics and 15% of the hypertensive patients were found to be drinking 30 or more drinks in the previous 30 days or met criteria for alcohol abuse/dependence. None of these patients should drink more than 1 drink per day because of the adverse affect of alcohol on glucose and blood pressure regulation and other adverse health effects.41 There are also interactions between alcohol and some medications used to treat hypertension and diabetes.7
Our study found that fewer than 30% of the subjects who reported 30 or more drinks in the previous 30 days had alcohol use information in the medical record. This finding suggests primary care physicians may want to used the %CDT test, in conjunction with questionnaires, to help them identify patients using alcohol above recommended levels. Identification could be followed up with brief intervention and motivational interviewing, in that prior studies suggest brief physician advice can reduce alcohol use and alcohol-related morbidity and costs.41
Assuming there are 15 million patients with diabetes42 and 50 million patients with hypertension43 in the United States, the findings of our study suggest there are 1.35 million patients with diabetes and 7.5 million patients with hypertension who drink too much (28 or more drinks per month), who could benefit from brief physician advice. In addition to identifying high-risk drinkers, CDT levels can be used to monitor relapse. Studies have found that CDT seems to act like a glycosylated hemoglobin test. It generally decreases within 2 weeks of abstinence and will increase if persons resume drinking.13,32,44 Quarterly testing of CDT levels in unstable diabetics or hypertensive patients may be indicated to monitor reductions or increases in drinking. CDT is the only alcohol biomarker sensitive enough to monitor reductions in alcohol use or relapse.
Notes
This work was supported by Axis-Shield of Oslo Norway, The National Institute on Alcohol Abuse and Alcoholism, the University of Wisconsin Department of Family Medicine Research Program, the University of Wisconsin Hospital and Clinics Laboratories, and the Group Health Cooperative of Wisconsin.
- Received for publication December 8, 2003.
- Revision received December 8, 2003.


