
Abstract
Objective: The objective of this study was to associate questions about specific eating behaviors with weight. Our ultimate goal was to create a clinical screening questionnaire for eating behaviors associated with overweight and obesity.
Methods: We developed a questionnaire based on eating behaviors associated with overweight and obesity. After pilot testing and revision, we administered the questionnaire to patients in 2 primary care clinics from the Utah Health Research Network. We analyzed the relationship between measured body mass index, demographic factors, and responses to screening questions about eating behaviors and physical activity.
Results: We collected 261 completed questionnaires with weight and height measurements. With regression analysis, questions about consumption of beverages with sugar added, fruits and vegetables, and full portions served at restaurants as well as questions about physical activity were associated with body mass index and being overweight and/or obese.
Conclusions: We suggest that future research about eating behaviors focus on the questions regarding typical consumption of beverages with sugar added, fruits and vegetables, and full portions served at restaurants to further develop a tool for clinical screening.
Being overweight or obese is epidemic in the United States. From 2001 to 2002 the prevalence of overweight or obesity among US adults was 65.7% and the prevalence of obesity was 30.6%.1 The associations between being overweight, obesity, and many chronic diseases, including but not limited to hypertension, type 2 diabetes mellitus, gallbladder disease, coronary heart disease, and hypercholesterolemia, are well supported.2 Effectively and efficiently managing and preventing overweight and obesity in the primary care setting is warranted.3
Weight is a product of energy balance: energy intake versus energy expenditure. This study focuses on specific eating behaviors that are known to affect energy intakes and that can lead to overweight or obesity. Restaurant and fast food consumption,4–6 large portion size,7–11 and beverages with sugar added12,13 are positively associated with overweight and obesity. Conversely, low–energy-dense food, eg, fruits and vegetables,14–19 and a healthy breakfast20–23 are negatively associated with overweight and obesity. These specific behaviors may be amenable to clinic-based counseling to identify behaviors that put patients at high-risk for being overweight or obese.24
Traditionally, 24-hour diet recalls, food diaries, and food frequency questionnaires are used to assess dietary behavior. Many assessment tools have been created based on these traditional methods.25 These tools, however, focus on a specific disease processes, ie, cardiovascular disease or hyperlipidemia,25–28 or are created for use in a nonclinical setting.29,30 For example, the MEDFICTS (meats, eggs, dairy, fried foods, fat in baked goods, convenience foods, fats added at the table, and snacks) questionnaire is valid for identifying adherence to diets recommended for prevention and treatment of cardiovascular disease.26 The Fat Intake Scale reliably identifies people on a cholesterol-lowering diet.27 The Youth Weight, Activity, Variety, and Excess Screener is a valid questionnaire for use in the classroom setting.29 These questionnaires, however, are not brief enough for use as clinical screening instruments. To our knowledge, no tool focuses on the clinical assessment of obesity risks in relation to the 5 eating behaviors described above: consumption of fast food/restaurant food, large portion sizes, consumption of beverages with sugar added, consumption of fruits and vegetables, and consumption of breakfast.
The purpose of this study was to create and evaluate a questionnaire that associates the responses to screening questions regarding these specific eating behaviors with overweight and obesity. Our ultimate goal is to develop a screening tool for use in primary care clinics that would help providers identify these potentially modifiable behaviors among patients.
Methods
We conducted this 2-part study from May through August 2007. Eligible patients were English-speaking adults, ages 21 to 65 years, who came to 2 university-based family medicine clinics from the Utah Health Research Network. We excluded pregnant women and those who had undergone bariatric or cardiac surgery or had a known eating disorder, kidney failure, or an uncontrolled thyroid disorder. Demographic information collected included age, gender/sex, race/ethnicity, and number of years completed in school.
Phase 1—Pilot Study
Based on a literature review and consultation with experts, we created 2 versions of a self-administered questionnaire to screen for the key eating behaviors mentioned above. We combined restaurant food and fast food consumption as one eating behavior. The 2 versions differed in format and length, but contained the same concepts. Version A asked questions about typical behavior over a day or a week. Version B asked questions regarding a 1-day or 1-week recall of behaviors, and typical behavior over a day or a week. We used quota sampling to ensure equivalent number of participants of the same sex and age range from each clinic. Patients completed both versions of the questionnaire in a random order predetermined by coin toss. They were subsequently interviewed regarding their opinion of the questions for ease of understanding, accuracy of response, and true representation of behavior. The responses to the interview were entered in Stata 9 software (StataCorp LP, College Station, TX) for descriptive analysis. We reviewed and categorized all the responses. Based on descriptive analysis we created the finalized questionnaire (Appendix 1).
Phase 2—Cross-Sectional Study
One of the 2 clinic sites was used for data collection each day of the study; the clinic site for the day was selected randomly by coin toss. Patients from each clinic completed the final version of the questionnaire. A medical assistant measured and recorded height and weight. We calculated body mass index (BMI) using the following equation: (height [inches] ÷ weight2 [pounds]) × 703. We defined normal weight as BMI 18.5 to 24.4 kg/m2, overweight as 24.5 to 29.4 kg/m2, and obese as more than 29.5 kg/m2. The patients from Clinic1 and Clinic 2 were very similar; therefore, we combined the data from each clinic for all analyses. To create a cumulative variable for consumption of beverages with sugar added, we combined the responses for the questions of nondiet soda and juice or punch consumption for 1-day recall and typical behavior, respectively. Similarly, we combined the responses for the questions about fruit and vegetable intake. We then categorized the combined responses for the fruit and vegetable intake questions to >3 times a day or ≤3 times daily. Using Stata 10 statistical software (StataCorp LP) we assessed univariate associations for related questions using Spearman's correlation. We also assessed multivariate linear and logistic regressions for the outcomes of BMI, testing for a 0.05 level of significance. We adjusted for demographic variables with the multivariate and logistic models and then expanded a logistic model to adjust for demographic factors, physical activity, and the other eating behaviors.
Results
Phase 1
We collected data about 48 patients: 22 men and 26 women, 24 of whom were from Clinic 1 and 24 of whom were from Clinic 2. The average age of the patients was 42.6 years, with relatively equal distribution between decades of life. The majority (78.7%) reported their race/ethnicity as “white/Caucasian” (Table 1). When asked which type of question was easier to understand, 42% reported the 1-day or 1-week recall, 42% reported the typical recall, and 17% reported both question types were equally understandable. In response to the questions of whether the 1-day or 1-week recall were typical for the participant, 62% answered yes for the restaurant food/fast food consumption question, 76% answered yes for the large portion size question, 83% responded yes for questions about consumption of beverages with sugar added, 58% responded yes for fruit and vegetable intake questions, and 87% responded yes for the question about eating a healthy breakfast. Conversely, when questioned verbally, participants commented that reporting typical behaviors over a period of time was more representative of that behavior than reporting behaviors from the previous day. We considered both written and verbal responses during analysis. Finally, we created a concise final version of the questionnaire with both 1-day or 1-week and typical behavior questions.
Demographic Characteristics and Body Mass Index
The final version of the questionnaire included a total of 24 items: 14 questions about specific behaviors, 4 questions about demographics, and 6 questions about exclusion. The questions regarding consumption of restaurant food, beverage with sugar added, and fruits and vegetables used an 8-point anchored scale ranging from 0 to “more than 7.” We used a 7-point scale for the question of portion size with responses ranging from “never” to “always.” To quantify physical activity, we used an 8-point numbered scale from 0 to 7 called the “physical activity vital signs” as developed by Joy et al (manuscript submitted for publication). The questions of age and years of schooling were open-ended, but the participants were asked to circle a response for questions about gender/sex and race/ethnicity. The responses provided were “male” or “female” and “black/African-American,” “white/Caucasian,” “Latino/Hispanic,” “Asian,” “Pacific Islander,” or “other,” respectively.
Phase 2
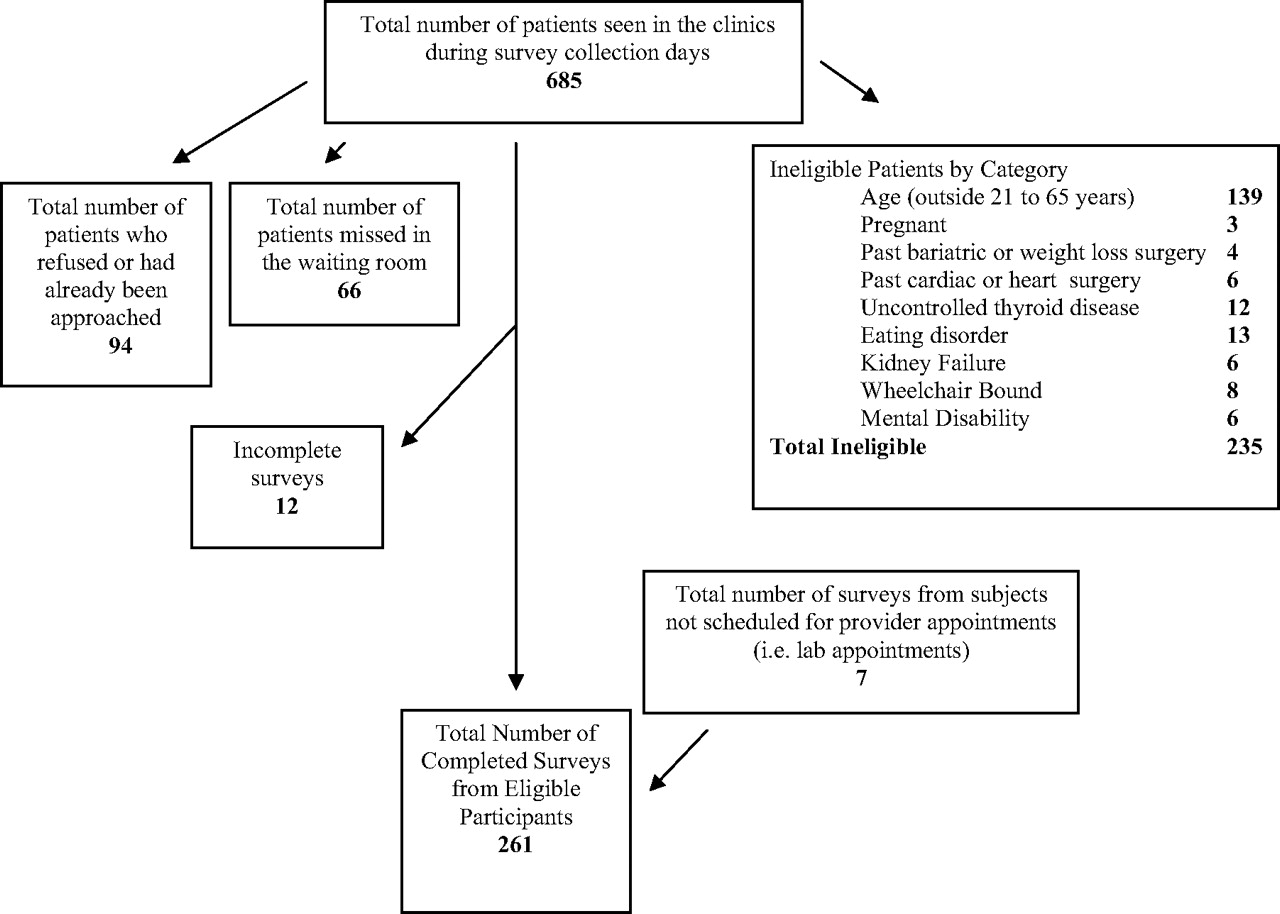
Figure 1 depicts the process of patient recruitment. Two hundred fifty-four patients were enrolled as clinic patients and 7 additional eligible patients who accompanied the clinic patients requested to take part in the study (71% participation rate). A total of 137 patients were from Clinic 1 and 124 patients were from Clinic 2. The gender/sex, age distribution, and race/ethnicity were similar for participants from each clinic. Furthermore, the mean BMI at each clinic was equal at 28 kg/m2 (SD, 7.22; range, 16.68–68.65). Table 1 describes the characteristics of the combined sample. Table 2 represents the summary statistics for the responses to each question from the finalized version of the questionnaire.

Survey distribution and patient eligibility.
Summary of Responses by Question Type
Using multivariate linear regression adjusting for age, gender/sex, race/ethnicity, and years of education, we found that associated with every additional beverage with sugar added typically consumed each day there was a 0.61 increase in BMI (P = .006), whereas there was no significant association with beverages with sugar added consumed the day before. We found that physical activity was associated with a protective effect. A 0.91-unit reduction in BMI was associated with every 1-day increase in moderate physical activity (P < .001). Table 3 depicts these associations between behavior and BMI categorized by response to 1-day recall and typical recall, respectively.
Change in Body Mass Index Associated with Reported Eating and Physical Activity Behaviors*
Using logistic regression to adjust for the same demographic factors, we found that the odds of being obese were significantly increased for consuming a full portion-sized meal (odds ratio, 1.35; P = .006) when compared with never consuming full portions. Furthermore, the odds of being obese decreased for those who reported engaging in moderate-intensity physical activity (odds ratio, 0.72; P = .001) (see Table 4).
Odds of Overweight and Obesity Associated with Reported Eating Behaviors and Physical Activity*
Spearman's correlation determined that the questions of 1-day recall versus typical behavior were substantially collinear for beverages with sugar added (r = 0.71); fruit and vegetable consumption (r = 0.76); and physical activity (r = 0.78). However, the questions regarding restaurant food consumption specified 2 time periods: yesterday versus typical week. Thus, the 2 questions for the consumption of restaurant food were substantially independent (r = 0.42). These results informed the logistic regression models as described below.
As seen in Table 5, we constructed logistic regression models to include the screening questions for all target eating behaviors, physical activity, and demographic factors to predict the odds of overweight and obesity. Based on our findings from the Spearman's correlation, we included the questions of typical behaviors and both the 1-day and typical behavior for the restaurant/fast food questions. When adjusting for demographic factors, physical activity, and the other eating behaviors, the odds of being obese were 1.47 times higher for every unit increase in reported frequency of eating a full portion-sized meal compared with never eating a restaurant or fast food meal in its entirety (P = .002). Furthermore the odds of obesity decreased 0.69 times with each day of moderate intensity physical activity for 30 minutes or more in a typical week (P = .001). Finally, the odds of being overweight were 0.39 times lower for those who ate fruits and/or vegetables more than 3 times a day compared with eating these foods 3 times or fewer (P = .015).
Odds of Overweight and Obesity with Mutual Adjustment for Reported Eating Behaviors and Physical Activity*
Final Questionnaire
Discussion
To our knowledge, this is the first study that addresses screening for several common eating behaviors simultaneously for their association with BMI, overweight, and obesity in a primary care setting. We found that our study population preferred to respond to questions of both 1-day or 1-week recall and typical behavior over a given period of time. For all questions except the consumption of restaurant and fast food, the responses to the 1-day/1-week and typical behavior were highly correlated, but the typical questions were more highly associated with weight outcomes. While adjusting for demographic factors, consumption of beverages with sugar added was positively associated with BMI, and consuming full portion sizes served was positively associated with obesity. Physical activity had a negative association with BMI and obesity. When adjusting for demographic factors and all behaviors, consumption of more than 3 servings of fruits and/or vegetables a day had a negative association with overweight.
This study focused on screening for behaviors related to the energy intake aspect of energy balance. The questionnaire included questions about physical activity primarily to adjust for this behavior. However, we found that physical activity had a protective effect against obesity, as would be expected. The recent Cochrane Analysis by Shaw et al31 indicated that exercise alone decreases weight 0.5 to 4.0 kg and BMI 0.3 to 0.7 kg/m2 compared with weight and BMI changes of −0.1 to 0.7 kg and 0.3 to 0.4 kg/m2, respectively, with no exercise.
The American College of Sports Medicine, US Department of Agriculture (USDA), and the Institute of Medicine (IOM) provide reasonably consistent guidelines with regard to energy expenditure. The American College of Sports Medicine and the USDA recommend at least 30 minutes of moderate physical activity 4 times a week,32,33 whereas the IOM recommends 1 hour of moderate physical activity daily for cardiovascular health.33 Similar simple guidelines would assist providers with counseling patients on eating behaviors. The IOM and USDA have given quantitative guidelines for food servings and macronutrient intake.34 However, assessing caloric intake can be difficult to conceptualize and effectively communicate. A qualitative tool focused on particular behaviors known to be harmful or beneficial for maintaining healthy weight might be a more effective strategy in clinical settings. We suggest our questions regarding typical consumption of beverages with sugar added, full portions of restaurant meals, and fruits and vegetables might provide the framework for a screening tool focused on potentially modifiable behaviors.
Energy density is a measure of energy content per weight of food.35 Foods with low energy density tend to have a high water and fiber content, such as fruits and vegetables, whereby high energy-dense foods tend to have a high fat content.36 For the reference 2000 calorie diet, the US Department of Agriculture recommends at least four and one-half cups, or nine servings, of fruits and vegetables daily for health maintenance.32 Our study found that the reported consumption of fruits and/or vegetables more than 3 times a day is associated with a reduced risk of overweight, which is consistent with previous research. In one study, Rolls et al found that middle aged women who ate 1.9 servings of fruits daily had a 25% lower risk of obesity (OR 0.75, P < .001) compared with women who ate fewer servings. Similarly, women who ate 2.8 servings of vegetables had a significantly lower risk of weight gain (OR 0.84, P < .0001) compared with those who eat fewer servings.19 Furthermore, Ledikwe et al found that, compared with those eating high dense foods, those who consumed low energy-dense foods can decrease total energy intake by 432 kcal per day in men and 278 kcal per day in women.17
Our findings for consumption of beverages with sugar added are consistent with previous research on this behavior. Raben et al12 found that adding ∼2 g of sugar-added beverages per kilogram of body weight was associated with significant increases in energy intake (1.5 mJ/day), body weight (1.6 kg), and fat mass (1.3 kg) in adults over a 10-week period (P < .5). Similarly, Berkey et al13 found that over a 1-year period, adolescent boys who drank 1 or 2 beverages with sugar added a day significantly increased their BMI by 0.10 (P = .02) and 0.14 (P = .01), respectively; adolescent girls who drank 2 or more beverages with sugar added a day significantly increase their BMI by 0.10 (P = .046).
Compared with other studies, we did not find significant associations for the frequency of restaurant or fast food consumption with BMI, overweight, and/or obesity. However, other investigators have found significantly positive associations between the frequency of the consumption of restaurant or fast food and increases in body weight.4,5
Recent findings from Duffey et al6 suggested different associations with restaurant food consumption based on whether or not it was a fast food restaurant. BMI increased 0.13 units over 7 years with every time per week fast food consumption increased (P = .003). This increase in BMI was sustained at 10 years (P = .001). Conversely, longitudinal increases in restaurant food consumption (other than fast food) resulted in minimal decreases in BMI (P = .756 at 7 years; P = .676 at 10 years).6 Our question combined restaurant and fast food consumption. We cannot assess the association of fast food restaurants and other restaurants separately. The lack of an association in our study may be related to combining these 2 types of food consumption into a single question.
Portion size consumed is closely related to the frequency of restaurant food consumption because the largest food portions in the United States come from restaurants and fast food establishments.7 However, the studies of portion size are distinct from those of frequency. Several studies have shown increases in energy intake with increasing portions sizes of a meal.8–11 Increases in energy intake, without a corresponding increase in energy expenditure, result in weight gain. Similarly, recent findings by Pedersen et al37 indicate significant weight loss in diabetic patients using portion control instruments compared with those who did not use these instruments (mean + SD, 1.8% + 3.9% vs 0.1% + 3.0%, respectively; P = .01). We found the odds of obesity greater in those who ate restaurant or fast food meals in thier entirety compared with those who never eat the meal in its entirety.
The overall prevalence of overweight or obesity in our study population was similar to that of the US population: 30% and 63% vs 31% and 66%, respectively. However, several limitations inhibit the inferences that can be made from this study. Our study had a relatively small sample size and patients were solely recruited from university-based family medicine clinics. We collected data for this study during the summer months of 2007 so we could not account for seasonal variations of eating patterns. Furthermore, the ethnic/racial diversity of our sample was limited and did not match that of the general US population. This study did not include people who did not speak or read English. The administration method made this study subject to recall bias and the setting may have introduced other subject biases because we used a self-administered questionnaire that was collected in a clinic environment. Finally, we used a completely novel questionnaire for this study. Previously validated questions, such as those mentioned above, were not used to keep the length and formatting as uniform and concise as possible, which is consistent with our goal of developing a brief questionnaire suitable for use as a clinical screening instrument.
We consider this to be a promising pilot investigation. Our results indicate that questions focusing on typical behavior are more likely to be relevant for identifying at-risk behavior than questions of 1-day or 1-week recall. Further research is warranted to more thoroughly evaluate the best way to screen for these behaviors and the relationship between these behaviors and weight. Future research should include a larger sample size with greater ethnic/racial diversity, inclusion of non–English-speaking patients, and, perhaps, separation of fast food consumption from other restaurant food consumption. Previous research on larger portion-size meals has focused on energy intake, not weight. Research specific to portion size and weight might improve understanding of this relationship. After refining our questions for efficiency, work to validate the questions in relation to more detailed assessments of behavior will be warranted. In addition, it will be valuable to assess these behaviors in a prospective fashion for changes in weight over time and to assess the effects of clinical interventions targeted for these behaviors.
Our ultimate goal is to create and validate an effective screening tool to identify key eating behaviors that may assist primary care and public health providers in managing patients’ excessive weight. We envision a concise 3- to 5-item tool feasible for use during a 15-minute clinic visit. This tool will take an estimated 3 to 5 minutes for patients to answer and 1 minute or less for providers to review. With the emergence of electronic medical records, the questionnaire can be programmed in with nursing notes or vital signs. The nurse or medical assistant can ask and record the responses while rooming a patient, or the provider can do the same as they encounter the patient. Alternatively, the questionnaire can be administered in paper form and patients can respond as they wait for the provider in the reception area or examination room. With this questionnaire, providers could identify patients who may need behavior modification counseling to prevent or manage overweight and/or obesity.
Acknowledgments
We give special thanks to the Utah Health Research Network for their support in this endeavor.
Notes
This article was externally peer reviewed.
Funding: Emily Omura's time was supported by the Predoctoral Training in Primary Care Grant sponsored by the Health Resources and Services Administration.
Conflict of interest: none declared.
- Received for publication November 28, 2007.
- Revision received April 4, 2008.
- Accepted for publication April 11, 2008.


