
Abstract
Introduction: Increased use of telemedicine could potentially streamline influenza diagnosis and reduce transmission. However, telemedicine diagnoses are dependent on accurate symptom reporting by patients. If patients disagree with clinicians on symptoms, previously derived diagnostic rules may be inaccurate.
Methods: We performed a secondary data analysis of a prospective, nonrandomized cohort study at a university student health center. Patients who reported an upper respiratory complaint were required to report symptoms, and their clinician was required to report the same list of symptoms. We examined the performance of 5 previously developed clinical decision rules (CDRs) for influenza on both symptom reports. These predictions were compared against PCR diagnoses. We analyzed the agreement between symptom reports, and we built new predictive models using both sets of data.
Results: CDR performance was always lower for the patient-reported symptom data, compared with clinician-reported symptom data. CDRs often resulted in different predictions for the same individual, driven by disagreement in symptom reporting. We were able to fit new models to the patient-reported data, which performed slightly worse than previously derived CDRs. These models and models built on clinician-reported data both suffered from calibration issues.
Discussion: Patients and clinicians frequently disagree about symptom presence, which leads to reduced accuracy when CDRs built with clinician data are applied to patient-reported symptoms. Predictive models using patient-reported symptom data performed worse than models using clinician-reported data and prior results in the literature. However, the differences are minor, and developing new models with more data may be possible.
- Clinical Decision Rules
- Cohort Studies
- Infectious Diseases
- Influenza
- Prospective Studies
- Respiratory Tract Diseases
- Students
- Telemedicine
- Triage
Introduction
Influenza causes disease in millions of individuals, including hundreds of thousands of hospitalizations, every year in the United States alone.1 Globally, seasonal influenza is estimated to cause hundreds of thousands of deaths each year, disproportionately affecting the elderly.2
Clinical decision rules (CDRs, also called clinical prediction rules) are tools used by physicians to diagnose patients based on observable evidence.3⇓⇓–6 Since many of these CDRs are based on signs and symptoms which can be observed by patients, CDRs may be a useful tool for remote forward triage services. However, patients and clinicians can disagree on what symptoms are present.7⇓⇓⇓⇓⇓⇓–14 Most CDRs based on signs and symptoms were designed using clinician-reported data. The usefulness of these rules for remote triage therefore depends on whether patients can accurately provide necessary information. Robust forward triage systems have the potential to reduce burden on the health care system, but to our knowledge, no one has studied whether these rules are valid in a remote health care context.
The recent rise in telemedicine may provide unique opportunities to reduce influenza transmission during epidemics,15,16 as well as improve surveillance,17,18 diagnosis,19 and treatment.20 Virtual visits are becoming more popular, and can improve the quality and equity of health care.21 Implementing forward triage systems, which sort patients into risk groups before any in-person health care visits, through telemedicine can leverage these advantages, especially if automated systems are implemented. Patients who have low risk could be recommended to stay home, rather than seeking in-person health care services.21⇓–23 Screening out these low risk patients reduces the potential contacts for infected individuals receiving in-person health care, potentially reducing transmission during an epidemic.24,25
In our analysis, we evaluated several previously developed CDRs for the diagnosis of influenza to see how they performed for both clinician and patient-reported symptoms. We then examined differences between symptom reports by patients and by clinicians to determine if disagreement was a major factor in determining differences in CDR performance. Finally, we fit similar models to patient-reported symptom data to determine if updated CDRs would be beneficial for triage. More accurate CDRs for triage could reduce the burden of influenza by reducing transmission and improving treatment.
Methods
Collection and Preparation of Data
The data used in this secondary analysis were collected from a university health center from December 2016 through February 2017. Patients with an upper respiratory complaint filled out a questionnaire before their visit, and indicated the presence or absence of several symptoms. Patients were required to answer all questions on the survey. At the time of the visit, a clinician was required to mark the same symptoms as present or absent. Previous publications detail the study design and data collection methods.26,27 Briefly, patients 18 years and older who presented with influenza-like illness (ILI) were recruited and given informed consent. ILI was defined as cough or at least two of the following symptoms: headache, fever, chills, fatigue, muscle pain, sore throat, or joint pain. Patients were excluded if English was not their preferred language for appointments, they did not provide consent, or they withdrew consent at any time. All data were deidentified before we received them.
A total of 19 symptoms and the duration of illness were assessed by both the clinician and patient. Duration of illness was collected as free text data, so we recoded this variable as a dichotomous indicator of whether the onset of disease was less than 48 hours before the clinic visit, which we called acute onset. Going forward, when we say “symptom,” we include acute onset as well.
In our study sample, all patients received a diagnosis from the clinician, but some additionally received a PCR diagnosis. Clinicians in our study were not blinded to lab results before making a diagnosis, but still sometimes disagreed with PCR results (see Appendix). Since PCR is considered the “gold standard” of viral diagnoses,28 we elected to use the PCR subset for our analyses. The PCR tested for both influenza A and influenza B, and we report the number of observed cases of each type. In all our following analyses we combined influenza A and B cases, which is consistent with the methodology of previous studies.29,30
We estimated the prevalence of each symptom as reported by clinicians and by patients in the overall group, as well as stratified by diagnosis. We also report descriptive statistics for age and sex, which were collected for the PCR subset of the study.
Evaluation of Clinical Decision Rules
We applied several CDRs to both patient-reported and clinician-reported symptom data. We chose to apply five CDRs in total that could be used by a clinician or implemented as part of a telemedicine screening service. We used three heuristic decision rules: presence of both cough and fever (CF); presence of cough and fever with acute onset of disease (CFA); and presence of cough, fever, and myalgia all simultaneously (CFM).31,32 We also used a weighted score rule derived from a logistic regression model (WS), which included both fever and cough simultaneously, acute onset, myalgia, chills or sweats;29 and a decision tree model (TM), which included fever, acute onset, cough, and chills or sweats.30
The three heuristic rules all produce binary outcomes, assigning a patient to the high risk group if they display all indicated criteria, or the low risk group otherwise. The score and tree both produce numeric probabilities of predicted risk, which were converted into risk groups using predefined thresholds. Patients with risk below 10% (the testing threshold) were assigned to the low risk group, patients with risk below 50% (the treatment threshold) were assigned to the moderate risk group, and patients with risk at least 50% or greater were assigned to the high risk group, following a standard model of threshold diagnosis.22,29 As a sensitivity analysis, we varied these thresholds (shown in the Appendix). We compared the performance in our data to previously reported performance metrics.6 For the heuristic rules, AUROCC (equivalent to balanced accuracy in the case of binary predictions) values were derived from the sensitivity and specificity reported in the original article.32 For the WS, AUROCC was taken from a previous external validation and was calculated on the entire set of patients.6,33 For the TM, AUROCC was calculated from the validation set.30
We evaluated the agreement between patient and clinician symptom reporting using unweighted Cohen’s kappa.34 Qualitative assessment of agreement using the kappa estimates was based on previously published guidelines for use in medical settings.35 As a sensitivity analysis, we calculated the percent agreement, the prevalence-and-bias-adjusted kappa (PABAK),36 Gwet’s AC1 statistic37,38, and Krippendorff’s α statistic38,39 (shown in the Appendix). We calculated 95% confidence intervals for these statistics using the empirical percentiles of the statistic of interest calculated on 10,000 bootstrap resamples.41
Developing New Prediction Models
We assessed whether patient-reported symptom data could be used to build CDRs with better performance. We fit new models separately to the patient-reported and clinician-reported data. To better assess the performance of our new models, we divided our data into 70% derivation and 30% validation subgroups. Sampling for the data split was stratified by influenza diagnosis to ensure the prevalence of both groups was similar to the overall prevalence.
To develop a weighted score, we used several variable selection methods to fit models, and selected our final model based on AIC, a priori important symptoms, and parsimony. We fit a multivariable logistic regression model with diagnosis predicted by the selected variables, and rounded the coefficients to the nearest half (coefficients were doubled if rounding resulted in half-points). We fit a secondary logistic regression model with diagnosis predicted only by the score to estimate the risk associated with each score value.
We considered four different tree-building algorithms to construct a decision tree model: recursive partitioning (CART),42,43 fast-and-frugal tree44,45, conditional inference46⇓–48, and C5.0.49⇓–51 We then selected the best tree using Area Under the Receiver Operating Characteristic Curve (AUROCC) and parsimony. We did not manually prune or adjust trees.
Finally, we fit several machine learning models, which are less interpretable but often more powerful. We used 10-fold cross-validation repeated 100 times on the derivation set to train the models. We evaluated the performance of all models using AUROCC. All models were trained only on the derivation set, and performance was estimated on both the derivation set and the validation set separately. The Appendix contains more details on our methodology.
Implementation
Our study is a secondary data analysis of previously collected data, and the data were not collected with our research questions in mind. A formal hypothesis testing framework is inappropriate in this context, as tests would have limited power and inflated false discovery rates. Therefore, we elected not to conduct any formal hypothesis tests, and our results should be interpreted as exploratory.
All analyses, figures, and tables were completed in R version 4.3.0 (2023-04-21 ucrt)52 using the boot package,40,41 and several packages from the tidyverse suite.53⇓⇓⇓⇓⇓⇓⇓–61 We fitted our models using the tidymodels infrastructure62⇓⇓⇓⇓⇓⇓⇓⇓–71. The manuscript was prepared using R markdown with the bookdown package.72⇓⇓–75 Tables were generated with gtsummary76 and flextable.77 Figures were generated with ggplot2.59,78
In the Appendix, we provide detailed session information (including a list of packages and versions), all necessary code and data, and instructions for reproducing our analysis.
Results
Descriptive Analysis
In total, there were  patients in our study with symptom reports and a PCR diagnosis. The prevalence in our data was about
  (
127 out of
250 patients), with
118 cases of Influenza A and
9 cases of influenza B. There were slightly more females
(
127 out of
250 patients), with
118 cases of Influenza A and
9 cases of influenza B. There were slightly more females  than males
  in the group, and most participants were young adults. Only
  of participants were older than
22.
of participants were older than
22.
The prevalence of each symptom is shown in Table 1. Patients tended to report more symptoms than clinicians. Cough and fatigue were slightly more common in influenza positive patients, while chills/sweats and subjective fever were much more common in influenza positive patients. No symptoms were more common in influenza negative patients. Overall, clinicians reported several symptoms less commonly than patients: chest congestion, chest pain, ear pain, shortness of breath, and sneezing. Physicians were more likely to report fever, runny nose, and pharyngitis. Some symptoms also show interaction effects between the rater and the diagnosis. (ie, one rater was more likely to report a symptom, but only in one diagnosis group.) For example, clinicians more commonly reported eye pain in influenza positive patients, and less commonly reported headache in influenza negative patients.
Prevalence of Each Symptom as Reported by Clinicians and Patients
Evaluation of Previous Influenza CDRs
Table 2 shows the five CDRs we applied (CF, CFA, CFM32; WS29; and TM30), the symptoms they use, and the previously reported AUROCC for each CDR. The table also shows the AUROCC when the rule was used to make predictions with the patient and clinician reported symptoms. A CDR that makes perfect predictions would have an AUROCC of 1, while random guessing would have an AUROCC of 0.5.
Details on Previously Developed CDRs Along with Prior Reported AUROCC
The CFA and TM rules performed worse on our data, while the CF, CFM, and WS rules performed slightly better. The WS rule was the best performing rule using the clinician-reported symptom data, while multiple rules (WS, TM, and CF) performed similarly on the patient data. Every score performed worse when the patient-reported symptoms were used, but any CDR that performed better than previously reported was still better when the patient-reported data were used. The drop in performance was small for most rules: CF, CFA, and the tree model were only slightly different from the clinician-reported symptom metrics. There was a substantive drop in performance for the CFM rule and the WS.
Analysis of CDR Agreement
To investigate the differences between patient-based and clinician-based CDR performance, we assessed the agreement between their predictions. For the three discrete heuristic CDRs, we obtained Cohen’s kappa values of  for CF,
  for CFA, and κ = 0.50; 95% CI: 0.39,0.60 for CFM. All the kappa values represent a moderate level of agreement.35 Table 3 shows the contingency tables for each of the heuristic rules with the PCR diagnosis. Patients had a slightly lower accuracy for each of the three rules, despite a higher specificity (true negative rate). Clinicians had a higher sensitivity (true positive rate) for all three rules.
Number of Patients Who Were Predicted to Have Influenza by Each of the Three Heuristic CDRs, Which Produce Binary Outcomes
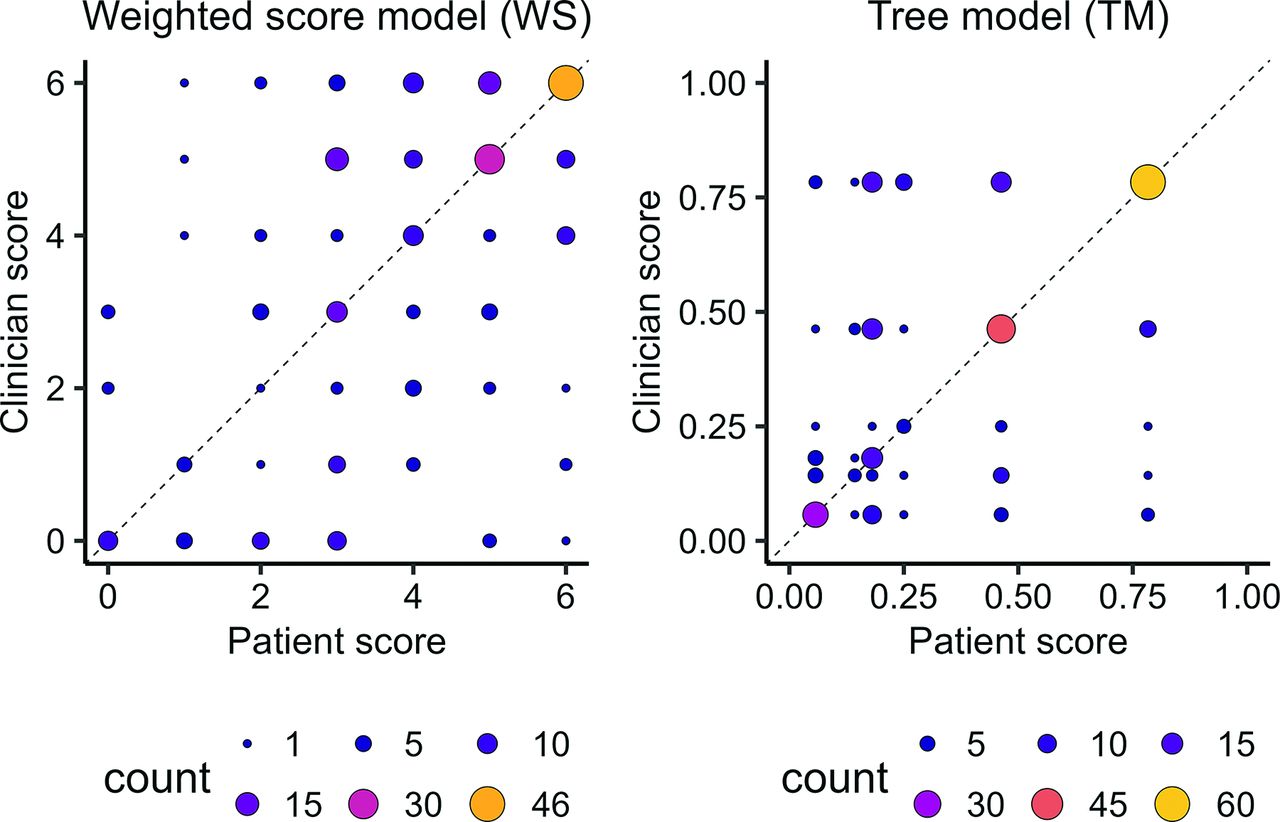
Rather than discretizing the predictions from the WS and TM, we visually assessed the correlation between the results from clinician-reported and patient-reported symptoms (Figure 1). Most of the scores tended to be large, and patients and clinicians tended to agree more on larger scores. For the TM, patients and clinicians were also likely to agree when the model predicted its minimum value for a patient.

Cohen’s kappa values for each symptom. Cohen’s kappa was used to measure agreement between clinician diagnoses and the lab test methods. Qualitative agreement categories were assigned based on previously published guidelines for clinical research.
Assessment of Interrater Agreement
To understand the disagreement in CDR predictions between patient-reported and clinician-reported data, we examined the agreement between clinician and patient symptom reports. Figure 1 shows the calculated Cohen’s kappa statistics and confidence intervals for each symptom. The only symptom which achieved moderate agreement was acute onset ( ), according to the clinical guidelines. Symptoms with weak agreement were cough (
 ), chills and sweats (
 ) and subjective fever (
 ), which were common across the CDRs we used. However myalgia (minimal agreement;
  ) was also included in some of the CDRs.
Patients tended to report a higher number of symptoms overall (Figure 2), including symptoms which were rarely reported by physicians like tooth pain, and symptoms with specific clinical definitions like swollen lymph nodes and chest congestion (Table 1). Patients also were less likely to report certain symptoms, including pharyngitis, runny nose, and nasal congestion. These discrepancies occur for symptoms with lower Cohen’s kappa values. However, patients and physicians were about equally likely to report acute onset, supported by a higher kappa value.

Clinician versus patient scores for both of the continuous CDRs. The CDRs only have a discrete set of outputs, so the size and color of the points reflects the number of patients (overlapping observations) at each location. If the models agreed perfectly, all observations would fall on the dashed line.
In our sensitivity analysis using other measurements of inter-rater agreement, there were no qualitative differences when using other kappa-based statistics. Krippendorff’s α showed inconsistent trends.
Development of New Models
The differences between patient-reported and clinician-reported symptoms, and subsequent differences in CDR performance, suggest that CDRs developed using patient data might perform better than previous scores developed using clinician-reported data. We built new models using the patient-reported data by emulating the previously developed rules. We selected a point score, a decision tree, and a machine learning algorithm for further examination. We split the data into a derivation set of 176 patients, and a validation set of the remaining 74 patients. All models were trained only on the derivation set.
Based on our selection criteria, the best score model used symptoms selected via LASSO penalization.79 The score model contained the symptoms chills or sweats (2 points), cough (5 points), and fever (4 points). The tree we selected was a conditional inference tree containing the variables fever, shortness of breath, wheeze, and cough. Out of the machine learning models we fit, we selected a naive Bayes classification model, which performed competitively on both the clinician-data and patient-data models, and included all symptoms. For comparison, we applied the same modeling procedures to the clinician-reported symptom data. (See Appendix for modeling details.)
Table 4 shows the AUROCC of each of the selected models, using the clinician and the patient data. When trained on the clinician-reported data, the score and naive Bayes models performed better on both the derivation and validation sets than when trained on the patient-reported data. The conditional inference tree performed better on the validation group but worse on the derivation group when trained on the clinician data.
Derivation Set and Validation Set AUROCC for Each of the Three Selected Models, Trained and Evaluated on Either the Clinician or Patient Data
When trained to the patient-reported symptom data, all three models performed well on the derivation group, but their performance dropped substantially on the validation group. The validation group performance estimates the performance on new data, so all three models are likely overfit. The naive Bayes model appeared to overfit the least.
We examined the quantitative risk predictions made by the models, categorizing patients with risk  as low risk, patients with risk
  but
but  as medium risk, and patients with risk
  as high risk. All three models assigned over half of the study participants to the high-risk group, and almost none to the low-risk group (Table 5). Patients in the high-risk group are recommended to seek in-person care in the context of a telemedicine forward triage system.
Risk Group Statistics for the Models Built Using the Patient Data. The Models Were Trained Using the Derivation Set of Patient-Reported Symptom Data, and Evaluated on Both the Derivation and Validation Sets Separately
If we increase the thresholds for risk groups, a few more patients are classified as low or moderate risk. For the patient data models, the majority of patients remain in the high risk group. As a sensitivity analysis, we used the same procedures to fit models to the clinician-reported data. While models fit to the clinician data were slightly better at identifying low- and medium-risk patients, the majority of patients were still placed in the high risk group by these models (see Appendix).
Discussion
We found that previously developed CDRs perform less well when used with patient-reported symptom data, as opposed to clinician-reported symptom data. Our analysis implies that patient-reported symptom data are likely to be less reliable for influenza triage than clinician-reported symptom data. We observed notable disagreement in many influenza-like illness symptoms, which may explain this discrepancy. Neither the previously developed CDRs, nor our new models fit to the patient-reported data could achieve the same performance with patient-reported symptom data as the best models using the clinician-reported data. However, evaluating the magnitude of these differences is difficult, and further evaluation (eg, a cost-benefit analysis) is necessary to determine whether the difference in predictive power of the models is meaningful in clinical practice.
As clinicians train for several years to identify signs and symptoms of illness, our results may not be surprising. Previous studies identified that patients and clinicians defined “chest congestion7”, sinus-related symptoms,11,12 and throat-related symptoms (among others).13 Given the prior evidence for multiple symptoms, similar discrepancies likely exist with other symptoms. The design of the questionnaire could potentially be modified to better capture the information that would be gained by a clinician’s assessment of the patient. The prior work suggests that patients may not understand what a given symptom means, so providing definitions or guides to self-assessing a symptom may be beneficial. Consistent with prior observations, patients in our study also tended to report more symptoms, which could point to issues with the questionnaire designed. All patients in our study were those who sought out health care and wanted to see a clinician, which may bias the reporting of symptoms. This bias might be present in a telemedicine triage context as well.
Our study was limited by a small sample size with accurate diagnoses, which makes fitting predictive models difficult, and a larger sample with accurate reference standards might provide more insight. Our study sample was also composed of young adults aged 18–25 living on a college campus. Our sample is likely unrepresentative of the general population, and our results may reflect a healthy worker bias. Young adults who are able to attend college are typically at low risk for influenza complications, and our study sample is biased toward less severe cases of influenza, which may be more difficult to distinguish from other nonsevere ILIs (eg, rhinovirus or RSV). This bias could explain our issues with model calibration in the low risk group – without any truly high risk patients in our sample, the risk predictions cannot be accurately calibrated. More demographic variation in future studies would also allow for known risk factors like age to be implemented in influenza risk models.
Analyzing the model goodness-of-fit using risk group predictions reveals further questions. Inclusion criteria for our study population included seeking health care and presenting with at least 2 symptoms, so potentially every member of our population is at high risk of influenza. The distribution of risk estimates in our population indicates that patient-reported CDRs might be viable in other populations which is more likely to feature diverse “true” risks of influenza across individuals.
Furthermore, combining patient-reported questionnaires with home rapid testing may provide a viable alternative to prediction methods based only on symptom data.80 While rapid tests have a high false negative rate, they are cheap (compared with PCR testing), easy to use, and may provide more objective information. Combining rapid tests with symptom questionnaires and CDRs that are optimized for detection of low-risk cases may counterbalance the low sensitivity of the test.
In conclusion, we find that patient-reported symptom data are less accurate than clinician-reported symptom data for predicting influenza cases using CDRs. Our results follow naturally from previous work showing discrepancies between clinician and patient reports of symptoms, and highlight critical issues with patient-based triage systems. However, clinical evaluation is needed to determine whether the difference in performance is meaningful in a real-world context. We conjecture that improved questionnaires or the possible addition of home test results could make patient reports more useful. Regardless, improving remote triage for telemedicine cases is critical to prepare public health infrastructure for upcoming influenza pandemics. These CDRs may be a cost-effective tool for combating future influenza epidemics, but further development is needed.
Acknowledgments
We thank the Infectious Disease Epidemiology Research Group at the University of Georgia for feedback on our research.
Appendix.Use of Patient-reported Symptom Data in Clinical Decision Rules for Predicting Influenza in a Telemedicine Setting
1. Instructions for Reproducing Analysis
1. Either clone the git repository, or download and unzip the folder.
2. Navigate to the “R” subdirectory and follow the directions there for the order to run code files.
3. When you run a code file, either “run all” or “source” the script from your IDE/GUI. (You could also run via command line if you prefer but it is unnecessary.)
2. Detailed Methods and Results
2.1 Sample Size and Data Cleaning
In total, we had records for 3117 unique visits to the clinic. Of these records, 7 were duplicate entries in the data set we received, which were removed as they were attributable to clerical issues with the electronic system. In addition, 635 were missing symptom data. These records were collected during the first few weeks of data collection, and missing values were due to issues with the collection protocol and database. These patients were excluded from the analysis, as the mechanism of missingness was known to be unrelated to any of the fields of interest. The final study sample included 2475 with complete data, not all these patients received a lab diagnosis.
All patients received a final diagnosis by their clinician. One subset of 250 patients received reverse transcription polymerase chain reaction (PCR) diagnoses, and a second, mutually exclusive subset of 420 patients received rapid influenza diagnostic test (RIDT) diagnoses. Patients were specifically recruited into the PCR group, and out of patients in the “usual care” (non-PCR) group, RIDT tests were administered at the clinician’s discretion. Notably, the original study1 reported 264 records in the PCR group, but we only had 250 nonmissing nonduplicate patients in this group.
2.2 CDR Assessment
We note that the TM utilizes the patient’s measured temperature rather than subjective fever. However, patients were not asked to measure their own temperature at home during our study, so we assumed that any report of subjective fever corresponded with a fever greater than 37.3°C. This likely impacted the performance of the TM on our data.
2.3 Score Models
To develop a weighted score CDR, we followed the method used for the development of the FluScore CDR2, with some minor deviations. We examined the differences in symptom prevalences between diagnostic groups, correlations between symptoms, univariate logistic regression models for each symptom, a full multivariable model, a multivariable model using bidirectional stepwise elimination for variable selection, and a multivariable model using LASSO penalization for variable selection to determine which predictors should be included in the score. We constructed several candidate scores and used information criteria (AIC/BIC), our knowledge of a priori important symptoms3, and parsimony to choose the best score model. We fit a multivariable unpenalized logistic regression model including the identified predictors of interest and then rounded the coefficients (doubling to avoid half points) to create a score model. Appendix Table 1 shows the performance of the candidate models when using the patient-reported symptom data. Since the names of each model were arbitrarily chosen by us, we show the coefficients with confidence intervals for each of the score models in Appendix Table 2. Coefficients and confidence intervals for each of the score models fit to the clinician-reported symptom data are shown in Table 3.
Model Performance Metrics for the Score Models
Estimated Logistic Regression Coefficients (b) for the Patient-Reported Symptom Data
Estimated Logistic Regression Coefficients (b) for the Clinician-Reported Symptom Data
Contigency Table for PCR versus Unblinded Clinician Diagnoses for the Same Patients
Estimated AUROCC for All Candidate Models
2.3.1. Tree Models
The best tree model was selected based on AUROCC, unnecessary shown in Appendix Table 5. A diagram of the conditional inference tree fitted to the patient data is shown in Figure 1, and the tree fitted to the clinician data is shown in Figure 2
2.3.2. Machine Learning Models
The candidate machine learning models were CART, conditional inference, and C5.0 decision trees with hyperparameter tuning; Bayesian Additive Regression Trees (BART); random forest; gradient-boosted tree using xgboost; logistic regression; logistic regression with LASSO penalization; logistic regression with elastic net penalization; k-Nearest Neighbors (knn); naive Bayes; and Support Vector Machine (SVM) models with linear, polynomial, and Radial Basis Function (RBF) kernels.
Hyperparameters were selected for these models via a grid search with 25 candidate levels for each hyperparameter chosen by latin hypercube search of the parameter space. Candidate models were evaluated using 10-fold cross validation repeated 100 times on the derivation set (for precision of out-of-sample error estimates), and the hyperparameter set maximizing the AUROCC for each model was selected as the best set for that model. We then evaluated the models by fitting the best model of each time to the derivation set, and examining the out-of-sample performance on the validation set. Several of these models had similar validation set performances (AUROCC within 0.01 units).
We selected the naive Bayes model as the model to present in the main text due to the competitive performance on both the clinician and patient data, and the relative simplicity of the classifier. While the naive Bayes model is difficult to interpret and difficult to compute by hand, the calculations are computationally efficient and simple. In a telemedicine setting where all calculations can be automated, these limitations matter much less than they would in a traditional health care setting.
3. Clinician and PCR Agreement
We had many more patients included in our study with clinician diagnoses ( ) than PCR tests (
 ). Using a larger sample size would likely help with model fitting. However, the clinicians in our study saw the PCR results before they made their final diagnosis, so we cannot directly assess the accuracy of the clinicians at predicting influenza.
Despite having access to the PCR diagnoses, however, clinicians only agreed with the PCR results  (95% CI:
  ) of the time. Appendix Table 4 shows the contingency table of diagnoses by the clinicians versus the PCR results.
4. Additional IRR Statistics
There are known problems with the interpretation of Cohen’s kappa statistic. Cohen’s kappa depends on the prevalence and variance of the data. That is, the percentage of yes/no answers affects Cohen’s kappa, even if the actual percent agreement stays the same. Cohen’s kappa is maximized when half of the cases are true ‘yes’ answers and half are true ‘no’ answers, which can lead to low kappa values when prevalence is high or low, regardless of the actual percentage agreement. This property is sometimes called “the paradox of kappa”4,5.
Alternative statistics to Cohen’s kappa have been proposed, including the prevalence-and-bias-adjusted kappa (PABAK)6, Gwet’s AC1 statistic7,8, and Krippendorff’s α statistic8,9. In addition to calculating Cohen’s kappa, we calculated the percent agreement along with these three additional statistics (Figure 3). The percent agreement is not corrected for chance agreement. PABAK and AC1 are corrected for chance agreement and were developed to limit the so-called “paradox of kappa.” Finally, Krippendorff’s α is based on correcting chance disagreement rather than chance agreement, and whether it is similar or different from kappa-based statistics is inconsistent.
Our observed Krippendorff’s α values vary widely, and do not show a general trend along with the kappa-type statistics we computed. In general, the AC1 and PABAK values follow the same trend as the reported Cohen’s kappa values in the main text. Notably, Gwet’s AC1, when interpreted with the same guidelines used for Cohen’s kappa, is larger and assigns some symptoms to a higher agreement level. Cough and pharyngitis are marked as high agreement using AC1, which may indicate that pharyngitis should be considered in the development of influenza CPRs. Since pharyngitis was not included in the CPRs we tested, and cough already had one of the highest agreement ratings in our main analysis, these findings do not substantially change our conclusions.
5. Performance of All Models
We evaluated the performance of all the candidate models. Appendix Table 5 shows the derivation and validation set AUROCC values on both the clinician-reported and patient-reported data for all the models we fit.
6. Risk Groups for Clinician Data Models
We used the same 10% and 50% thresholds to place patients into risk groups using models fit to the clinician-reported symptom data. We used the same modeling procedures as for the patient-reported data, but model tuning was performed using the clinician-reported data instead.
The models trained to the clinician data, with the exception of the tree model, performed slightly better at placing patients in the low and moderate risk groups (Appendix Table 6). However, the majority of patients were still placed in the high risk group for all 3 of the best-performing models, with no patients being identified as low risk by the conditional inference tree model.
Risk Group Statistics for the Models Built Using the Clinician Data
7. Risk Group Threshold Analysis
While the 10% and 50% thresholds are based on the expert knowledge of practicing physicians,2,10 a recent study suggested increased thresholds of 25% and 60% in the context of telehealth visits for influenza-like illness.11
7.1 25%/60% Thresholds
We recomputed the risk groups and stratum-specific statistics for both the patient (Appendix Table 7) and clinician (Appendix Table 8) reported data using the 25% and 60% thresholds.
Risk Group Statistics for the Models Built Using the Patient Data
Risk Group Statistics for the Models Built Using the Clinician Data
For the patient models, while more patients were classified as low or moderate risk, the majority of patients remained in the high risk group (as compared with the risk groups using the 10% and 50% thresholds). For the clinician data models, the Naive Bayes and LASSO score models showed similar trends. Slightly more patients were categorized as low or moderate risk overall, but the majority of patients remained in the high risk group. However, for the conditional inference tree model, there was an even distribution of patients across the three risk groups.
7.2 30%/70% Thresholds
We additionally recomputed the risk groups and stratum-specific statistics using thresholds of 30% and 70% for both the patients (Appendix Table 9) and clinicians (Appendix Table 10). Increasing the thresholds to be even higher should increase the number of patients in the low risk group, but may be difficult to justify clinically.
Risk Group Statistics for the Models Built Using the Patient Data
Risk Group Statistics for the Models Built Using the Clinician Data
The patient data models continued to exhibit the same problem: even with these high thresholds, the majority of patients were classified as high risk, across all models and both samples. However, the differences from the 25% and 60% threshold analysis are minor. For the clinician data models, most models remained exactly the same, with the exception of the Naive Bayes model on the derivation group. Each of the models only predicts a discrete set of risk estimates, so if a change in the threshold does not reach the next discrete risk estimate, none of the stratum-specific statistics will change.
7.3 Continuous Risk Estimates
Overall, while varying the thresholds did assign more patients to the low and moderate risk groups, with both of our trials, the majority of patients were still assigned to the high risk group. This can be explained by examining the quantitative risk predictions made by the models without binning the estimates into groups.
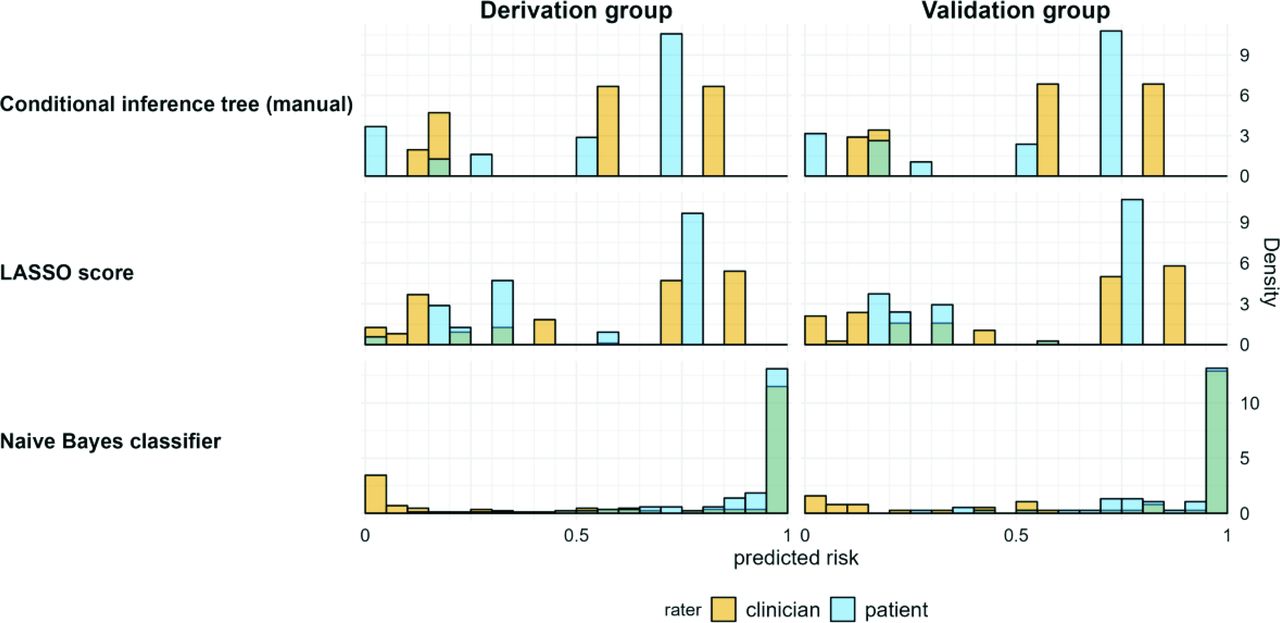
Appendix Figure 4 shows histograms of the predicted risk for each model. The point score and tree models both produce a sparse set of discrete risk outcomes, so varying the threshold does not affect categorizations until the next measurement is crossed. While the naive bayes model has a larger set of possible outcomes, most of the predictions were close to a risk of 1.
We could arbitrarily choose even higher thresholds to attempt to improve the model metrics, or we could computationally optimize the stratum-specific likelihood ratios by choosing threshold values. But it is unlikely that such data-driven threshold choices would be contextually meaningful or robust across multiple studies. Examining model calibration on the continuous risk estimates would be more revealing than optimizing thresholds for categorizing a continuous variable.
8. R Session and Package Information
## R version 4.2.2 (2022-10-31 ucrt)
## Platform: x86_64-w64-mingw32/x64 (64-bit)
## Running under: Windows 10 × 64 (build 19045)
##
## Matrix products: default
##
## locale:
## [1] LC_COLLATE=English United States.utf8
## [2] LC_CTYPE=English United States.utf8
## [3] LC_MONETARY=English United States.utf8
## [4] LC_NUMERIC=C
## [5] LC_TIME=English United States.utf8
##
## attached base packages:
## [1] stats graphics grDevices utils datasets methods base
##
## other attached packages:
## [1] zlib_0.0.1 renv_0.16.0 gtsummary_1.6.2 tidyselect_1.2.0
## [5] dplyr_1.0.10 readr_2.1.3 here_1.0.1 flextable_0.8.3
## [9] knitr_1.41 bookdown_0.31 rmarkdown_2.19
##
## loaded via a namespace (and not attached):
## [1] xfun_0.36 purrr_1.0.1 colorspace_2.1-0
## [4] vctrs_0.5.1 generics_0.1.3 htmltools_0.5.4
## [7] yaml_2.3.6 base64enc_0.1 to 3 utf8_1.2.2
## [10] rlang_1.0.6 pillar_1.8.1 glue_1.6.2
## [13] withr_2.5.0 DBI_1.1.3 gdtools_0.2.4
## [16] uuid_1.1-0 lifecycle_1.0.3 stringr_1.5.0
## [19] munsell_0.5.0 gtable_0.3.1 zip_2.2.2
## [22] evaluate_0.19 tzdb_0.3.0 fastmap_1.1.0
## [25] fansi_1.0.3 Rcpp_1.0.9 scales_1.2.1
## [28] openssl_2.0.5 systemfonts_1.0.4 ggplot2_3.4.0
## [31] hms_1.1.2 askpass_1.1 digest_0.6.31
## [34] stringi_1.7.12 grid_4.2.2 rprojroot_2.0.3
## [37] cli_3.6.0 tools_4.2.2 magrittr_2.0.3
## [40] tibble_3.1.8 tidyr_1.2.1 pkgconfig_2.0.3
## [43] ellipsis_0.3.2 broom.helpers_1.11.0 data.table_1.14.6
## [46] xml2_1.3.3 assertthat_0.2.1 gt_0.8.0.9000
## [49] officer_0.5.1 rstudioapi_0.14 R6_2.5.1
## [52] compiler_4.2.2

The conditional inference tree, fitted to the patient data.

The conditional inference tree, fitted to the clinician data.

Additional IRR statistics for agreement between symptom reports. Abbreviations: IRR, Incidence rate ratio; PABAK, Prevalence-adjusted kappa; CI, Confidence interval.

Histograms of individual risks predicted by the models (shown on the left side). Bins represent a width of 5%. Across all models, patients were more often assigned a high risk, and most patients who were at high risk were assigned the same or very close risk estimates.
Notes
This article was externally peer reviewed.
This is the Ahead of Print version of the article.
Funding: WZB was funded by the University of Georgia Graduate School. AC and JD were funded by National Science Foundation grant #1659683 through the Population Biology of Infectious Diseases Research Experience for Undergraduates site. AH acknowledges partial support from NIH grants AI170116 and U01AI150747.
Conflict of interest: The authors have no conflicts of interest to declare.
To see this article online, please go to: http://jabfm.org/content/00/00/000.full.
- Received for publication March 29, 2023.
- Revision received May 22, 2023.
- Accepted for publication May 25, 2023.
References
- 1.↵
- 2.↵
- 3.↵
- 4.↵
- 5.↵
- 6.↵
- 7.↵
- 8.↵
- 9.↵
- 10.↵
- 11.↵
- 12.↵
- 13.↵
- 14.↵
- 15.↵
- 16.↵
- 17.↵
- 18.↵
- 19.↵
- 20.↵
- 21.↵
- 22.↵
- 23.↵
- 24.↵
- 25.↵
- 26.↵
- 27.↵
- 28.↵
- 29.↵
- 30.↵
- 31.↵
- 32.↵
- 33.↵
- 34.↵
- 35.↵
- 36.↵
- 37.↵
- 38.↵
- 39.↵
- 40.↵
- 41.↵
- 42.↵
- 43.↵
- 44.↵
- 45.↵
- 46.↵
- 47.↵
- 48.↵
- 49.↵
- 50.↵
- 51.↵
- 52.↵
- 53.↵
- 54.↵
- 55.↵
- 56.↵
- 57.↵
- 58.↵
- 59.↵
- 60.↵
- 61.↵
- 62.↵
- 63.↵
- 64.↵
- 65.↵
- 66.↵
- 67.↵
- 68.↵
- 69.↵
- 70.↵
- 71.↵
- 72.↵
- 73.↵
- 74.↵
- 75.↵
- 76.↵
- 77.↵
- 78.↵
- 79.↵
- 80.↵


