
Article Figures & Data
Figures
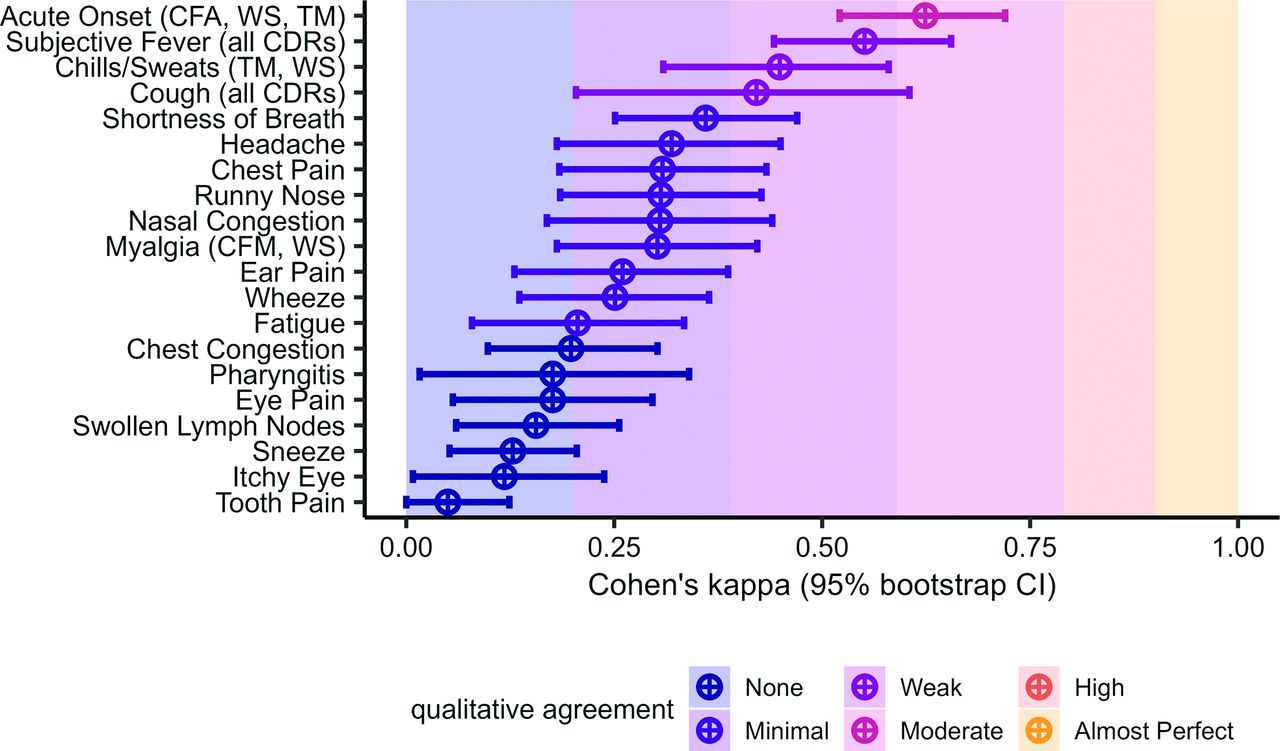
- Figure 1.
Cohen’s kappa values for each symptom. Cohen’s kappa was used to measure agreement between clinician diagnoses and the lab test methods. Qualitative agreement categories were assigned based on previously published guidelines for clinical research.
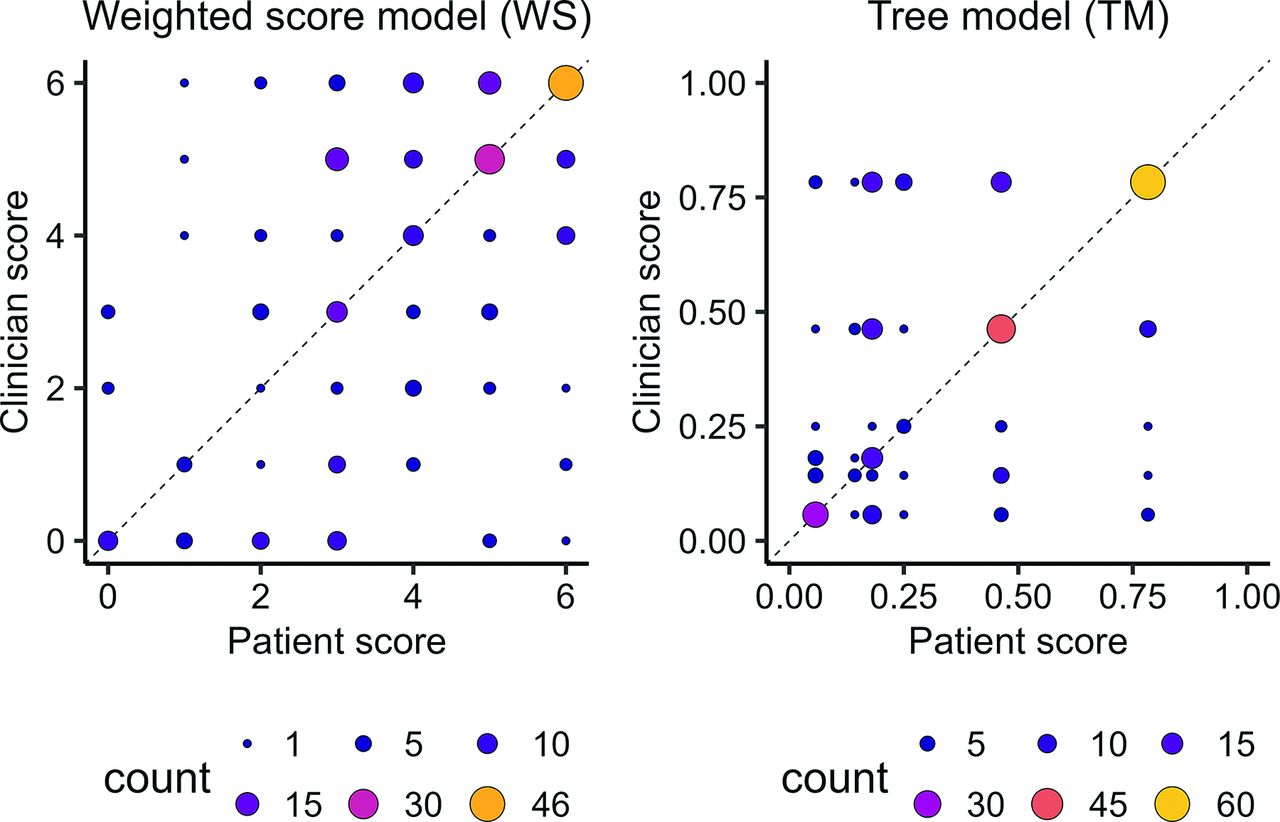
- Figure 2.
Clinician versus patient scores for both of the continuous CDRs. The CDRs only have a discrete set of outputs, so the size and color of the points reflects the number of patients (overlapping observations) at each location. If the models agreed perfectly, all observations would fall on the dashed line.
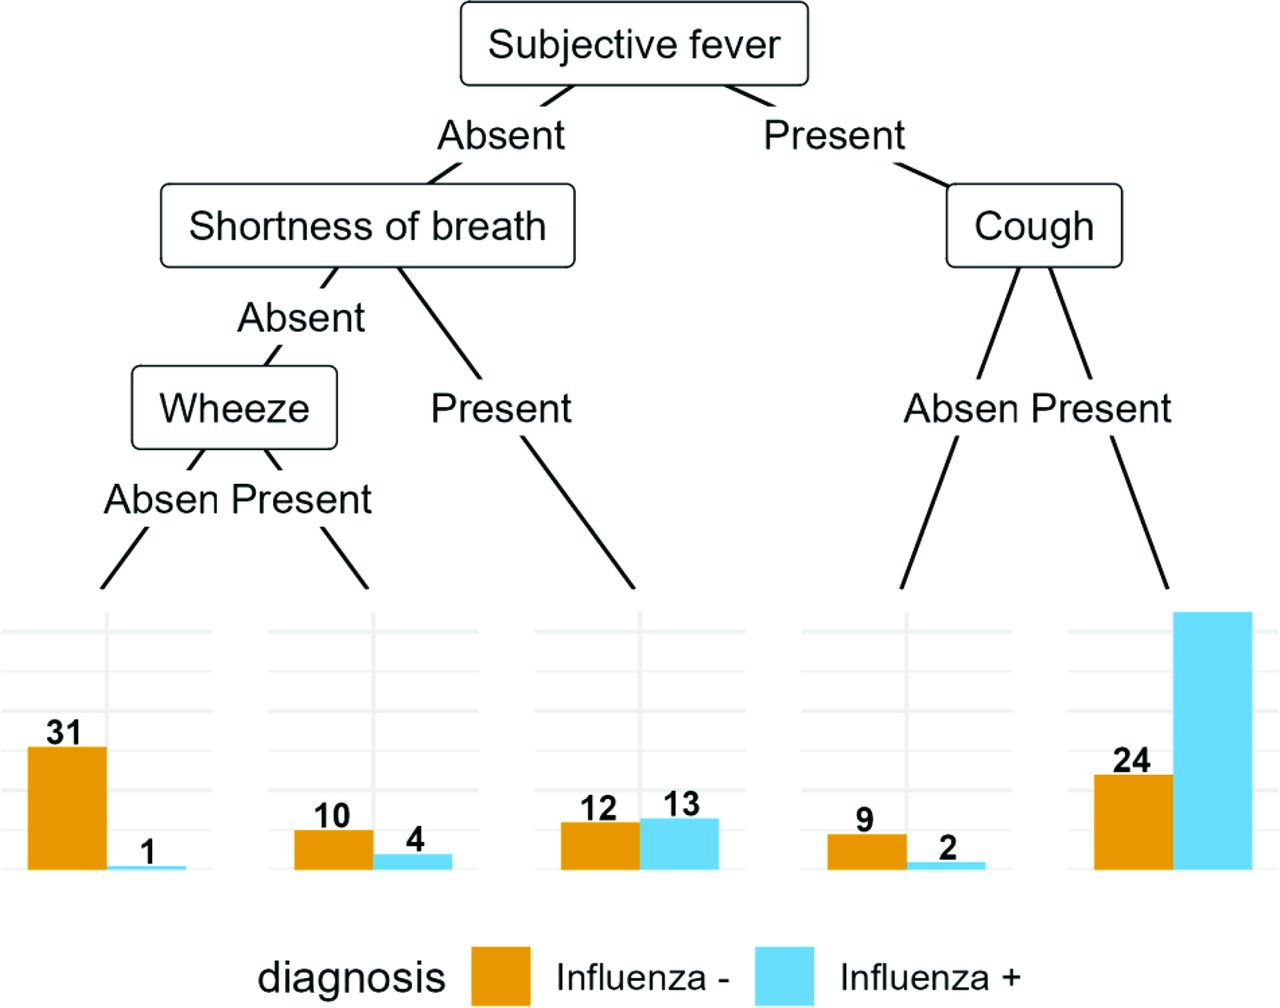
- Appendix Figure 1.
The conditional inference tree, fitted to the patient data.
- Appendix Figure 2.
The conditional inference tree, fitted to the clinician data.
- Appendix Figure 3.
Additional IRR statistics for agreement between symptom reports. Abbreviations: IRR, Incidence rate ratio; PABAK, Prevalence-adjusted kappa; CI, Confidence interval.
- Appendix Figure 4.
Histograms of individual risks predicted by the models (shown on the left side). Bins represent a width of 5%. Across all models, patients were more often assigned a high risk, and most patients who were at high risk were assigned the same or very close risk estimates.


Tables
Influenza + (n = 127) Influenza – (n = 123) Overall (n = 250) Clinician Patient Clinician Patient Clinician Patient Total number of symptoms 10 (4, 17) 11 (6, 20) 8 (3, 15) 10 (4, 18) 10 (3, 17) 11 (4, 20) Acute onset 70 (55%) 65 (51%) 53 (43%) 61 (50%) 123 (49%) 126 (50%) Chest congestion 32 (25%) 80 (63%) 30 (24%) 47 (38%) 62 (25%) 127 (51%) Chest pain 12 (9.4%) 44 (35%) 10 (8.1%) 24 (20%) 22 (8.8%) 68 (27%) Chills sweats 116 (91%) 115 (91%) 76 (62%) 84 (68%) 192 (77%) 199 (80%) Cough 126 (99%) 122 (96%) 111 (90%) 102 (83%) 237 (95%) 224 (90%) Ear pain 7 (5.5%) 27 (21%) 12 (9.8%) 35 (28%) 19 (7.6%) 62 (25%) Eye pain 64 (50%) 21 (17%) 20 (16%) 19 (15%) 84 (34%) 40 (16%) Fatigue 113 (89%) 120 (94%) 75 (61%) 108 (88%) 188 (75%) 228 (91%) Headache 112 (88%) 103 (81%) 76 (62%) 98 (80%) 188 (75%) 201 (80%) Itchy eye 5 (3.9%) 25 (20%) 3 (2.4%) 27 (22%) 8 (3.2%) 52 (21%) Myalgia 106 (83%) 111 (87%) 58 (47%) 98 (80%) 164 (66%) 209 (84%) Nasal congestion 122 (96%) 99 (78%) 101 (82%) 90 (73%) 223 (89%) 189 (76%) Pharyngitis 121 (95%) 106 (83%) 114 (93%) 110 (89%) 235 (94%) 216 (86%) Runny nose 121 (95%) 93 (73%) 97 (79%) 78 (63%) 218 (87%) 171 (68%) Shortness of breath 16 (13%) 55 (43%) 17 (14%) 36 (29%) 33 (13%) 91 (36%) Sneeze 16 (13%) 68 (54%) 12 (9.8%) 57 (46%) 28 (11%) 125 (50%) Subjective fever 113 (89%) 96 (76%) 71 (58%) 58 (47%) 184 (74%) 154 (62%) Swollen lymph nodes 11 (8.7%) 55 (43%) 31 (25%) 62 (50%) 42 (17%) 117 (47%) Tooth pain 0 (0%) 26 (20%) 2 (1.6%) 34 (28%) 2 (0.8%) 60 (24%) Wheeze 15 (12%) 52 (41%) 16 (13%) 31 (25%) 31 (12%) 83 (33%) Notes: We calculated the prevalence of each symptom in the overall subsample, as well as stratified by influenza diagnosis. The table shows the number of participants positive (Point Prevalence) for all symptoms, and the median (Range) for the total number of symptoms.
CDR Symptoms Source Previously Reported Clinician-reported Symptoms Patient-reported Symptoms CF Cough, fever Monto 2000 0.66 0.70 0.69 CFA Cough, fever, acute onset Monto 2000 0.65 0.63 0.61 CFM Cough, fever, myalgia Monto 2000 0.65 0.73 0.68 WS Fever and cough, acute onset, myalgia, chills/sweats van Vugt 2015 0.71 0.77 0.69 TM Fever, acute onset, cough, chills/sweats Afonso 2012 0.80 0.71 0.69 Abbreviations: AUROCC, Area Under the Receiver Operating Characteristic Curve; CDR, Clinical decision rules; CF, presence of cough and fever; CFM, presence of cough, fever, and myalgia; CFA, presence of cough and fever with acute onset of disease; TM, decision tree model; WS, logistic regression model.
Notes: We show AUROCC values reported in previous studies, along with the AUROCC values when our clinician-reported data and patient-reported data are used in the CDRs and compared to the true PCR diagnoses.
- Table 3.
Number of Patients Who Were Predicted to Have Influenza by Each of the Three Heuristic CDRs, Which Produce Binary Outcomes
Clinician (n = 250) Patient (n = 250) Influenza + Influenza − Influenza + Influenza − CF Positive 112 (88%) 60 (49%) 91 (72%) 42 (34%) Negative 15 (12%) 63 (51%) 36 (28%) 81 (66%) CFA Positive 66 (52%) 31 (25%) 50 (39%) 22 (18%) Negative 61 (48%) 92 (75%) 77 (61%) 101 (82%) CFM Positive 100 (79%) 40 (33%) 85 (67%) 38 (31%) Negative 27 (21%) 83 (67%) 42 (33%) 85 (69%) Abbreviations: CDR, Clinical decision rules; CF, presence of cough and fever; CFM, presence of cough, fever, and myalgia; CFA, presence of cough and fever with acute onset of disease.
Notes: The predictions are stratified by PCR influenza diagnosis.
- Table 4.
Derivation Set and Validation Set AUROCC for Each of the Three Selected Models, Trained and Evaluated on Either the Clinician or Patient Data
Derivation group Validation group Clinician Patient Clinician Patient LASSO point score 0.86 0.78 0.71 0.60 Conditional inference tree 0.79 0.80 0.63 0.57 Naive Bayes classifier 0.83 0.79 0.74 0.68 Notes: The same individuals were used in the derivation and validation sets regardless of whether the clinician-reported symptom data or patient-reported symptom data were used for modeling.
Derivation group Validation group Flu/Total (%) LR In Group (%) Flu/Total (%) LR In Group (%) LASSO score Low 0/5 (0.0) 0.0 2.9 0/0 (NA) NA 0.0 Moderate 20/77 (26.0) 0.3 44.3 16/34 (47.1) 0.8 45.3 High 68/92 (73.9) 2.8 52.9 23/41 (56.1) 1.2 54.7 Conditional inference tree (manual) Low 1/32 (3.1) 0.0 18.4 5/12 (41.7) 0.7 15.8 Moderate 6/25 (24.0) 0.3 14.4 6/14 (42.9) 0.7 18.4 High 81/117 (69.2) 2.2 67.2 28/50 (56.0) 1.2 65.8 Naive Bayes classifier Low 0/0 (NA) NA 0.0 0/0 (NA) NA 0.0 Moderate 0/7 (0.0) 0.0 4.0 0/4 (0.0) 0.0 5.3 High 88/167 (52.7) 1.1 96.0 39/72 (54.2) 1.1 94.7 Abbreviations: LASSO, Least Absolute Shrinkage and Selection Operator; LR, stratum-specific likelihood ratio.
Notes: The models were trained using the derivation set of clinician-reported symptom data, and evaluated on both the derivation and validation sets separately. We obtained quantitative risk predictions for each individual from the models, and assigned individuals with a risk less than 10% to the low risk group, individuals with a risk between 10% and 50% to the moderate risk group, and individuals with a risk greater than 50% to the high risk group.
Name AIC BIC Tjur R2 Brier Score LASSO score 196.64 209.28 0.28 0.18 A priori symptom score 198.62 217.58 0.28 0.18 Re-fit FluScore model (Ebell 2012) 199.65 215.44 0.27 0.18 Cough/fever symptom score 199.66 209.14 0.25 0.19 Cough/fever heuristic 200.72 207.04 0.24 0.19 Cough/fever/acute onset symptom score 201.11 213.75 0.26 0.19 Cough/fever/myalgia symptom score 201.34 213.97 0.26 0.19 LASSO heuristic 204.82 211.14 0.22 0.19 Cough/fever/myalgia heuristic 208.96 215.28 0.20 0.20 Cough/fever/acute onset heuristic 232.31 238.63 0.07 0.23 Abbreviation: LASSO, Least Absolute Shrinkage and Selection Operator.
Notes: The models shown were fitted to the patient-reported data, and metrics were calculated using only the derivation set.
- Appendix Table 2.
Estimated Logistic Regression Coefficients (b) for the Patient-Reported Symptom Data
Score Model Symptom b Points 95% CI A priori symptoms Cough 2.85 6 1.41, 4.80 Subjective_fever 1.99 4 1.21, 2.82 Acute_onset −0.27 −1 −1.02, 0.45 Chills_sweats 1.24 2 0.26, 2.29 Myalgia −0.69 −1 −1.85, 0.44 LASSO Chills_sweats 1.07 2 0.13, 2.07 Cough 2.74 5 1.34, 4.66 Subjective_fever 1.81 4 1.09, 2.56 Ebell flu score symptoms Acute_onset −0.39 −1 −1.13, 0.31 Myalgia −0.70 −1 −1.85, 0.43 Chills_sweats 1.16 2 0.20, 2.21 Cough:subjective_fever 2.19 4 1.46, 2.99 CF (unweighted) Cough:subjective_fever 2.17 2 1.50, 2.88 CFA (unweighted) Cough:subjective_fever:acute_onset 1.23 1 0.55, 1.96 CFM (unweighted) Cough:subjective_fever:myalgia 1.93 2 1.28, 2.61 LASSO variables (unweighted) Chills_sweats:cough:subjective_fever 2.05 2 1.39, 2.75 CF (weighted) Cough 2.63 5 1.24, 4.55 Subjective_fever 2.04 4 1.35, 2.77 CFA (weighted) Cough 2.61 5 1.21, 4.53 Subjective_fever 2.10 4 1.39, 2.87 Acute_onset −0.27 −1 −1.00, 0.44 CFM (weighted) Cough 2.68 5 1.27, 4.60 Subjective_fever 2.11 4 1.38, 2.89 Myalgia −0.30 −1 −1.34, 0.75 Abbreviations: LASSO, Least Absolute Shrinkage and Selection Operator; CF, presence of cough and fever; CFM, presence of cough, fever, and myalgia; CFA, presence of cough and fever with acute onset of disease.
Notes: All models were fit only to the derivation set. Confidence intervals for the coefficients were calculated using the Wald Method.
- Appendix Table 3.
Estimated Logistic Regression Coefficients (b) for the Clinician-Reported Symptom Data
Score Model Symptom b Points 95% CI A priori symptoms Cough 2.23 4 0.40, 5.20 Subjective_fever 1.37 3 0.39, 2.40 Acute_onset 0.20 0 −0.51, 0.91 Chills_sweats 0.91 2 −0.14, 1.99 Myalgia 0.67 1 −0.20, 1.52 LASSO Chills_sweats 1.39 3 0.20, 2.65 Subjective_fever 1.46 3 0.38, 2.61 Myalgia −0.39 −1 −1.53, 0.66 Runny_nose 1.49 3 0.14, 3.02 Eye_pain 1.37 3 0.49, 2.30 Swollen_lymph_nodes −2.20 −4 −3.49, −1.08 Ebell flu score symptoms Acute_onset 0.16 0 −0.55, 0.85 Myalgia 0.72 1 −0.12, 1.56 Chills_sweats 0.81 2 −0.22, 1.87 Cough:subjective_fever 1.54 3 0.63, 2.51 CF (unweighted) Cough:subjective_fever 2.27 5 1.50, 3.13 CFA (unweighted) Cough:subjective_fever:acute_onset 1.27 3 0.63, 1.93 CFM (unweighted) Cough:subjective_fever:myalgia 1.95 2 1.30, 2.64 LASSO variables (unweighted) Chills_sweats:subjective_fever:myalgia:runny_nose:eye_pain:swollen_lymph_nodes −0.44 −1 −2.49, 1.38 CF (weighted) Cough 2.62 5 0.86, 5.56 Subjective_fever 2.19 4 1.38, 3.10 CFA (weighted) Cough 2.66 5 0.89, 5.60 Subjective_fever 2.10 4 1.27, 3.03 Acute_onset 0.33 1 −0.36, 1.01 CFM (weighted) Cough 2.18 4 0.35, 5.15 Subjective_fever 1.71 3 0.81, 2.69 Myalgia 0.96 2 0.17, 1.75 Abbreviations: LASSO, Least Absolute Shrinkage and Selection Operator; CFM, presence of cough, fever, and myalgia; CFA, presence of cough and fever.
Notes: All models were fit only to the derivation set. Confidence intervals for the coefficients were calculated using the wald method.
- Appendix Table 4.
Contigency Table for PCR versus Unblinded Clinician Diagnoses for the Same Patients
PCR Positive Negative Total Clinician positive 116 24 140 negative 11 99 110 Total 127 123 250 Abbreviation: PCR, Polymerase chain reaction.
Notes: Most of the time, clinicians agreed with the PCR results, but rarely the diagnoses differed. Justifications for clinician diagnoses were not collected as part of the study.
Derivation group Validation group Clinician Patient Clinician Patient A priori symptom score 0.77 0.79 0.75 0.56 Cough/fever heuristic 0.71 0.75 0.67 0.55 Cough/fever symptom score 0.71 0.76 0.67 0.57 Cough/fever/acute onset heuristic 0.64 0.62 0.61 0.57 Cough/fever/acute onset symptom score 0.73 0.77 0.67 0.55 Cough/fever/myalgia heuristic 0.72 0.72 0.75 0.58 Cough/fever/myalgia symptom score 0.75 0.76 0.74 0.55 Re-fit FluScore model (Ebell 2012) 0.77 0.79 0.74 0.57 LASSO score 0.86 0.78 0.71 0.60 LASSO heuristic 0.50 0.74 0.57 CART (manual) 0.81 0.82 0.67 0.55 FFT 0.77 0.73 0.70 0.53 C5.0 tree (manual) 0.73 0.79 0.65 0.55 Conditional inference tree (manual) 0.79 0.80 0.63 0.57 Bayesian Additive Regression Trees (BART) 0.86 0.81 0.70 0.64 C5.0 tree (tuned) 0.85 0.75 0.60 0.57 CART (tuned) 0.81 0.82 0.67 0.55 Conditional inference tree (tuned) 0.79 0.79 0.63 0.55 Elastic net logistic regression 0.87 0.83 0.70 0.65 Unpenalized logistic regression 0.88 0.84 0.67 0.62 k-Nearest Neighbors classifier 0.89 0.92 0.66 0.65 LASSO logistic regression 0.87 0.83 0.70 0.65 Naive Bayes classifier 0.83 0.79 0.74 0.68 Random forest 0.89 0.87 0.73 0.59 SVM (linear kernel) 0.85 0.82 0.75 0.65 SVM (polynomial kernel) 0.83 0.79 0.74 0.67 SVM (RBF kernel) 0.83 0.82 0.74 0.69 Gradient-boosted tree 0.85 0.87 0.71 0.61 Abbreviations: AUROCC, Area Under the Receiver Operating Characteristic Curve; LASSO, Least Absolute Shrinkage and Selection Operator; SVM, Support vector machines; CART, Classification and Regression Tree Algorithm.
Notes: The AUROCC was not estimable for the LASSO heuristic model on the validation set of clinician-reported symptom data, as all patients were assigned the same score in this set.
Derivation group Validation group Flu/Total (%) LR In Group (%) Flu/Total (%) LR In Group (%) LASSO score Low 0/18 (0.0) 0.0 10.3 3/9 (33.3) 0.5 11.8 Moderate 19/67 (28.4) 0.4 38.5 7/25 (28.0) 0.4 32.9 High 69/89 (77.5) 3.4 51.1 29/42 (69.0) 2.1 55.3 Conditional inference tree (manual) Low 0/0 (NA) NA 0.0 0/0 (NA) NA 0.0 Moderate 9/58 (15.5) 0.2 33.3 8/24 (33.3) 0.5 31.6 High 79/116 (68.1) 2.1 66.7 31/52 (59.6) 1.4 68.4 Naive Bayes classifier Low 4/36 (11.1) 0.1 20.7 1/9 (11.1) 0.1 11.8 Moderate 3/14 (21.4) 0.3 8.0 2/7 (28.6) 0.4 9.2 High 81/124 (65.3) 1.8 71.3 36/60 (60.0) 1.4 78.9 Abbreviations: LASSO, Least Absolute Shrinkage and Selection Operator; LR, Stratum-specific likelihood ratio.
Notes: The models were trained using the derivation set of clinician-reported symptom data, and evaluated on both the derivation and validation sets separately. We obtained quantitative risk predictions for each individual from the models, and assigned individuals with a risk less than 10% to the low risk group, individuals with a risk between 10% and 50% to the moderate risk group, and individuals with a risk greater than 50% to the high risk group.
Derivation group Validation group Flu/Total (%) LR In Group (%) Flu/Total (%) LR In Group (%) Conditional inference tree (manual) Low 3/43 (7.0) 0.1 24.7 8/22 (36.4) 0.5 28.9 Moderate 17/39 (43.6) 0.8 22.4 8/13 (61.5) 1.5 17.1 High 68/92 (73.9) 2.8 52.9 23/41 (56.1) 1.2 53.9 Naive Bayes classifier Low 0/2 (0.0) 0.0 1.1 0/0 (NA) NA 0.0 Moderate 0/10 (0.0) 0.0 5.7 0/5 (0.0) 0.0 6.6 High 88/162 (54.3) 1.2 93.1 39/71 (54.9) 1.2 93.4 LASSO score Low 5/41 (12.2) 0.1 23.6 7/23 (30.4) 0.4 30.7 Moderate 20/49 (40.8) 0.7 28.2 9/12 (75.0) 2.8 16.0 High 63/84 (75.0) 2.9 48.3 23/40 (57.5) 1.2 53.3 Abbreviations: LASSO, Least Absolute Shrinkage and Selection Operator; LR, stratum-specific likelihood ratio.
Notes: We assigned risk groups using a 25% testing threshold and a 60% treatment threshold.
Derivation group Validation group Flu/Total (%) LR In Group (%) Flu/Total (%) LR In Group (%) Conditional inference tree (manual) Low 9/58 (15.5) 0.2 33.3 8/24 (33.3) 0.5 31.6 Moderate 32/58 (55.2) 1.2 33.3 14/26 (53.8) 1.1 34.2 High 47/58 (81.0) 4.2 33.3 17/26 (65.4) 1.8 34.2 Naive Bayes classifier Low 5/42 (11.9) 0.1 24.1 1/13 (7.7) 0.1 17.1 Moderate 8/15 (53.3) 1.1 8.6 4/8 (50.0) 0.9 10.5 High 75/117 (64.1) 1.7 67.2 34/55 (61.8) 1.5 72.4 LASSO score Low 7/58 (12.1) 0.1 33.3 8/24 (33.3) 0.5 31.6 Moderate 12/28 (42.9) 0.7 16.1 2/11 (18.2) 0.2 14.5 High 69/88 (78.4) 3.5 50.6 29/41 (70.7) 2.3 53.9 Abbreviations: LASSO, Least Absolute Shrinkage and Selection Operator; LR, Stratum-specific likelihood ratio.
Notes: We assigned risk groups using a 25% testing threshold and a 60% treatment threshold.
Derivation group Validation group Flu/Total (%) LR In Group (%) Flu/Total (%) LR In Group (%) Conditional inference tree (manual) Low 7/57 (12.3) 0.1 32.8 11/26 (42.3) 0.7 34.2 Moderate 13/25 (52.0) 1.1 14.4 5/9 (55.6) 1.2 11.8 High 68/92 (73.9) 2.8 52.9 23/41 (56.1) 1.2 53.9 Naive Bayes classifier Low 0/3 (0.0) 0.0 1.7 0/1 (0.0) 0.0 1.3 Moderate 0/17 (0.0) 0.0 9.8 1/6 (16.7) 0.2 7.9 High 88/154 (57.1) 1.3 88.5 38/69 (55.1) 1.2 90.8 LASSO score Low 5/41 (12.2) 0.1 23.6 7/23 (30.4) 0.4 30.7 Moderate 20/49 (40.8) 0.7 28.2 9/12 (75.0) 2.8 16.0 High 63/84 (75.0) 2.9 48.3 23/40 (57.5) 1.2 53.3 Abbreviations: LASSO, Least Absolute Shrinkage and Selection Operator; LR, Stratum-specific likelihood ratio.
Notes: We assigned risk groups using a 30% testing threshold and a 70% treatment threshold.
Derivation group Validation group Flu/Total (%) LR In Group (%) Flu/Total (%) LR In Group (%) Conditional inference tree (manual) Low 9/58 (15.5) 0.2 33.3 8/24 (33.3) 0.5 31.6 Moderate 32/58 (55.2) 1.2 33.3 14/26 (53.8) 1.1 34.2 High 47/58 (81.0) 4.2 33.3 17/26 (65.4) 1.8 34.2 Naive Bayes classifier Low 5/45 (11.1) 0.1 25.9 1/13 (7.7) 0.1 17.1 Moderate 8/18 (44.4) 0.8 10.3 4/8 (50.0) 0.9 10.5 High 75/111 (67.6) 2.0 63.8 34/55 (61.8) 1.5 72.4 LASSO score Low 7/58 (12.1) 0.1 33.3 8/24 (33.3) 0.5 31.6 Moderate 12/28 (42.9) 0.7 16.1 2/11 (18.2) 0.2 14.5 High 69/88 (78.4) 3.5 50.6 29/41 (70.7) 2.3 53.9 Abbreviations: LASSO, Least Absolute Shrinkage and Selection Operator; LR, Stratum-specific likelihood ratio.
Notes: We assigned risk groups using a 30% testing threshold and a 70% treatment threshold.


