
Article Figures & Data
Figures
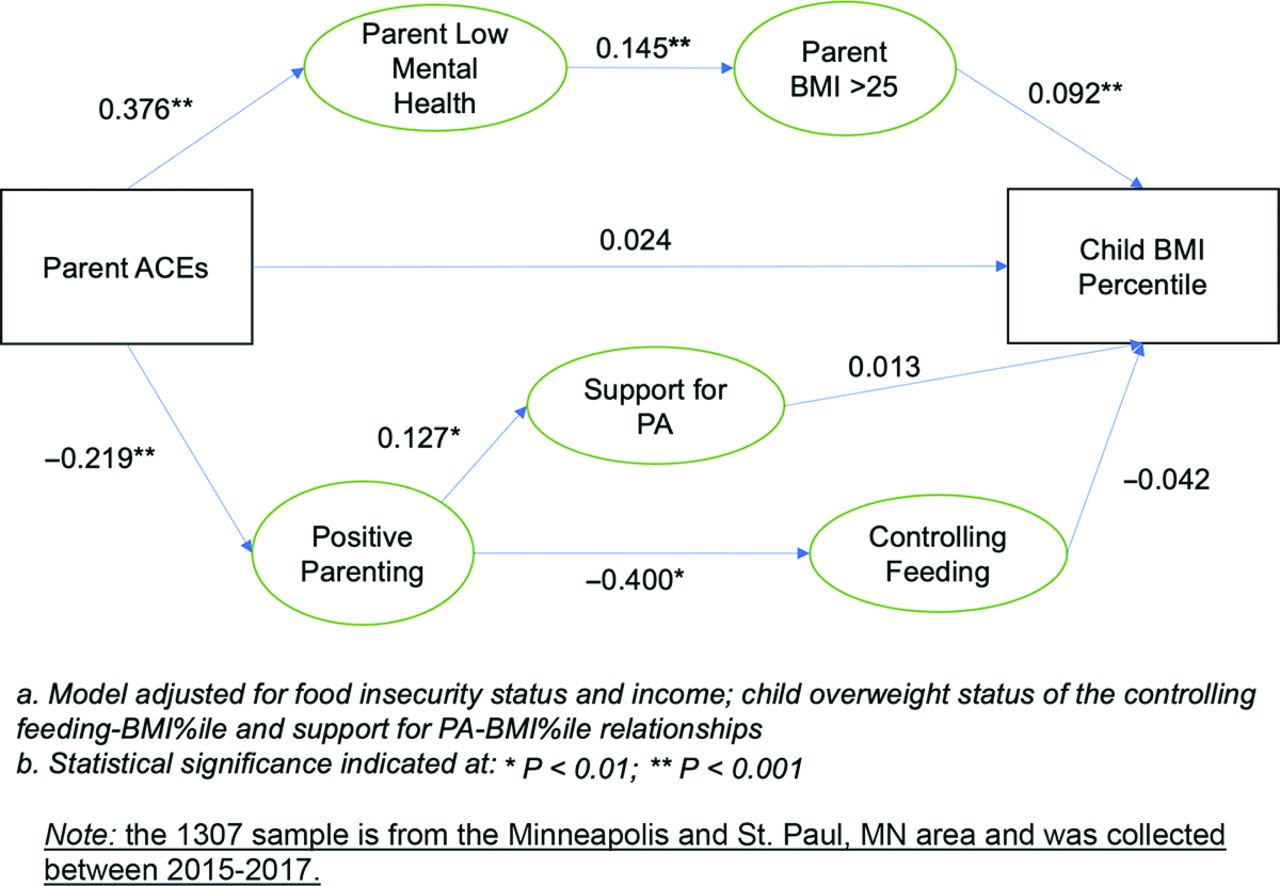
- Figure 1.
Structural equation model standardized path correlates of parent adverse childhood experiences (ACEs) on child body mass index (BMI) percentile: direct and indirect pathways (n = 1307 caregivers).

Tables
- Table 1.
Family Matters Sample Demographic Characteristics and Parent Adverse Childhood Events Frequency
(n = 1307)* Parent and child participant characteristics n (%) Child female 637 (49%) Child age in years (sd) 7.0 (1.5) Child race/ethnicity White 234 (18%) Black or African American 334 (26%) Hispanic or Latino 177 (14%) Asian American 220 (17%) Native Hawaiian or other Pacific Islander 10 (1%) American Indian or Native American 116 (9%) Other 16 (1%) Multiracial 200 (15%) Parent female 1171 (90%) Age in years (sd) 35.7 (7.9) Parent born in the U.S. 859 (66%) Parent immigrant time living in the U.S. Less than 1 year 8 (2%) 1 to less than 5 years 52 (12%) 5–10 years 51 (11%) 10+ years 336 (75%) Parent race/ethnicity White 272 (21%) Black or African American 340 (26%) Hispanic or Latino 186 (14%) Asian American 223 (17%) Native Hawaiian or other Pacific Islander 10 (1%) American Indian or Native American 154 (12%) Other race/ethnicity 19 (1%) Multiracial 103 (8%) Parent survey language English 1148 (88%) Spanish 134 (10%) Hmong/Lus Hmoob 8 (1%) Somali/Soomaali 17 (1%) Parent educational attainment Some high school 183 (14%) High school or associate’s 521 (40%) Some college or bachelor’s 409 (31%) Graduate degree 194 (15%) Household income Less than $20,000 393 (30%) $20,000–$34,999 323 (25%) $35,000–$49,999 203 (16%) $50,000–$74,999 143 (11%) $75,000–$99,999 75 (6%) $100,000 or more 159 (12%) Not reported 11 (1%) Adverse child experiences items and frequencies n (%) Were your parents ever separated or divorced? 533 (41.3%) Was a household member depressed or mentally ill, or did a household member attempt suicide? 306 (23.7%) Did a household member go to prison (including yourself)? 168 (13%) Did you often or very often feel that you didn't have enough to eat, had to wear dirty clothes, and had no one to protect you? 163 (12.7%) Did you often or very often feel that your family didn't look out for each other, feel close to each other, or support each other? 264 (20.5%) Did you often or very often feel that your parents were too drunk or high to take care of you? 143 (11.1%) Was your mother or stepmother often or very often pushed, grabbed, slapped, or had something thrown at her? 142 (11%) Did a parent or other adult in the household often or very often swear at you, insult you, put you down, or humiliate you? 218 (16.9%) Were you physically abused by a parent or guardian? 145 (11.2%) Were you sexually abused by a parent or guardian? 47 (3.6%) Were you sexually abused by someone who was not a parent or guardian? 191 (14.9%) Note: the 1307 sample is from the Minneapolis and St. Paul, MN, area and was collected between 2015 and 2017.
* Frequency proportions may not add to 100% due to rounding.
Exposure variables Parent adverse childhood events (ACEs) Parent ACEs were measured via the online survey through 11 validated items:2,44 (1) Were your parents ever separated or divorced? (2) Was a household member depressed or mentally ill, or did a household member attempt suicide? (3) Did a household member go to prison (including yourself)? (4) Did you often or very often feel that you didn't have enough to eat, had to wear dirty clothes, and had no one to protect you? (5) Did you often or very often feel that your family didn't look out for each other, feel close to each other, or support each other? (6) Did you often or very often feel that your parents were too drunk or high to take care of you? (7) Was your mother or stepmother often or very often pushed, grabbed, slapped, or had something thrown at her? (8) Did a parent or other adult in the household often or very often swear at you, insult you, put you down, or humiliate you? (9) Were you physically abused by a parent or guardian? (10) Were you sexually abused by a parent or guardian? (11) Were you sexually abused by someone who was not a parent or guardian? Response options were “Yes” or “No.” Variables then were indicator coded 1 for affirmative responses and 0 for negative responses, and the mean of these variables was computed to reflect the fraction of the 11 items that were reported as present by the parent. For interpretability, this score was multiplied by 10 so that the interpretation in analysis reflected associations in 10% units. The two most common skipped items were sexual abuse by someone who was not a parent or guardian (n = 10 of 48 nonresponding parents) and not having enough to eat, had to wear dirty clothes; had no one to protect you also was skipped by 10 parents (20.8% of parents who skipped 1 or 2 ACE items). On average, these parents had lower ACE mean scores (1.27 ± 1.52) compared to the full responder parents (1.65 ± 2.2). Pathway variables Parent mental health Parent depressed mood was measured using 6 items from the validated Kessler-6 measure of depressive symptoms.45 Parents were asked about their current level of depressed mood (i.e., How sad or depressed are you feeling right now?). Ecological momentary assessment-reported depressed mood before noon (ie, morning stress) was also analyzed as a continuous random variable with Likert scale values ranging from 0 to 4 (0 = “Not at all,” 1 = “A little,” 2 = “Moderately,” 3 = “Quite a bit,” 4 = “Extremely”). Parent body mass index (BMI) Height and weight were assessed by self-report. Self-reported height and weight has been shown to be highly correlated with objectively measured values in adults.38 BMI was calculated using the standard formula, weight (kg)/height (meters).2 Positive parenting A positive parenting latent variable was operationalized by assessing 4 constructs: authoritative (alpha: 0.823), authoritarian (alpha: 0.530), and permissive parenting (alpha: 0.636) style as well as parenting self-efficacy (alpha: 0.572).46 The three parenting styles were classified from 9 items of a pre-existing validated scale on the online survey that were operationalized as mean scores. Sample items for each parenting style include “I give my child reasons why rules should be obeyed” (authoritative), “I use physical punishment as a way of disciplining” (authoritarian), and “I threaten punishment more often than actually giving it” (permissive). Each item was collected on the original 5-item Likert scale (1 = never; 5 = always). Parent self-efficacy was operationalized using the Early Intervention Parenting Self-Efficacy Scale (EIPSES).47 Parents reported on the assessment of efficacy in parenting across 6 items measured on a 4-item Likert scale (1 = strongly disagree; 4 = strongly agree). All but 1 item, “on most days I can handle the ups and downs of being a parent,” was reverse scored so that the final mean score reflected efficacious parenting. The 3 parenting style scales and the parenting self-efficacy scale were all used to parameterize the positive parenting latent variable. Parent support for physical activity (PA) practices A supportive PA practices latent variable was modeled by combining 3 scales48: support for PA (alpha: 0.754), limiting sedentary activity (alpha: 0.920), and modeling of PA (alpha: 0.865). All items were measured on the online survey from a prior scale.48 Support for PA was assessed through the following 3 questions from a prior scale48: (1) I encourage [child] to use resources in our neighborhood to be active (such as the park and the school); (2) I enroll [child] in community-based programs (such as Parks and Rec, Boys and Girls Club, YMCA) where he or she can be active; (3) I find ways for [child] to be active when school is out by, for example, enrolling him/her in summer camp and after-school programs. Limiting sedentary activity was assessed through 3 questions from a prior scale48: (1) I limit how long [child] plays video games (including PlayStation, Xbox, and Gameboys); (2) I limit how long [child] can watch TV or DVDs each day (including educational and noneducational programs); (3) I limit how long [child] can use the computer, smart phone, or tablet for things other than homework (such as playing computer games, watching YouTube, texting or snapchatting with friends. Both support for PA and limiting sedentary activity had the following response options: 1 = “Strongly disagree”; 2 = “Somewhat disagree”; 3 = “Somewhat agree”; 4 = “Strongly agree.” Modeling of PA48 was assessed through 4 questions from a prior scale48 asking parents during a typical week how often they (1) Encourage [child] to do physical activities or play sports; (2) provide transportation or walk with [child] to a place where he or she can do physical activities or play sports; (3) watch [child] participate in physical activities or sports; (4) do a physical activity or play a sport with [child]. Response options included 1 = “Never/rarely”; 2 = “Once”; 3 = “Sometimes”; 4 = “Almost every day”; 5 = “Every day.” Controlling feeding practices A controlling feeding practices latent variable was modeled by combining 3 scales49: restriction (alpha: 0.675), pressuring (alpha: 0.647), and instrumental feeding (alpha: 0.594). All items were measured on the online survey. Restriction was assessed through the following 4 validated questions from a pre-existing scale49: (1) I have to make sure that [child] does not eat too many sweets (candy, ice cream, cake, or pastries) or his/her favorite foods; (2) I intentionally keep some foods out of [child]’s reach; (3) I offer sweets (candy, ice cream, cake, pastries) or favorite foods to [child] as a reward for good behavior; (4) If I did not guide or regulate [child]’s eating, he/she would eat too many junk foods/favorite foods. Pressuring was assessed through the following 3 validated questions49: (1) [child] should always eat all the food on his/her plate; 2) if [child] says “I'm not hungry,” I try to get him/her to eat anyway; (3) if I did not guide or regulate [child]’s eating, he/she would eat much less than he/she should. For both restriction and pressuring, parents selected how much they agreed with each item (1 = “Disagree”; 3= “Neutral”; 5 = “Agree”). Instrumental feeding was assessed with the following 2 validated questions49: (1) if [child] misbehaves, I withhold his/her favorite foods/sweets/desserts; (2) use desserts as a bribe to get [child] to eat his/her main course (1= “Never”; 3 =“About half of the time”; 5 = “Always”).49,50 Outcome variables Child BMI percentile Child height and weight were obtained through the child's electronic medical record at their primary care clinic. Child heights and weights were converted to child BMI percentile, based on Centers for Disease Control and Prevention criteria.51 Control variables Food insecurity status Household food insecurity was assessed via the short form of a validated scale called the Household Food Security Scale.52 This scale was completed by the parent at the second home visit as part of the online survey. The scale is a sum of the affirmative responses to the following 6 questions about whether in the past 12 months: (1) the primary caregiver (or other adults in the household) ever cut the size of meals or skipped meals because there wasn’t enough money for food; (2) that this happened more than 1 or 2 months; (3) the primary caregiver was hungry but didn’t eat because they couldn’t afford enough food; (4) the food they bought didn’t last and they didn’t have enough money to get more; (5) they couldn’t afford balanced meals; and (6) they couldn’t afford to eat balanced meals. A household was categorized as food secure if they had no affirmative responses to these 6 questions, and households were classified as food insecure if they answered yes to 1 or more questions. Annual household income Annual household income was a 1-item measure taken from a pre-existing survey.38 Parents were asked, What was the total income of your household before taxes in the past year? Response options included: (1) Less than $20,000; (2) $20,000–$34,999; (3) $35,000–$49,999; (4) $50,000–$74,999; (5) $75,000–$99,999; (6)$100,000 or more. Note: the 1307 sample is from the Minneapolis and St. Paul, MN, area and was collected between 2015 and 2017.
- Table 3.
Standardized Latent Variable Relationships with Observed Cross-Sectional Survey Items
Latent variable Univariate mean ± SD Β* 95% CI P value Parent low mental health Depression scale 1.8 ± 0.86 0.86 (0.82, 0.89) <.001 Anxiety scale 2.1 ± 1.00 0.87 (0.83, 0.90) <.001 Resilience scale 3.6 ± 0.71 −0.46 (−0.50, −0.41) <.001 Positive parenting Authoritative scale 4.2 ± 0.81 0.07 (0.01, 0.14) .049 Authoritarian scale 1.9 ± 0.65 −0.66 (−0.72, −0.60) <.001 Permissive scale 1.8 ± 0.76 −0.65 (−0.71, −0.58) <.001 Self-efficacy scale 3.9 ± 0.46 0.40 (0.33, 0.46) <.001 Controlling feeding practices Pressuring 3.0 ± 1.05 0.51 (0.44, 0.58) <.001 Restriction 3.3 ± 1.00 0.56 (0.49, 0.63) <.001 Instrumental 2.0 ± 0.99 0.55 (0.48, 0.61) <.001 Support for physical activity (PA) Modeling of PA 3.3 ± 0.97 0.60 (0.52, 0.67) <.001 Support for PA 3.0 ± 0.84 0.77 (0.68, 0.86) <.001 Limit sedentary activity 3.4 ± 0.80 0.34 (0.28, 0.41) <.001 Abbreviations: SD, standard deviation; CI, confidence interval.
Note: the 1307 sample is from the Minneapolis and St. Paul, MN, area and was collected between 2015 and 2017.
* Standardized coefficients.
Interpretation example: The latent variable, “Parent Low Mental Health,” was constructed from three mean-scaled items that characterize parent self-reported depressive, anxiety, and resilience items. In this sample, the latent construct was positively correlated with the depression and anxiety scales and negatively correlated with the resilience scale.
- Table 4.
Standardized Indirect Parent Adverse Childhood Events-Child Body Mass Index (BMI) Pathways Mediated by Parent Low Mental Health and Positive Parenting (n = 1307 Children)
Latent variable β1* β2* β3* Indirect pathways Parent mental health pathway Adverse childhood events (ACEs) → parent low mental health → parent BMI > 25 → child BMI percentile 0.376†† 0.145†† 0.092†† Positive parenting pathways ACEs → positive parenting → support for physical activity (PA) → child BMI percentile 0.219†† 0.127† 0.013 ACEs → positive parenting → controlling feeding practices → child BMI percentile −0.400†† −0.042 Note: the 1307 sample is from the Minneapolis and St. Paul, MN, area and was collected between 2015 and 2017.
* Standardized coefficients.
Models include adjustments for food insecurity status and income of the parent ACEs-BMI percentile relationship; child overweight status of the controlling feeding-BMI percentile, and support for PA-BMI percentile relationships. Boldfaced coefficients are significant at the following levels: †P < .01; ††P < .001.
Interpretation example: parent ACEs-child BMI percentile indirect relationships were modeled with controls for household food insecurity status and income. At the dyad level, child overweight was controlled for the support for PA and controlling feeding relationship with child BMI percentile. Three indirect pathways operating through parent mental health and positive parenting were modeled. Component path coefficients were standardized for interpretability (β1, β2, and β3). There was strong statistical evidence at P < .001 for all low mental health path coefficients, indicating parent ACEs were positively associated with lower parent mental health (β1 = 0.376), low parent mental health was correlated with parent BMI > 25 (β2 = 0.145), and parent BMI >25 was associated with elevated child BMI percentile (β3 = 0.092).


