
Article Figures & Data
Figures
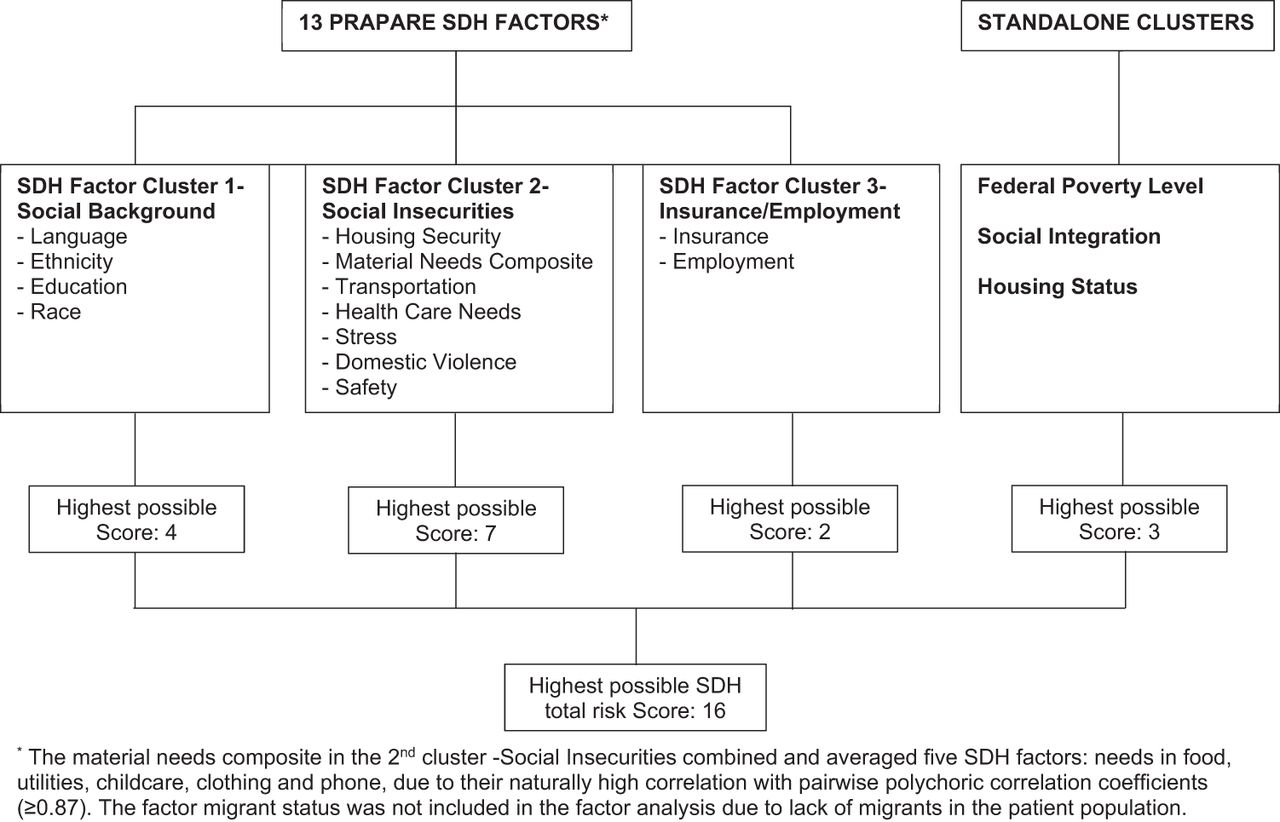
- Figure 1.
Structure of PRAPARE SDH factors by factor analysis. Abbreviation: PRAPARE, Protocol for Responding to and Assessing Patient Assets, Risks, and Experiences.
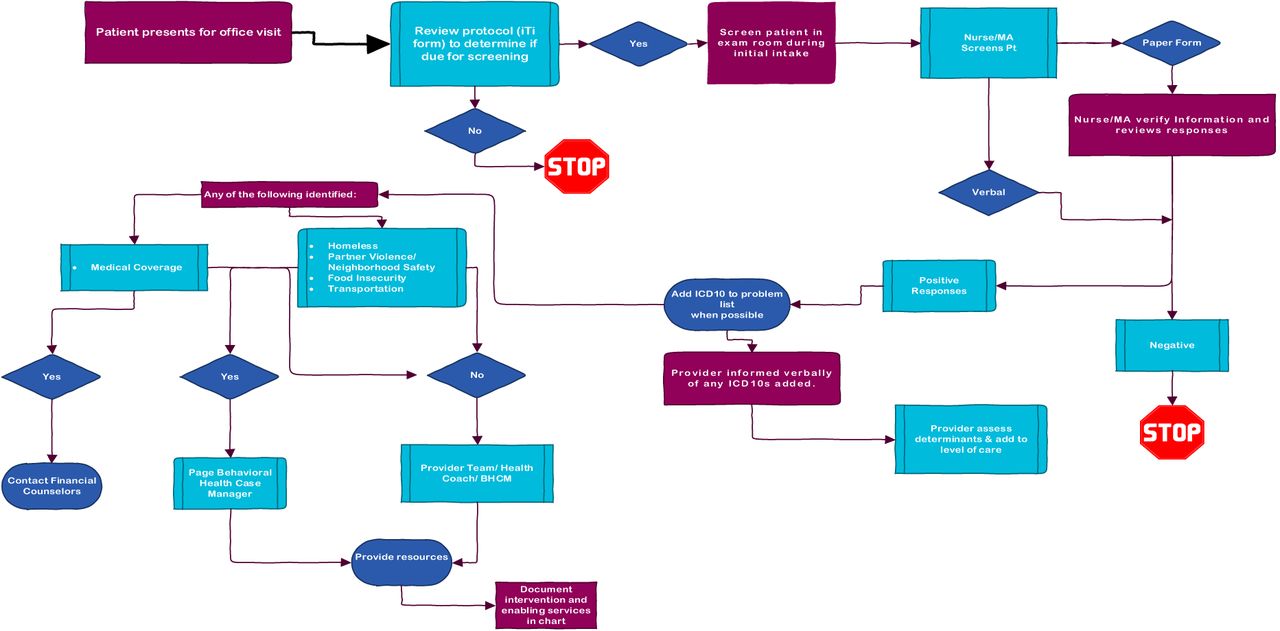
- Appendix Figure 1.
Workflow at Siouxland Community Health Center.
Tables
- Table 1.
Patient Characteristics and Social Determinant of Health Risk Factors across Disease Status
Both Diabetes Only Hypertension Only Neither (n = 1477) (n = 716) (n = 2388) (n = 7192) N % N % N % N % Gender** Female 762 52% 405 57% 1196 50% 4765 66% Male 715 48% 311 43% 1192 50% 2426 34% Age (mean and SD)** 56 10 48 12 53 11 38 13 Ethnicity** Hispanic/Latino 411 28% 304 42% 576 24% 2787 39% Non-Hispanic/Latino 1055 72% 404 57% 1786 76% 4313 61% Race** Non-White 392 26% 251 35% 643 27% 2575 36% White 1083 73% 462 65% 1726 72% 4544 63% Language** Limited English proficiency 409 28% 279 39% 565 24% 2247 31% English proficient 1068 72% 437 61% 1823 76% 4945 69% Education** Less than high school 605 42% 331 48% 868 37% 2632 37% High school 385 27% 183 26% 730 31% 2187 31% Above high school 453 31% 178 25% 726 30% 2202 31% Housing stability Worried about losing housing 89 7% <50 - 143 7% 400 7% Not worried about losing housing 1194 93% 579 93% 1855 93% 5350 93% Food needs** Yes need 173 13% 98 16% 241 12% 696 12% No need 1138 87% 523 84% 1851 88% 5344 88% Utilities needs Yes need 115 9% 66 11% 156 8% 515 9% No need 1182 91% 540 89% 1914 92% 5443 91% Childcare needs** Yes need <50 - <50 - <50 - 218 4% No need 1243 99% 569 97% 1973 98% 5605 96% Clothing needs Yes need 87 7% <50 - 160 8% 482 8% No need 1204 93% 556 92% 1921 92% 5482 92% Phone needs Yes need 97 8% 51 9% 153 7% 507 9% No need 1190 92% 548 91% 1918 93% 5429 91% Other needs Yes need <50 - <50 - <50 - <50 - No need 1031 99% 467 99% 1611 99% 4341 99% Transportation** Transportation needs (medical) 105 8% <50 7% 131 5% 413 6% Transportation needs (nonmedical) 97 7% <50 7% 118 5% 372 6% No transportation needs 1159 85% 556 86% 1932 89% 5682 88% Health care Medicine or health care needs 196 17% 116 21% 327 17% 952 18% No health care need 963 83% 447 79% 1544 83% 4344 82% Stress* Very much 143 11% 59 9% 240 11% 840 12% Quite a bit 104 8% 62 9% 219 10% 537 8% Somewhat 262 19% 116 17% 426 19% 1312 19% A little bit 403 30% 196 29% 656 29% 1979 29% Not at all 447 33% 234 35% 687 31% 2130 31% Domestic violence Yes <50 - <50 - 73 3% 304 5% Unsure <50 - <50 - <50 - <50 - No 1343 96% 646 95% 2176 96% 6426 95% Safety Felt unsafe 60 4% <50 5% 106 5% 388 6% Unsure <50 - <50 - <50 - 106 2% Felt safe 1327 94% 646 94% 2122 94% 6327 93% Employment** Unemployed 808 55% 327 46% 1068 45% 2868 40% Employed or not looking for employment 653 45% 377 54% 1292 55% 4230 60% Insurance** Uninsured 1048 72% 480 69% 1571 67% 3697 53% Insured 404 28% 219 31% 758 33% 3222 47% Federal poverty level (FPL)** Income <100% FPL 945 67% 492 73% 1601 71% 5161 77% Income between 100% and 200% FPL 360 25% 142 21% 498 22% 1141 17% Income between 200% and 400% FPL 101 7% <50 - 143 6% 322 5% Income > 400% FPL <50 - <50 - <50 - <50 - Social integration* See or talk to people < once per week 148 11% 59 9% 199 9% 679 10% See or talk to people 1 to 2 times per week 222 16% 128 19% 384 17% 1197 18% See or talk to people 3 to 5 times per week 296 22% 148 22% 434 20% 1487 22% See or talk to people > 5 times per week 705 51% 328 50% 1203 54% 3326 50% Housing status** Lack of housing 95 7% 64 9% 201 9% 894 13% Have housing 1328 93% 631 91% 2087 91% 5949 87% Groups with counts of less than 50 were masked for confidentiality reasons.
↵* P value < 0.05, where P value was for all four groups comparison. A small P value (<0.05) indicates at least two groups significantly different in one characteristics or SDoH.
↵** P value ≤ 0.01, where P value was for all four groups comparison. A small P value (<0.05) indicates at least two groups significantly different in one characteristics or SDoH.
Abbreviation: SD, standard deviation.
SDOH Clusters Both (n = 1477) Diabetes Only (n = 716) Hypertension Only (n = 2388) Neither (n = 7192) Social background (ethnicity, race, language, and education) Mean cluster score* (SD) 0.34 (0.32) 0.45 (0.33) 0.32 (0.31) 0.40 (0.32) Social insecurities (housing security, material needs, transportation, health care, stress, domestic violence, and safety) Mean cluster score (SD) 0.12 (0.15) 0.13 (0.15) 0.12 (0.15) 0.13 (0.16) Insurance/employment (insurance and employment) Mean cluster score (SD) 0.64 (0.41) 0.58 (0.41) 0.56 (0.42) 0.47 (0.41) Federal poverty level (FPL) Cluster score (SD) 0.86 (0.22) 0.89 (0.20) 0.87 (0.21) 0.90 (0.19) Social integration Cluster score (SD) 0.29 (0.35) 0.29 (0.34) 0.27 (0.34) 0.29 (0.34) Housing status Cluster score (SD) 0.07 (0.25) 0.09 (0.29) 0.09 (0.28) 0.13 (0.34) ↵* Cluster score is defined as the sum of the at-risk factors in that cluster.
Abbreviations: SDoH, social determinants of health; SD, standard deviation.
- Table 3.
Associations of Social Determinant of Health Risk Factors and Clusters with HbA1c and Blood Pressure Values by Linear Regression Models
Outcome Factors/Clusters* Coefficient 95% CI P value† Diabetes model (total n = 2193 and n = 1906 with complete data) HbA1c Intercept 8.755 8.076 9.434 <0.001 BMI −0.007 −0.017 0.003 0.184 Age −0.024 −0.031 −0.017 <0.001 Female (ref: male) −0.166 −0.330 −0.002 0.047 Social background score 0.114 0.049 0.178 0.001 Social insecurities score 0.166 0.084 0.247 <0.001 Insurance/employment score 0.124 0.019 0.229 0.020 Federal poverty level score −0.034 −0.416 0.349 0.864 Social isolation score −0.314 −0.553 −0.075 0.010 Housing status score −0.113 −0.425 0.199 0.479 Blood pressure model (total n = 3865 and n = 3338 with complete data) Systolic blood pressure Intercept 118.445 113.955 122.935 <0.001 BMI 0.175 0.112 0.237 <0.001 Age 0.049 −0.002 0.099 0.058 Female −1.844 −2.899 −0.789 0.001 Social background score 0.498 0.073 0.924 0.022 Social insecurities score 1.026 0.486 1.567 <0.001 Insurance/employment score −0.138 −0.808 0.532 0.687 Federal poverty level −0.097 −2.565 2.371 0.939 Social isolation 0.284 −1.277 1.846 0.721 Housing status 0.001 −1.997 1.998 0.999 Diastolic blood pressure Intercept 87.071 84.170 89.972 <0.001 BMI 0.036 −0.004 0.077 0.080 Age −0.222 −0.254 −0.189 <0.001 Female (ref: male) −1.566 −2.247 −0.884 <0.001 Social background score −0.030 −0.305 0.245 0.832 Social insecurities score 0.736 0.387 1.085 <0.001 Insurance/employment score −0.460 −0.893 −0.027 0.038 Federal poverty level 0.023 −1.572 1.617 0.978 Social isolation −0.635 −1.644 0.374 0.217 Housing status −0.119 −1.409 1.172 0.857 - Table 4.
Associations of Social Determinant of Health Risk Factors and Clusters with Control of HbA1c and Blood Pressure by Logistic Regression Models
Outcome* Factors/Clusters† Odds Ratio Lower Upper P value‡ Uncontrolled diabetes (total N = 2,193 and N = 1,906 with complete data) Age 0.97 0.96 0.98 <0.001 Gender 0.88 0.69 1.14 0.336 BMI 0.99 0.97 1.00 0.141 Social Background Score 1.12 1.02 1.23 0.023 Social Insecurities Score 1.18 1.05 1.32 0.004 Insurance/Employment Score 1.24 1.06 1.47 0.009 Federal Poverty Level 0.69 0.39 1.23 0.204 Housing Status 0.77 0.48 1.23 0.274 Social Isolation 0.85 0.59 1.22 0.381 Uncontrolled hypertension (total N = 3,865 and N = 3,338 with complete data) Age 1.00 0.99 1.01 0.425 Gender 0.90 0.75 1.08 0.256 BMI 1.00 0.99 1.01 0.788 Social Background Score 1.00 0.93 1.08 0.984 Social Insecurities Score 1.16 1.06 1.26 0.001 Insurance/Employment Score 1.09 0.97 1.23 0.147 Federal Poverty Level 1.31 0.83 2.06 0.244 Housing Status 1.19 0.86 1.64 0.297 Social Isolation 1.13 0.87 1.48 0.364 Uncontrolled combined diabetes/hypertension (total N = 4579 and N = 3,954 with complete data) Age 0.99 0.99 1.00 0.050 Gender 0.87 0.74 1.01 0.071 BMI 1.01 1.00 1.01 0.223 Social Background Score 1.06 1.00 1.13 0.057 Social Insecurities Score 1.17 1.09 1.26 <0.001 Insurance/Employment Score 1.17 1.06 1.29 0.002 Federal Poverty Level 1.02 0.70 1.48 0.936 Housing Status 1.04 0.79 1.38 0.773 Social Isolation 1.072 0.854 1.346 0.549 ↵* Uncontrolled diabetes was defined as HbA1c ≥ 9% and uncontrolled hypertension was defined as SBP ≥ 140 mm Hg and/or DBP ≥ 90 mm Hg.
↵† The actual effect of each composite cluster is the estimated natural log of odds ratio multiplied with the actual number of positive SDoH factors in that composite cluster.
↵‡ The P values < 0.05 are bolded.
Abbreviations: BMI, body mass index; SDoH, social determinants of health.


