
Abstract
Introduction: PRAPARE is a leading social risk screening tool. No studies yet have simplified the 22 PRAPARE social determinants of health (SDoH) into clusters to analyze associations with chronic disease outcomes.
Methods: A federally qualified health center conducted cross-sectional PRAPARE screening on its general adult population. Exploratory and confirmatory factor analyses were used to identify SDoH clusters and construct cluster scores and SDoH total risk scores. Logistic regression assessed relationships between cluster scores and uncontrolled diabetes and/or hypertension.
Results: Of the 11,773 adults who answered the survey, 716 had diabetes only, 2,388 had hypertension only, 1,477 had both, and 7,192 had neither. We found 3 composite SDoH clusters (social background, social insecurities, insurance/employment) and 3 standalone clusters (housing status, social isolation, poverty). Among patients with diabetes, those at risk in social background, social insecurities, and insurance/employment were more likely to have uncontrolled diabetes. Among patients with hypertension, those at more risk in social insecurities were more likely to have uncontrolled hypertension.
Conclusions: We simplified the 22 PRAPARE SDoH into 3 composite clusters and 3 individual clusters and demonstrated the reliability and validity of PRAPARE. The 3 composite clusters were positively associated with uncontrolled diabetes and/or hypertension.
- Community Health Centers
- Cross-Sectional Studies
- Diabetes Mellitus
- HbA1c
- Hypertension
- Logistic Models
- Risk Factors
- Social Determinants of Health
- Vulnerable Populations
Introduction
Much clinical research has focused on the ability of traditional medical care to improve clinical outcomes and how demographic and clinical factors—such as age, sex, and presence and severity of disease—can predict adverse outcomes. However, social determinants of health (SDoH) are major contributors to inequities in health outcomes.1,2 The SDoH include social and economic factors, such as low income, unemployment, and lack of quality housing. While much research demonstrates the impact that individual SDoH factors have on health outcomes, little is known regarding how multiple SDOH factors affect outcomes.
In September 2013, a national patient SDoH risk assessment protocol, the Protocol for Responding to and Assessing Patient Assets, Risks, and Experiences (PRAPARE), was created, standardized, implemented, and promoted by the National Association of Community Health Centers, the Association of Asian Pacific Community Health Organizations (AAPCHO), the Oregon Primary Care Association, and the Institute for Alternative Futures.3 PRAPARE contains 22 SDoH factors that align with national initiatives, including the standardized codification sets under International Statistical Classification of Diseases and Related Health Problems (ICD)-104 and Logical Observation Identifiers Names and Codes5 as well as health centers' Uniform Data System (UDS).6 PRAPARE is available for free in the most dominant electronic health record platforms and is translated into 26 languages.7 It is the leading social risk screening tool used by Medicaid-managed care organizations8,9 and most commonly used in federally qualified health centers (FQHCs) and other health systems.6
Patients with a great number of socioeconomic disadvantages are often served by FQHCs, rather than other health providers. They are disproportionately low income, racial/ethnic minority, limited English proficient, and uninsured or publicly insured compared with the population nationally.10,11 The adverse effects of SDoH contribute to the higher prevalence of chronic conditions, such as diabetes and hypertension, in an FQHC population versus the general US population.12,13
Despite the widespread use of PRAPARE, evidence is limited regarding which SDoH measures matter most and which groupings of SDoH measures have the greatest impact on specific chronic disease outcomes. SDoH clusters could stratify patients into different risk groups, target interventions to particularly high-risk groups, and inform allocation of staff and other resources for goals such as reduction of costly emergency department utilization.14⇓⇓–17 Our study uses the comprehensive SDoH assessment tool, PRAPARE, to identify clusters of 22 SDoH factors and discover associations between the clusters and health outcomes in an FQHC population that included patients with diabetes and hypertension.
Methods
Development of PRAPARE
The PRAPARE measure was developed through a 3-stage process. In the first stage, literature, environmental scans, and interviews of tool developers were conducted, and initial items were generated by a group of experts.18 In the second stage, a pilot study of the measure was performed for validity and reliability using nearly 3000 patients in FQHCs.9,18 The PRAPARE measure was subsequently readjusted. This study is for the third stage of the development of PRAPARE, identifying social risk clusters and correlating those to clinical outcomes.
Study Setting
Siouxland Community Health Center (SCHC, Sioux City, Iowa) began implementing PRAPARE in 2015 as one of the pioneer FQHCs that collaborated in the early development of the tool.
PRAPARE Assessment Survey
SCHC routinely screens the general patient population annually for SDoH using PRAPARE. During screening, the nurse or medical assistant (MA) typically provides an article copy of the PRAPARE questions to the patient or may ask the patient each question. The nurse or MA will then review the responses; if SDoH barriers are identified, the nurse or MA arranges for resources for the patients with the assistance of other care team members. If a patient screens positive for homelessness, partner violence, neighborhood safety, food insecurity, or transportation issues, a behavioral health case manager is called in to provide immediate assistance. The workflow for the PRAPARE assessment at SCHC can be found in Online Appendix Figure 1.
Among the PRAPARE 22 SDoH (Online Appendix Table 1), we excluded migrant/farmworker status and the optional open-ended “other” category under the material security question, which had high rates of missing data (> 95%). There were very few migrant/farmworkers in the region that SCHC serves, which is why the response rate for this question was low. For the purpose of constructing subsequent factor scores, the PRAPARE variables were binary coded or ordinal coded depending on the type of response categories (listed in Online Appendix Table 2).
Patient Characteristics and Social Determinant of Health Risk Factors across Disease Status
Mean Scores Across the Three Clusters and the Three Standalone Domains
Study Population
This cross-sectional study included 11,773 adults, aged 18 to 75 years, who visited SCHC between January 1, 2016 to June 30, 2018 and responded to the PRAPARE survey. Patients with diabetes and/or hypertension were defined based on ICD-10 diabetes and/or hypertension diagnosis codes. The blood pressure and HbA1c data were based on the patients' most recent measures relative to their PRAPARE assessment dates. Among the 11,773 patients, 716 had diabetes only, 2,388 had hypertension only, 1,477 had both, and 7,192 had neither disease.
Statistical Analyses
Before any analysis, we standardized the variables to ensure all variables ranged from 0 to 1. That is, for those ordinal-coded variables, we converted them into [0, 1] by dividing each by the maximum of that variable. Descriptive statistics were used to summarize the frequencies and percentages for categorical variables and the means and SD for continuous variables. The pairwise tetrachoric/polychoric correlation coefficients of all SDoH risk factors were calculated as inputs for further reliability and factor analyses to avoid missing data issues.19 We then calculated both Cronbach's α and the greatest lower bound20,21 for the internal consistency reliability. We used an exploratory factor analysis with Varimax rotation to cluster the SDoH risk factors. The SDoH items with correlations ≤ 0.35 were omitted from the exploratory factor analysis22⇓–24 and considered as standalone clusters. For the items with correlations > 0.85, we averaged them as a composite item for the exploratory factor analysis.25 The number of constructs was determined as the number of eigenvalues greater than 1. We used a confirmatory factor analysis to evaluate and verify the constructs found in the exploratory factor analysis. More specifically, we used root mean squared error of approximation, standardized root mean residual, and goodness of fit index as criteria for evaluation.26
Clusters and Cluster Scores
Following the factor analyses, we applied the approximate method, commonly referred to as “sum scores,” for a simplification of both factor analysis and factor score estimation procedure.27,28 More specifically, we compared a loading of a factor to an average loading of all of the constructs. For a loading that was more extreme than the average loading, its factor was considered “salient” and assigned a value of +1. Otherwise, its factor was assigned a value of zero. Those “salient” SDoH risk factors constructed a cluster, that is, a simplified factor analysis. Then we summed those salient factors in that cluster with equal weights. To amend for the missing data, we averaged those available factors first and then multiplied it by the total number of factors in that cluster.29,30 Similarly, we calculated an SDoH total risk score by summing all clusters with equal weights.
Associations with Clinical Outcomes
For patients with diabetes and/or hypertension, we assessed the associations of the PRAPARE cluster scores or total risk score with clinical outcomes. We used linear regression models for continuous outcomes (HbA1c, systolic blood pressure [SBP], and diastolic blood pressure [DBP]) and logistic regression models for binary outcomes (diabetes control and hypertension control). Consistent to UDS for dichotomizing outcomes, uncontrolled diabetes was defined as HbA1c ≥ 9% and uncontrolled hypertension was defined as SBP ≥ 140 mmHg and/or DBP ≥ 90 mmHg. We adjusted for age, gender, and body mass index (BMI). Other demographics such as race/ethnicity, language, and education were not adjusted for because they were part of the SDoH factors.
Missing Data Analysis
We conducted missing data analyses by checking for any missing data pattern, imputing data, and then repeating the same regression methods for association evaluation. We used the multiple imputation method, via the Markov chain Monte Carlo algorithm to impute the data. We included all covariates and outcomes for the multiple imputations and generated 20 imputed data sets. We did not use the imputed data for the factor analyses, because there were no missing data in pairwise correlation coefficients of all SDoH, which were used as the inputs of the factor analyses. In addition, the missing rate of all paired SDoH was less than 17% on average, indicating that the pairwise correlation coefficients were well estimated with the total sample size > 10,000. The results from the complete data set were the primary analysis, and the results based on the simulated data were a sensitivity analysis.
Results
Participants' Characteristics Including SDOH
Table 1 shows descriptive statistics on patient characteristics per group. Among the 4 disease-status groups, the diabetes-only group had the highest rate of patients of Latino or Hispanic ethnicity (43% vs others: 24% to 39%). This group also had the highest rates of the following SDoH, compared with each of the other 3 groups: limited English proficiency (39% vs 24% to 31%), education level lower than high school (72% vs 67%), and having food insecurity (14% vs 10% to 12%). The both-disease group had the highest rate of transportation needs (14% vs 10% to 12%), unemployment (55% vs 40% to 46%), uninsured status (71% vs 51% to 67%), and social isolation (11% vs 9% to 10%). The neither-disease group consisted of the most female participants (66% vs 50% to 57%) and were the youngest (mean age: 38 years vs others: 48 to 56 years, younger than 25 years old: 16.5% vs 0.2% to 3.6%). The neither-disease group also had the most lack of housing (13% vs 7% to 9%) and the most having income <100% federal poverty level (FPL) (77% vs 67% to 73%). The 4 groups had no clear difference in the following 4 SDoH factors: housing insecurity, medicine/health care needs, domestic violence, and feeling unsafe.
Internal Consistency Reliability
The Cronbach's α was 0.86, and the greatest lower bound was 0.935, indicating good to excellent internal consistency reliability for PRAPARE.
Factor Analyses
Of the 22 SDoH risk factors, we excluded 3 factors from exploratory factor analysis due to very lower prevalence (<4%): migrant status, childcare needs, and other material insecurity. We considered 3 factors as standalone clusters because their correlations with the others were low (≤ 0.35): FPL, social isolation, and housing status (Figure 1). We averaged 4 factors as a composite factor “material needs” because they had high correlations (> 0.85) with each other: needs in food, utilities, clothing, and phone. Eventually, 13 SDoH factors including 1 composite factor entered the exploratory factor analysis (Figure 1).
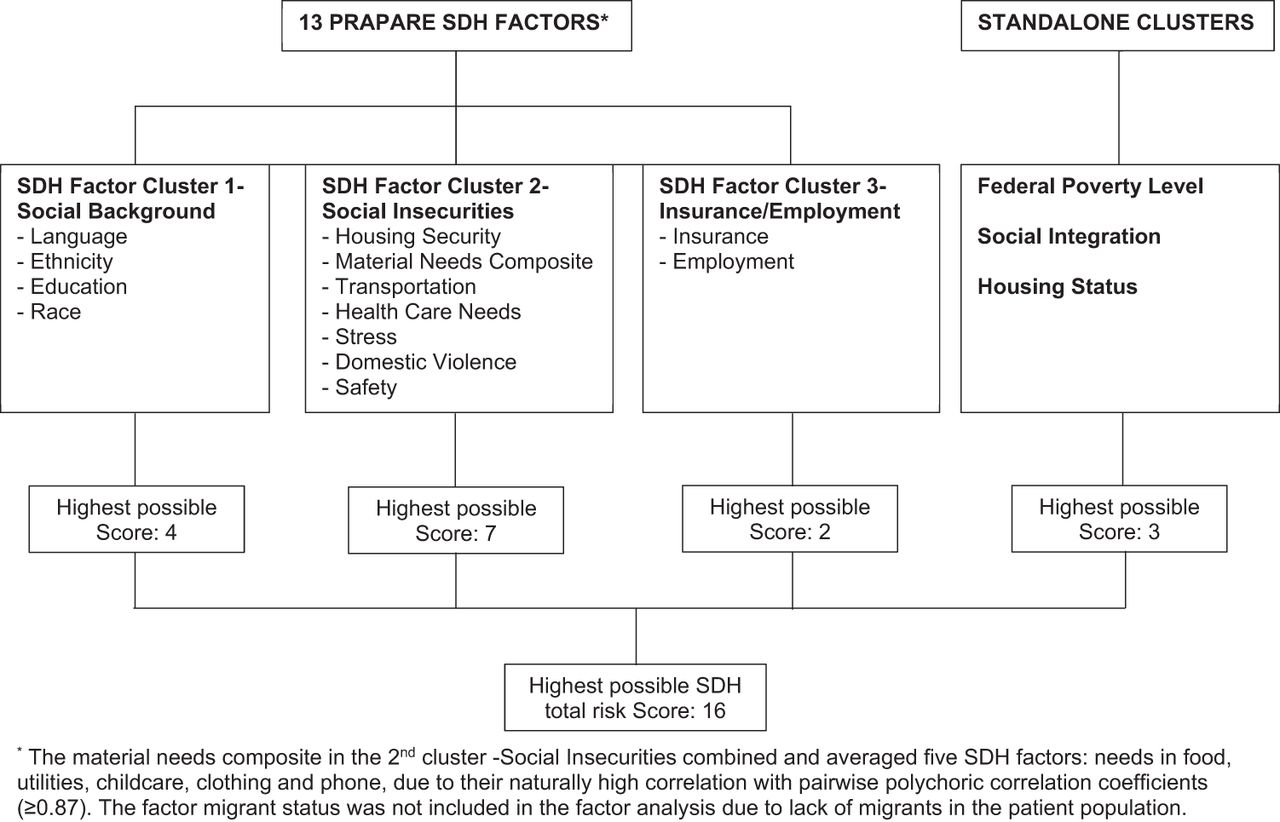
Structure of PRAPARE SDH factors by factor analysis. Abbreviation: PRAPARE, Protocol for Responding to and Assessing Patient Assets, Risks, and Experiences.
The exploratory factor analysis yielded 3 clusters with eigenvalues > 1, which accounted for 48.2% of the total variance. Its root mean squared error of approximation was 0.068, indicating that the exploratory factor analysis model fit is acceptable.31 The original loadings of the 13 SDoH are in Online Appendix Table 3. The first cluster, “social background,” consisted of 4 SDoH factors: language, ethnicity, education, and race. The second cluster, “social insecurities,” consisted of 7 factors: housing security, material needs, transportation, health care, stress, domestic violence, and safety. The third cluster, “insurance/employment,” consisted of 2 factors: insurance and employment. The confirmatory factor analysis confirmed the findings from the exploratory factor analysis using the following model fit criteria: root mean squared error of approximation: 0.093 (90% CI, 0.091, 0.096), standardized root mean residual: 0.074, and goodness of fit index: 0.923, all which were in an acceptable fit range.
Associations of Social Determinant of Health Risk Factors and Clusters with HbA1c and Blood Pressure Values by Linear Regression Models
We summarized all of these clusters per group in Table 2. The diabetes-only group had the highest social background risk score compared with each of the other 3 groups (0.45 vs 0.32–0.40). The both-disease group had the highest insurance/employment risk score (0.64 vs 0.47–0.58).
Associations between Clinical Outcomes and Cluster Scores
Table 3 shows the associations between outcomes and cluster scores by linear regression models. Among patients with diabetes, higher HbA1c was correlated with being younger (−0.024, P < .001), male (−0.166, P = .047), and socially isolated (−0.314, P = .01), and 3 SDoH clusters: higher risk in social background (0.114, P = .001), social insecurities (0.166, P < .001), and insurance/employment (0.124, P = .02). HbA1c was increased by 0.11% to 0.16% per composite cluster risk score increased by 1. Among those with hypertension, higher SBP and/or DBP was correlated with male gender (P ≤ .001 for both SBP and DBP), higher BMI (both P ≤ .08), higher risk in social background (P = .02 in SBP; not correlated with DBP), and higher risk in social insecurities (both P < .001). Those with higher risk in poor insurance/employment were associated with lower DBP (P = .038).
The results for the binary outcomes, uncontrolled diabetes and/or hypertension, by the logistic regression models (Table 4) were generally consistent with those of the continuous outcomes (Table 3). Uncontrolled diabetes was associated with higher risk in social background (adjusted odds ratio [OR] = 1.12, P = .023), social insecurities (OR = 1.18, P = .004), and insurance/employment (OR = 1.24, P = .009). Uncontrolled hypertension was associated with higher risk in social insecurities (OR = 1.16, P = .001). Among those who had diabetes and/or hypertension, the odds of uncontrolled disease were increased by 6% to 17% as the 3 risk scores increased by 1. There were 8% to 11% more odds of uncontrolled diabetes, uncontrolled hypertension, and uncontrolled diabetes or hypertension as the total risk scores increased by 1.
Associations of Social Determinant of Health Risk Factors and Clusters with Control of HbA1c and Blood Pressure by Logistic Regression Models
Missing Data Analysis
No missing data patterns were found, such as univariate, monotone, or file matching patterns.32 The results using the imputed data were consistent with the results from the complete case analysis (Online Appendix Tables 4 and 5).
Discussion
Our exploratory factor analysis of patient-level data from 1 FQHC (total n > 10,000) identified 3 composite clusters among the 22 PRAPARE SDoH factors (social background, social insecurities, insurance/employment) and 3 standalone clusters (federal poverty level, social integration, housing status). The confirmatory factor analysis supported the validity of this structure. Cronbach's α and the greatest lower bound both showed the internal consistency reliability of the PRAPARE assessment tool. To our knowledge, our study is the first to simplify the 22 PRAPARE SDoH factors into clusters for further analysis.
The PRAPARE cluster scores were associated with diabetes and hypertension outcomes. The likelihood of uncontrolled disease was higher as the cluster scores (ie, social risks) increased, especially the “social insecurities” cluster, which included housing security, material needs, transportation, health care, stress, domestic violence, and safety. The total SDoH risk score was also associated with uncontrolled diabetes and hypertension. These findings highlight the importance of social risk screening for improving population health management and individual patient care. Our simplified SDoH clusters could also be used to inform risk adjustment for more appropriate payment for organizations serving higher-risk patient populations.33,34
Our study builds on prior literature linking SDOH to adverse chronic disease outcomes. A study using the National Health and Nutrition Examination Survey found that race (black vs white) and insurance status (uninsured vs insured) were strongly associated with uncontrolled hypertension among US adults with hypertension.35 A different study showed that for adults less than 75 years old, those with multiple SDoH risks were at more than a 2.5-fold greater risk for stroke than those with none.36 Another study found that Mandarin speakers experienced a steeper increase in their HbA1c levels than English speakers.37 Not only the type of SDoH risk factors but the number of total SDoH risks was also a factor in the overall patient health. The same stroke study showed that individuals younger than 75 years old who had 3 or more SDoH risks were at an approximately 50% greater risk for stroke compared with those with none, even after adjustment for confounding physiologic factors.38 A study from a national sample of 17 FQHCs using PRAPARE data showed that the patient population with pre-existing diabetes and/or hypertension had an average of 10 SDoH risk factors, whereas the general patient population had an average of 5.7 risk factors.39 Taken together, these studies demonstrate the importance of comprehensive SDoH tools and understanding multiple, simultaneous risks faced by patients to assist providers in supporting and addressing root causes of health.
Addressing these SDoH barriers and tracking their improvement should be an important component of care management. In a systematic review of interventions that address SDoH barriers, Taylor et al. found 32 (82%) studies reported positive effects on clinical outcomes (n = 20), health care costs (n = 5), or both (n = 7).40 Of these 32 studies, 100% evaluated income-support programs, 88% care coordination and community-outreach interventions, 83% housing-support programs, and 64% nutritional-support programs.40 Gottlieb et al. performed a systematic review of interventions that addressed patients' social and economic needs.38 The 20 articles that studied health outcomes showed mixed although largely positive results. A 2020 American Diabetes Association systematic review catalogued promising SDoH interventions.1 For example, in the Moving to Opportunity randomized controlled trial, the opportunity to move from a neighborhood with high poverty to one with low poverty was associated with a lower prevalence of HbA1c ≥ 6.5%.41 A 2021 review of race, ethnicity, and hypertension emphasized the importance of addressing SDoH and summarized successful interventions including team-based care and community-based interventions and outreach.42 Overall these initial studies support the importance of testing more interventions, models, and guidelines that address SDoH barriers with the aims of achieving better long-term outcomes at lower costs.
AAPCHO and partners have developed a national standardized data collection protocol for “enabling services”—supportive interventions including interpretation, financial counseling, case management, and transportation—that facilitate patient access to care.43⇓–45 They have created an integrated PRAPARE SDoH and enabling services/social interventions data collection protocol to enable clinics to collect these critical data with their social-service sector partners in our future work.
Limitations
Our study has some limitations. First, our study was conducted at one FQHC, and thus the findings may not be generalizable to other FQHCs or other health systems. The cluster structure might be different due to different loadings of SDoH factors if the national patient population is very different from this clinic's population. However, we used the approximate method, which is robust to the cluster structure.27,28 In addition, we compared the poverty level of our study population with a summary of all 1375 FQHCs from the 2020 UDS data. As reported by the Health Resources & Services Administration, 68% of patients had income <100% FPL and 91% of patients had income <200% FPL.46 Both poverty levels were similar to those in our study population: 74% and 94% had income <100% FPL and <200% FPL, respectively, in our study. Furthermore, we plan to validate the SDoH cluster structures with patient-level data from health centers in multiple states in future studies.
Second, the PRAPARE survey had missing data and less than 50% of patients answered all questions. However, for each question, the missing data rate was less than 10%, and between all paired items there was less than 17% missingness on average. Furthermore, to be able to calculate cluster scores for a patient, we used mean of available items to fill in missing items. Analyses of imputed data were consistent with analyses of the complete case. Third, some potential confounders such as medications, baseline chronic condition control, and time of disease diagnosis were not available, so they were not included in our regression models.
Fourth, the PRAPARE does not ask questions related to experiences of racism or trust in health care. The PRAPARE team is currently working with a national advisory committee to develop a revision to the tool that is considering these important factors. Lastly, our study excluded contextual data on enabling services or social interventions commonly provided by FQHCs to mitigate patient SDoH and thus may have underestimated the true volume of patient SDoH risk. For example, FQHCs that regularly provide transportation support to the clinic to address their patients' transportation needs may underestimate true transportation risk in the population.
Conclusion
Our study of 22 PRAPARE SDoH factors identified 3 composite clusters (social background, social insecurities, and insurance/employment) and 3 individual clusters (federal poverty level, social integration, and housing status) and demonstrated the reliability and validity of scoring tools. Future work should explore the use of the tools for improving population health outcomes.
Acknowledgments
This study was supported by the Chicago Center for Diabetes Translation Research (NIDDK P30 DK092949) and dean's office of the Biological Sciences Division of the University of Chicago.
Appendix
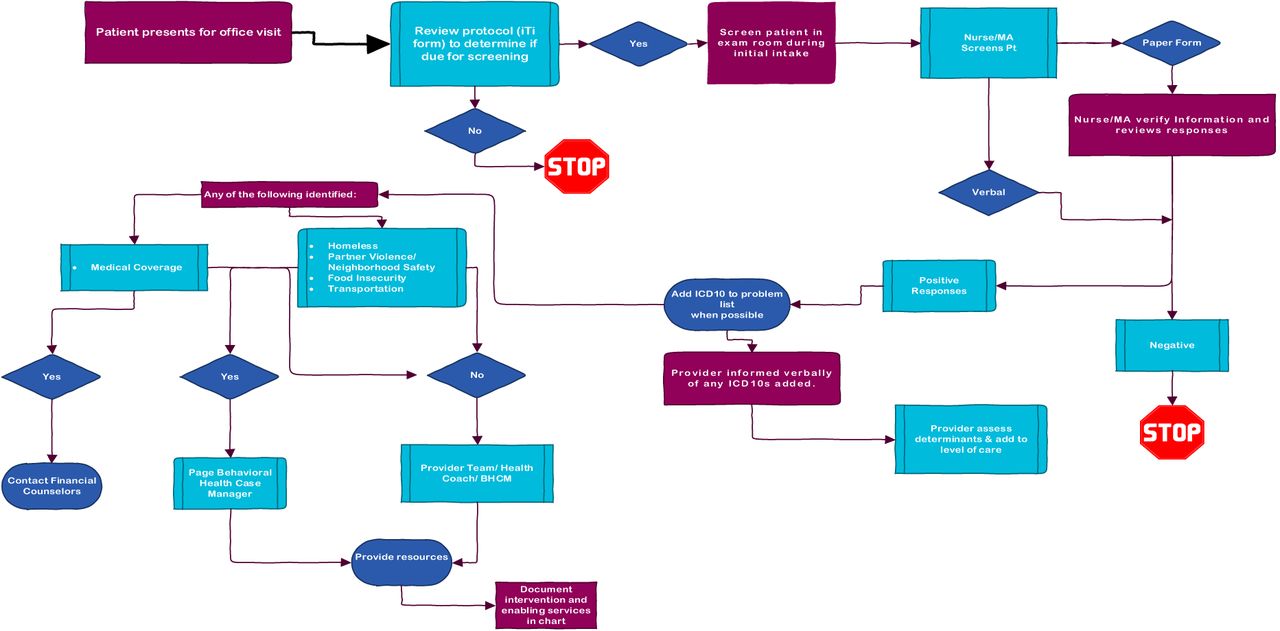
Workflow at Siouxland Community Health Center.
The PRAPARE questionnaire
Description of the coded variables of the 22 PRAPARE SDOH
Loadings of the 13 coded variables of PRAPARE SDOH by the exploratory factor analysis with Varimax rotation
Associations of Social Determinant of Health Risk Factors and Clusters with HbA1c And Blood Pressure Values by Linear Regression Models, Using the Imputed Data
Associations of Social Determinant of Health Risk Factors and Clusters with Control of HbA1c And Blood Pressure By Logistic Regression Models, Using the Imputed Data
Notes
This article was externally peer reviewed.
Funding: This work is funded by the Chicago Center for Diabetes Translation Research and the dean's office of the Biological Sciences Division of the University of Chicago. Funding number NIDDK P30 DK092949.
Conflict of interest: none.
To see this article online, please go to: http://jabfm.org/content/35/4/668.full.
- Received for publication September 2, 2020.
- Revision received January 19, 2022.
- Accepted for publication January 24, 2022.


