
Article Figures & Data
Figures
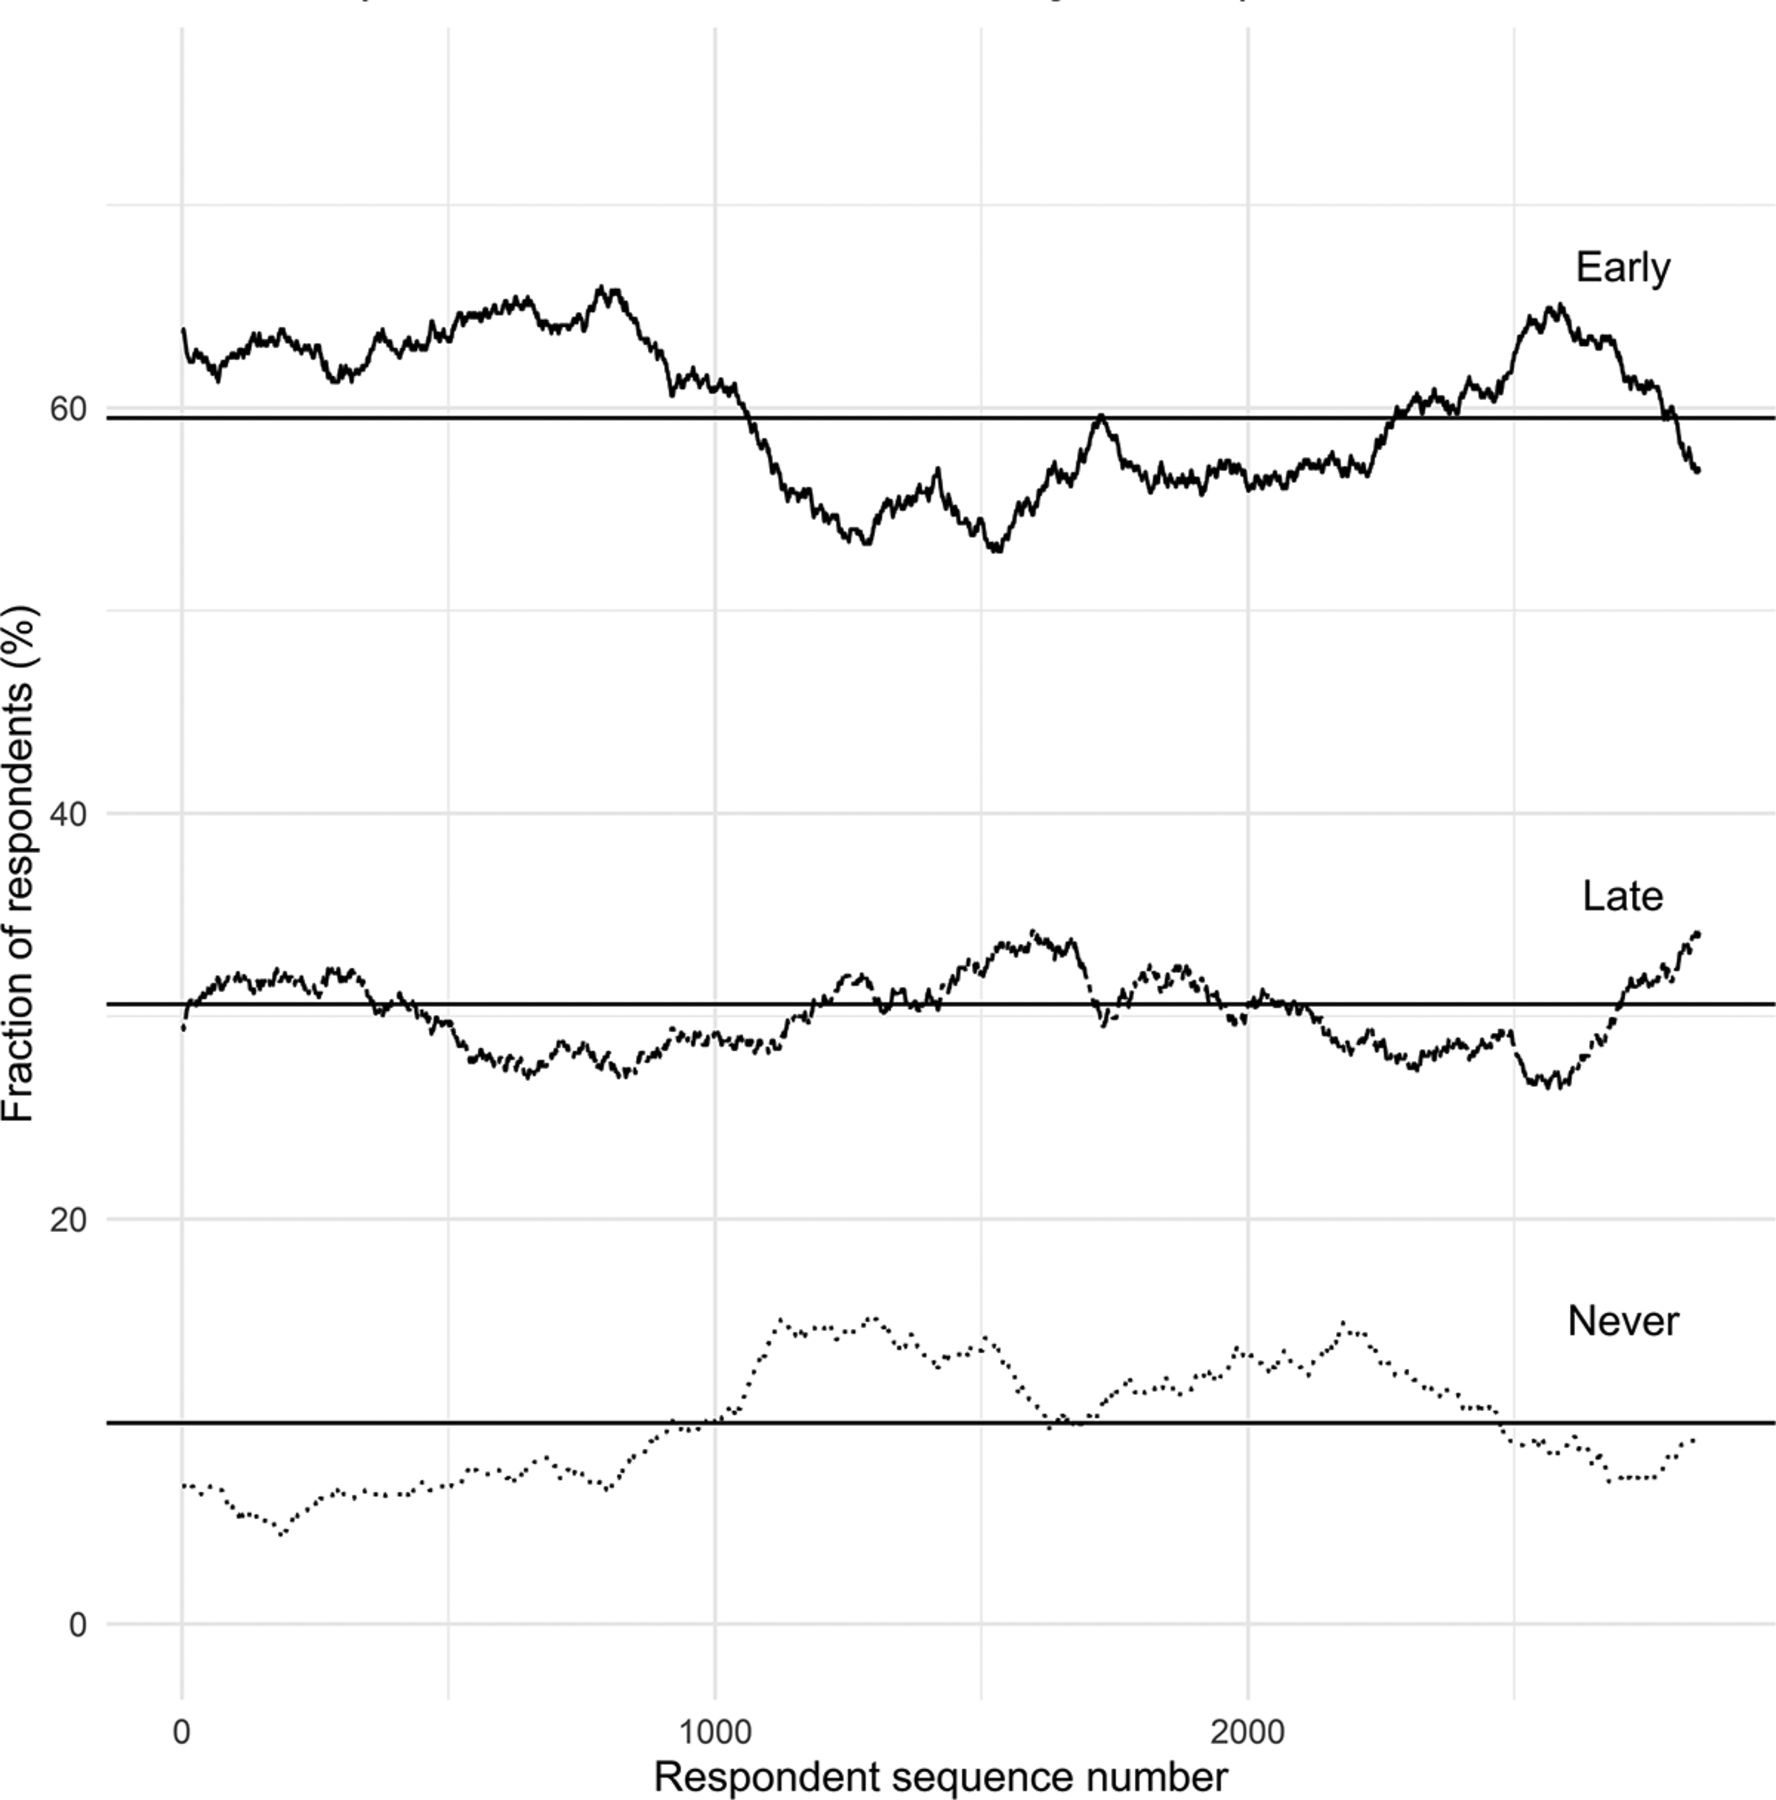
- Appendix Figure 1.
Vaccine acceptance as a function of respondent order. The proportion of respondents reporting early (<3 months), late (>3 months), and never vaccine acceptance within 500-participant rolling windows is shown. Earlier respondents seem on the left while later respondents seem on the right. Rolling averages are compared with the whole-sample averages (solid lines). Vaccine acceptance patterns remain essentially stable as a function of respondent order, which is consistent with – but does not definitively establish – the absence of strong nonresponse bias.
Tables
Characteristic N (%)* Age, years 18 to 24 437 (13.1) 25 to 34 974 (29.1) 35 to 44 709 (21.2) 45 to 54 565 (16.9) 55 to 64 520 (15.5) 65 years or greater 142 (4.2) Sex Men 726 (21.8) Women 2601 (78.0) Other 7 (0.2) No response 13 Race American Indian or Alaska Native 6 (0.2) Asian 125 (3.8) Black or African American 104 (3.1) White 2912 (87.6) Native Hawaiian or Other Pacific Islander 4 (0.1) Other 79 (2.4) Multiple 95 (2.9) No response 22 Hispanic, Latino, or Spanish Origin Absent 3170 (95.4) Present 152 (4.6) No response 25 Educational attainment Some high school or less 3 (0.1) High school graduate 59 (1.8) Some college 398 (11.9) College graduate 1467 (43.9) Master's degree 696 (20.8) Doctorate or professional degree 716 (21.4) No response 8 Clinical role No clinical responsibilities 844 (25.6) Attending physician 247 (7.5) Fellow or resident physician 79 (2.4) Advanced practice provider (APRN, PA) 118 (3.6) Licensed nurse (RN, LPN) 491 (14.9) Clinical pharmacist or pharmacy staff 81 (2.5) Physical, occupational, or speech therapy 117 (3.5) Unlicensed care aid 48 (1.5) Case management or social work 32 (1.0) Technician (radiology, EKG, lab draw, etc) 76 (2.3) Clinical laboratory or clinical pathology 52 (1.6) Administrative or support staff 300 (9.1) Medical student 227 (6.9) Nursing student 82 (2.5) School of health professions student 153 (4.6) Other student 34 (1.0) Other 316 (9.6) No response 50 APRN, advanced practice registered nurse; PA, physician assistant; RN, registered nurse; LPN, licensed practical nurse; EKG, electrocardiogram
↵* Percentages refer to all respondents (excluding “no response”) for each item.
- Table 2.
Intentions, Barriers, and Facilitators Associated with SARS-CoV-2 Vaccination (n = 3347)
Variable N (%)* If a vaccine for novel coronavirus (COVID-19) receives Food and Drug Administration (FDA) approval, when do you intend to become vaccinated? Within the first month of approval 1241 (37.2) 1 to 3 months after approval 744 (22.3) 4 to 6 months after approval 379 (11.4) 7 to 12 months after approval 231 (6.9) More than 1 year (12 months) after approval 410 (12.3) I do not intend to be vaccinated 331 (9.9) No response 11 Which of the following concerns influence your decision to delay vaccination or to not receive vaccination?† Long-term side effects of the vaccine 1197 (57.1) The vaccine will not be safe 1152 (55.0) The vaccine will not be effective 777 (37.1) Risk of vaccination is more than the benefit 650 (31.0) The vaccine will be too expensive 255 (12.2) I may be allergic to the vaccine 234 (11.2) Short-term side effects (painful injection, muscle pain, feeling unwell the day of the injection, etc.) 159 (7.6) Personal religious, moral or ethical reasons 154 (7.4) The vaccine will give me novel coronavirus (COVID-19) 100 (4.8) I will not have time to get the vaccine 79 (3.8) Already been infected with novel coronavirus (COVID-19) 48 (2.3) Other 303 (14.5) No response 24 How concerned are you about becoming infected with novel coronavirus (COVID-19)? Extremely concerned 532 (15.9) Moderately concerned 1195 (35.7) Somewhat concerned 835 (25.0) Slightly concerned 554 (16.6) Not at all concerned 228 (6.8) No response 3 In general, would you say your health is: Excellent 948 (28.4) Very good 1651 (49.4) Good 641 (19.2) Fair 95 (2.8) Poor 6 (0.2) No response 6 - Table 3.
Bivariable and Multivariable Logistical Regression Models for Intention to Receive COVID-19 Within 3 Months of Regulatory Approval
Bivariable (Crude) Multivariable (Adjusted) Variable cOR (95% CI) P Value aOR (95% CI) P Value Significance* Age, decades 1.02 (0.97-1.07) .548 0.95 (0.90–1.00) .054 Men† 2.39 (1.99-2.89) <.001 2.43 (2.00–2.95) <.001 *** Influenza vaccine‡ 2.37 (1.79-3.15) <.001 2.35 (1.75-3.18) <.001 *** Viral concern§ 2.30 (1.99-2.65) <.001 2.40 (2.07-2.79) <.001 *** Patient interaction‖ 0.97 (0.85-1.12) .704 0.92 (0.79-1.07) .282 Higher education¶ 1.62 (1.40–1.87) <.001 1.41 (1.21–1.65) <.001 *** Poor health** 0.87 (0.74-1.03) .115 0.85 (0.71–1.01) .065 Race†† White Reference – – – – Black 0.16 (0.10–0.25) <.001 – – – Asian 1.53 (1.04-2.29) .036 – – – Other/multiple 0.63 (0.47-0.86) .003 – – – Hispanic†† 0.97 (0.70–1.36) .873 – – – cOR, crude odds ratio; CI, confidence interval; aOR, adjusted odds ratio.
↵* Significance with respect to the multivariable model (*P < .05, **P < .01, ***P < .001).
↵† Self-reported sex.
↵‡ Completion of influenza vaccination in the 2019-2020 season.
↵§ “Extremely concerned” or “moderately concerned” about becoming infected with COVID-19 on a 5-point Likert scale.
↵‖ Job responsibility involving direct patient interaction.
↵¶ Master's degree or Doctorate/Professional.
↵** Reporting anything other than “Excellent” or “Very Good” health on a 5-point Likert scale.
↵†† – Not included in the multivariable model.
- Table 4.
Post-Hoc, Exploratory Subgroup Analyses: Intention to Receive COVID-19 Vaccination and Reported Barriers Among White, Black, Hispanic, and Asian Respondents
Variable N (%)* White Black Hispanic Asian If a vaccine for novel coronavirus (COVID-19) receives Food and Drug Administration (FDA) approval, when do you intend to become vaccinated? Within the first month of approval 1152 (38.5) 17 (13.6) 56 (37.1) 61 (40.1) 1 to 3 months after approval 675 (22.6) 14 (11.2) 34 (22.5) 44 (28.9) 4 to 6 months after approval 333 (11.1) 12 (9.6) 19 (12.6) 20 (13.2) 7 to 12 months after approval 197 (6.6) 17 (13.6) 13 (8.6) 9 (5.9) More than 1 year (12 months) after approval 355 (11.9) 29 (23.2) 18 (11.9) 16 (10.5) I do not intend to be vaccinated 278 (9.3) 36 (28.8) 11 (7.3) 2 (1.3) No response 10 1 1 0 Which of the following concerns influence your decision to delay vaccination or to not receive vaccination?† The vaccine will not be safe 1015 (55.2) 64 (59.3) 37 (38.9) 56 (61.5) The vaccine will not be effective 693 (37.7) 38 (35.2) 34 (35.8) 29 (31.9) I may be allergic to the vaccine 186 (10.1) 23 (21.3) 4 (4.2) 18 (19.8) Risk of vaccination is more than the benefit 568 (30.9) 40 (37.0) 25 (26.3) 24 (26.4) Short-term side effects (painful injection, muscle pain, feeling unwell the day of the injection, etc.) 129 (7.0) 18 (16.7) 4 (4.2) 11 (12.1) Long-term side effects of the vaccine 1052 (57.2) 69 (63.9) 49 (51.6) 43 (47.3) The vaccine will be too expensive 229 (12.5) 8 (7.4) 15 (15.8) 15 (16.5) I will not have time to get the vaccine 69 (3.8) 0 (0.0) 9 (9.5) 5 (5.5) The vaccine will give me novel coronavirus (COVID-19) 81 (4.4) 16(14.8) 5 (5.3) 3 (3.3) Personal religious, moral or ethical reasons 124 (6.7) 21 (19.4) 3 (3.2) 3 (3.3) Already been infected with novel coronavirus (COVID-19) 45 (2.4) 2 (1.9) 0 (0.0) 1 (1.1) Other 266 (14.5) 16 (14.8) 4 (4.2) 11 (12.1) - Appendix Table 1.
Estimated Demographics of the Underlying Population Invited to Participate in the Survey
N (%)*,† Survey Health System‡ University‡ Composite§ Age, years 18 to 24 437 (13.1) 1153 (9.9) 1334 (18.7) 2487 (13.3) 25 to 34 974 (29.1) 4054 (34.8) 2763 (38.8) 6817 (36.3) 35 to 44 709 (21.2) 2667 (22.9) 1362 (19.1) 4029 (21.5) 45 to 54 565 (16.9) 1887 (16.2) 812 (11.4) 2699 (14.4) 55 to 64 520 (15.5) 1572 (13.5) 628 (8.8) 2200 (11.7) 65 years or greater 142 (4.2) 315 (2.7) 221 (3.1) 536 (2.9) Sex Men 726 (21.8) 2225 (19.1) 2912 (40.9) 5137 (27.4) Women 2601 (78.0) 9423 (80.9) 4208 (59.1) 13631 (72.6) Other 7 (0.2) – – – No response 13 – – – Race‖ American Indian or Alaska Native 6 (0.2) 57 (0.5) 24 (0.4) 81 (0.4) Asian/Pacific Islander 129 (3.9) 399 (3.4) 635 (9.6) 1034 (5.7) Black or African American 104 (3.1) 2007 (17.2) 353 (5.3) 2360 (12.9) White 2912 (87.6) 8555 (73.4) 5241 (78.9) 13796 (75.4) Other 79 (2.4) 339 (2.9) 136 (2.0) 475 (2.6) Multiple 95 (2.9) 291 (2.5) 250 (3.8) 541 (3.0) No response 22 – 481 481 Hispanic, Latino, or Spanish Origin Present 152 (4.6) 769 (6.6) 370 (5.2) 1139 (6.1) Absent 3170 (95.4) 10879 (93.4) 6750 (94.8) 17629 (93.9) No response 25 – – – Total 3347 11648 7120 18768 ↵* The count (N) of individuals in each demographic category are actual counts for the survey and University populations. Health System counts are calculated from the reported percentages and a total of 11,648 employees.
↵† Percentages are calculated from the number of responses for each category (excluding “no response”).
↵‡ Health system demographic statistics are provided by the University of Kansas Health System Human Resources Department, and as current as of 2020. University demographic statistics are provided by the University of Kansas Health Medical Center Office of Enterprise Analytics and are also current as of 2020. Health System and University populations are not completely disjoint (eg, a University faculty physician may also be a member of the Health System medical staff) but this represents a minority of both populations.
↵§ Composite is a combination of Health System and University demographics to approximate the demographic features of the whole underlying eligible population.
↵‖ Race and ethnicity data are reported here as orthogonal demographic features (ie, Hispanic persons may be of any race). Health system and University race and ethnicity data were reported with Hispanic, Latino, or Spanish origin as a racial category rather than two separate features for race and ethnicity. For the health system and University data, Hispanic/Latino persons were assumed to have racial distributions similar to their national distribution for Hispanic persons: 1.4% American Indian or Alaska Native, 0.5% Asian or Pacific Islander, 2.5% Black or African American, 53.0% white, 36.7% other, and 6.0% multiple races (these proportions do not sum to 100% due to rounding).
Demographic N (%)* Age, years 18 to 24 5 (9.1) 25 to 34 17 (30.9) 35 to 44 10 (18.2) 45 to 54 11 (20.0) 55 to 64 9 (16.4) 65 years or greater 3 (5.5) Sex Men 2 (4.8) Women 33 (78.6) Other 7 (16.7) No response 13 Race American Indian or Alaska Native – Asian 1 (2.2) Black or African American 1 (2.2) White 39 (84.8) Native Hawaiian or Other Pacific Islander – Other 4 Multiple 1 No response 9 Hispanic, Latino, or Spanish Origin Absent 46 (95.8) Present 2 (4.2) No response 7 Educational attainment Some high school or less – High school graduate 2 (4.3) Some college 3 (6.4) College graduate 23 (48.9) Master's degree 12 (25.5) Doctorate or professional degree 7 (14.9) No response 8 Clinical role No clinical responsibilities 11 (20.4) Attending physician 2 (3.7) Fellow or resident physician 3 (5.6) Advanced practice provider (APRN, PA) 1 (1.9) Licensed nurse (RN, LPN) 15 (27.8) Clinical pharmacist or pharmacy staff 1 (1.9) Physical, occupational, or speech therapy 1 (1.9) Unlicensed care aid 1 (1.9) Case management or social work – Technician (radiology, EKG, lab draw, etc) 3 (5.6) Clinical laboratory or clinical pathology 2 (3.7) Administrative or support staff 5 (9.3) Medical student 2 (3.7) Nursing student 2 (3.7) School of health professions student – Other student – Other 5 (9.3) No response 1 APRN, advanced practice registered nurse; PA, physician assistant; RN, registered nurse; LPN, licensed practical nurse; EKG, electrocardiogram.
↵* Percentages refer to all respondents (excluding “no response”) for each item.
- Appendix Table 3.
Bivariable Sensitivity Analysis for Alternative Dichotomization Thresholds for Predictor Variables Related to Intention to Receive COVID-19 Within 3 Months of Regulatory Approval
Variable cOR (95% CI) P Value Significance* Alternative viral concern† 3.66 (3.10–4.34) <.001 *** Alternative higher education‡ 1.83 (1.50–2.24) <.001 *** Alternative poor health§ 0.78 (0.52–1.17) .225 cOR, crude odds ratio; CI, confidence interval; aOR, adjusted odds ratio.
↵* Significance with respect to the bivariable model (*** P < .001).
↵† “Extremely concerned” or “moderately concerned” about becoming infected with COVID-19 on a 5-point Likert scale.
↵‡ College graduate, Master's degree, or Doctorate/Professional degree.
↵§ Reporting anything other than “Excellent”, “Very Good”, or “Good” health on a 5-point Likert scale.
- Appendix Table 4.
Multivariable Sensitivity Analysis Using Alternative Dichotomization Thresholds for Predictor Variables Related to Intention to Receive COVID-19 Within 3 Months of Regulatory Approval
Alternative Dichotomization Multivariable Odds Ratio (95% CI, P Value)* Concern† Edu‡ Health§ Age Sex (Men) Influenza Direct Interaction – – – 0.95 (0.90–1.00, .054) 2.43 (2.00–2.95, <.001) 2.35 (1.75-3.18, <.001) 0.92 (0.79-1.07, .282) – – Alt 0.94 (0.89-1.00, .036) 2.43 (2.01–2.95, <.001) 2.34 (1.74-3.16, <.001) 0.93 (0.80–1.08, .341) – Alt – 0.97 (0.92–1.02, .284) 2.47 (2.04-3.00, <.001) 2.34 (1.74-3.16, <.001) 0.91 (0.78-1.06, .212) – Alt Alt 0.97 (0.92–1.02, .230) 2.47 (2.04-3.00, <.001) 2.32 (1.72–3.14, <.001) 0.92 (0.79-1.07, .256) Alt – – 0.95 (0.90–1.01, .080) 2.60 (2.13-3.18, <.001) 2.40 (1.77-3.26, <.001) 0.88 (0.75-1.03, .108) Alt – Alt 0.95 (0.90–1.00, .055) 2.60 (2.14-3.18, <.001) 2.38 (1.76-3.24, <.001) 0.89 (0.76-1.04, .137) Alt Alt – 0.98 (0.92–1.03, .366) 2.64 (2.17-3.23, <.001) 2.40 (1.77-3.26, <.001) 0.87 (0.74-1.01, .075) Alt Alt Alt 0.97 (0.92–1.03, .299) 2.65 (2.18-3.23, <.001) 2.38 (1.75-3.23, <.001) 0.88 (0.75-1.02, .096) Alternative Dichotomization Multivariable Odds Ratio (95% Cl, P Value)* Concern† Edu‡ Health§ Concern Education Health – – – 2.40 (2.07-2.79, <.001) 1.41 (1.21–1.65, <.001) 0.85 (0.71–1.01, .065) – – Alt 2.37 (2.05-2.75, <.001) 1.43 (1.23-1.67, <.001) 0.80 (0.53-1.23, .305) – Alt – 2.40 (2.07-2.79, <.001) 1.54 (1.25-1.91, <.001) 0.84 (0.70–1.01, .057) – Alt Alt 2.38 (2.05-2.76, <.001) 1.58 (1.28-1.95, <.001) 0.78 (0.51–1.19, .237) Alt – – 4.00 (3.35-4.78, <.001) 1.42 (1.21–1.66, <.001) 0.85 (0.71–1.02, .073) Alt – Alt 3.96 (3.32–4.74, <.001) 1.44 (1.23-1.68, <.001) 0.80 (0.52–1.22, .288) Alt Alt – 4.01 (3.36-4.79, <.001) 1.54 (1.24-1.92, <.001) 0.84 (0.70–1.01, .062) Alt Alt Alt 3.97 (3.33-4.75, <.001) 1.58 (1.27-1.95, <.001) 0.77 (0.51–1.18, .222) CI, confidence interval; Edu, educational attainment; Alt, alternative.
↵* Boldface text indicates P < .05.
↵† Concern about becoming infected with COVID-19. Concern was reported on a 5-point Likert scale (extremely, moderately, somewhat, slightly, not at all). The original (–) threshold divides between moderately/somewhat. The alternative threshold divides between somewhat/slightly.
↵‡ Educational attainment was reported on a 6-point Likert scale (some high school, high school graduate, some college, college graduate, Master's degree and Doctoral/Professional degree). The original (–) threshold divides between College graduate/Master's degree. The alternative threshold divides between some college/college graduate.
↵§ Self-reported health status was reported on a 5-point Likert scale (excellent, very good, good, fair, poor). The original threshold (–) divides between very good/good. The alternative threshold divides between good/fair.
- Appendix Table 5.
Bivariable Sensitivity Analysis Using Alternative Dichotomization Thresholds for Response Variable: Intention to Receive COVID-19 Within 1 Month (Rather Than 3 Months) of Regulatory Approval
Variable cOR (95% CI) P Value Significance* Age, decades 1.05 (0.99-1.10) .079 Men† 2.23 (1.89-2.64) <.001 *** Influenza vaccine‡ 2.44 (1.76-3.46) <.001 *** Viral concern§ 1.95 (1.69-2.25) <.001 *** Patient interaction‖ 1.17 (1.01–1.34) .034 * Higher education¶ 1.54 (1.33-1.77) <.001 *** Poor health** 0.85 (0.71–1.01) .063 Alternative viral concern†† 2.63 (2.18-3.18) <.001 *** Alternative higher education‡‡ 1.82 (1.46-2.28) <.001 *** Alternative poor health§§ 0.78 (0.50–1.19) .259 cOR, crude odds ratio; CI, confidence interval.
↵* Significance (* P < .05, ** P < .01, *** P < .001).
↵† Self-reported gender.
↵‡ Completion of influenza vaccination in the 2019-2020 season.
↵§ “Extremely concerned” or “moderately concerned” about becoming infected with COVID-19 on a 5-point Likert scale.
↵‖ Job responsibility involving direct patient interaction.
↵¶ Master's degree or Doctorate.
↵** Reporting anything other than “Excellent” or “Very Good” health on a 5-point Likert scale.
↵†† “Extremely concerned”, “moderately concerned”, or “somewhat concerned” about becoming infected with COVID-19 on a 5-point Likert scale.
↵‡‡ College graduate, Master's degree, or Doctorate/Professional degree.
↵§§ Reporting anything other than “Excellent”, “Very Good”, or “Good” health on a 5-point Likert scale.
- Appendix Table 6.
Multivariable Sensitivity Analysis Using Alternative Dichotomization Thresholds for Response Variable: Intention to Receive COVID-19 Within 1 Month (Rather Than 3 Months) of Regulatory Approval
Alternative Dichotomization Multivariable Odds Ratio (95% Cl, P Value)* Concern† Edu‡ Health§ Age Sex (Men) Influenza Direct Interaction – – – 1.00 (0.95-1.06, .918) 2.25 (1.89-2.68, <.001) 2.21 (1.57-3.18, <.001) 1.16 (0.99-1.35, .064) – – Alt 1.00 (0.94-1.05, .938) 2.25 (1.89-2.68, <.001) 2.20 (1.57-3.16, <.001) 1.17 (1.00–1.36, .047) – Alt – 1.02 (0.97-1.08, .427) 2.28 (1.91–2.71, <.001) 2.21 (1.57-3.17, <.001) 1.14 (0.98-1.33, .090) – Alt Alt 1.02 (0.97-1.07, .508) 2.28 (1.92–2.71, <.001) 2.19 (1.56-3.15, <.001) 1.15 (0.99-1.34, .070) Alt – – 1.01 (0.96-1.07, .706) 2.28 (1.92–2.72, <.001) 2.23 (1.58-3.21, <.001) 1.12 (0.96-1.30, .160) Alt – Alt 1.01 (0.95-1.06, .830) 2.29 (1.92–2.73, <.001) 2.22 (1.57-3.19, <.001) 1.13 (0.97-1.31, .128) Alt Alt – 1.03 (0.98-1.09, .269) 2.31 (1.94-2.75, <.001) 2.23 (1.58-3.21, <.001) 1.10 (0.95-1.29, .209) Alt Alt Alt 1.03 (0.97-1.08, .324) 2.32 (1.94-2.76, <.001) 2.22 (1.57-3.19, <.001) 1.11 (0.95-1.30, .174) Alternative Dichotomization Multivariable Odds Ratio (95% Cl, P Value)* Concern† Edu‡ Health§ Concern Education Health – – – 2.02 (1.74-2.35, <.001) 1.29 (1.11–1.51, .001) 0.84 (0.70–1.01, .066) – – Alt 2.00 (1.72–2.32, <.001) 1.31 (1.13-1.53, <.001) 0.82 (0.52–1.27, .386) – Alt – 2.03 (1.74-2.36, <.001) 1.49 (1.19-1.89, <.001) 0.84 (0.70–1.01, .065) – Alt Alt 2.00 (1.73-2.33, <.001) 1.53 (1.22–1.93, <.001) 0.80 (0.51–1.24, .333) Alt – – 2.74 (2.26-3.34, <.001) 1.30 (1.12–1.52, <.001) 0.86 (0.72–1.03, .101) Alt – Alt 2.72 (2.24-3.31, <.001) 1.32 (1.13-1.54, <.001) 0.84 (0.53-1.29, .429) Alt Alt – 2.75 (2.27-3.35, <.001) 1.51 (1.20–1.91, <.001) 0.86 (0.72–1.03, .100) Alt Alt Alt 2.73 (2.25-3.32, <.001) 1.54 (1.22–1.94, <.001) 0.82 (0.52–1.26, .370) CI, confidence interval; Edu, educational attainment; Alt, alternative.
↵* Boldface text indicates P < .05.
↵† Concern about becoming infected with COVID-19. Concern was reported on a 5-point Likert scale (extremely, moderately, somewhat, slightly, not at all). The original (–) threshold divides between moderately/somewhat. The alternative threshold divides between somewhat/slightly.
↵‡ Educational attainment was reported on a 6-point Likert scale (some high school, high school graduate, some college, college graduate, Master's degree and Doctoral/Professional degree). The original (–) threshold divides between College graduate/Master's degree. The alternative threshold divides between some college/college graduate.
↵§ Self-reported health status was reported on a 5-point Likert scale (excellent, very good, good, fair, poor). The original threshold (–) divides between very good/good. The alternative threshold divides between good/fair.
Response (Intention)* Predictor (Age) cOR (95% CI) P Value Significance† 3 months Age 30 to 39 years‡ 0.83 (0.69-1.01) .058 3 months Age 40 to 54 years‡ 0.84 (0.69-1.01) .062 3 months Age >54 years‡ 0.98 (0.80–1.21) .877 Alt: 1 month Age 30 to 39 years‡ 0.93 (0.77-1.13) .483 Alt: 1 month Age 40 to 54 years‡ 0.94 (0.78-1.14) .532 Alt: 1 month Age >54 years‡ 1.12 (0.91–1.37) .289 - Appendix Table 8.
Multivariable Sensitivity Analysis Using Discretized Age and Various Alternative Dichotomization Thresholds for Predictor Variables Related to Intention to Receive COVID-19 Within 3 Months of Regulatory Approval
Alternative Dichotomization Multivariable Odds Ratio (95% Cl, P Value)* Concern† Edu‡ Health§ Age 30 to 39 years‖ Age 40 to 54 years‖ Age > 54 years‖ Sex (Men) Influenza – – – 0.68 (0.55-0.83, <.001) 0.66 (0.54-0.81, <.001) 0.75 (0.60–0.94, .012) 2.41 (1.99-2.93, <.001) 2.37 (1.76-3.21, <.001) – – Alt 0.67 (0.55-0.83, <.001) 0.65 (0.53-0.80, <.001) 0.74 (0.59-0.93, .008) 2.41 (1.99-2.93, <.001) 2.36 (1.75-3.19, <.001) – Alt – 0.73 (0.60–0.90, .002) 0.73 (0.60–0.90, .003) 0.84 (0.67-1.05, .118) 2.47 (2.04-3.00, <.001) 2.36 (1.75-3.19, <.001) – Alt Alt 0.73 (0.60–0.89, .002) 0.72 (0.59-0.89, .002) 0.83 (0.66-1.03,.097) 2.47 (2.05-3.01, <.001) 2.34 (1.74-3.16, <.001) Alt – – 0.69 (0.56-0.85, <.001) 0.69 (0.56-0.85, <.001) 0.75 (0.60–0.95, .016) 2.59 (2.12–3.16, <.001) 2.42 (1.79-3.30, <.001) Alt – Alt 0.68 (0.56-0.84, <.001) 0.68 (0.55-0.83, <.001) 0.74 (0.59-0.94, .011) 2.59 (2.12–3.17, <.001) 2.41 (1.78-3.27, <.001) Alt Alt – 0.75 (0.61–0.92, .005) 0.76 (0.62–0.94, .009) 0.84 (0.67-1.06, .136) 2.65 (2.18-3.24, <.001) 2.42 (1.79-3.29, <.001) Alt Alt Alt 0.74 (0.60–0.91, .004) 0.75 (0.61–0.92, .006) 0.83 (0.67-1.04, .112) 2.65 (2.18-3.24, <.001) 2.40 (1.77-3.26, <.001) Alternative Dichotomization Multivariable Odds Ratio (95% Cl, P Value)* Concern† Edu‡ Health§ Direct Interaction Concern Education Health – – – 0.91 (0.78-1.07, .253) 2.40 (2.07-2.79, <.001) 1.50 (1.28-1.76, <.001) 0.87 (0.73-1.04, .136) – – Alt 0.92 (0.79-1.07, .296) 2.38 (2.05-2.76, <.001) 1.52 (1.30–1.78, <.001) 0.84 (0.55-1.28, .413) – Alt – 0.90 (0.77-1.05, .189) 2.42 (2.08-2.81, <.001) 1.60 (1.29-1.98, <.001) 0.86 (0.72–1.03, .098) – Alt Alt 0.91 (0.78-1.06, .224) 2.40 (2.07-2.78, <.001) 1.63 (1.32–2.02, <.001) 0.80 (0.52–1.22, .296) Alt – – 0.88 (0.75-1.02, .096) 3.99 (3.34-4.77, <.001) 1.51 (1.28-1.77, <.001) 0.87 (0.73-1.05, .140) Alt – Alt 0.88 (0.76-1.03, .117) 3.96 (3.31–4.74, <.001) 1.52 (1.30–1.79, <.001) 0.83 (0.54-1.27, .377) Alt Alt – 0.86 (0.74-1.01, .066) 4.01 (3.36-4.80, <.001) 1.60 (1.29-1.98, <.001) 0.86 (0.72–1.03, .099) Alt Alt Alt 0.87 (0.74-1.02, .082) 3.98 (3.33-4.76, <.001) 1.63 (1.31–2.02, <.001) 0.79 (0.52–1.21,.268) CI, confidence interval; Edu, educational attainment; Alt, alternative.
↵* Boldface text indicates P < .05.
↵† Concern about becoming infected with COVID-19. Concern was reported on a 5-point Likert scale (extremely, moderately, somewhat, slightly, not at all). The original (–) threshold divides between moderately/somewhat. The alternative threshold divides between somewhat/slightly.
↵‡ Educational attainment was reported on a 6-point Likert scale (some high school, high school graduate, some college, college graduate, Master's degree and Doctoral/Professional degree). The original (–) threshold divides between College graduate/Master's degree. The alternative threshold divides between some college/college graduate.
↵§ Self-reported health status was reported on a 5-point Likert scale (excellent, very good, good, fair, poor). The original threshold (–) divides between very good/good. The alternative threshold divides between good/fair.
↵‖ Odds ratio relative to the reference class, age < 30 years.
- Appendix Table 9.
Multivariable Sensitivity Analysis Using Discretized Age and Various Alternative Dichotomization Thresholds for Predictor Variables Related to Intention to Receive COVID-19 Within 1 Month of Regulatory Approval (Alternative Response Variable)
Alternative Dichotomization Multivariable Odds Ratio (95% Cl, P Value)* Concern† Edu‡ Health§ Age 30 to 39 years‖ Age 40 to 54 years‖ Age > 54 years‖ Sex (Men) Influenza – – – 0.81 (0.66-0.99, .043) 0.81 (0.66-1.00, .045) 0.95 (0.76-1.18, .621) 2.24 (1.88-2.67, <.001) 2.22 (1.58-3.19, <.001) – – Alt 0.80 (0.65-0.98, .034) 0.79 (0.65-0.98, .029) 0.93 (0.75-1.16, .524) 2.24 (1.88-2.67, <.001) 2.21 (1.57-3.18, <.001) – Alt – 0.86 (0.70–1.05, .138) 0.88 (0.72–1.07, .201) 1.03 (0.83-1.29, .769) 2.28 (1.92–2.71, <.001) 2.21 (1.57-3.18, <.001) – Alt Alt 0.85 (0.70–1.04, .120) 0.86 (0.71–1.06, .157) 1.02 (0.82–1.27, .848) 2.28 (1.92–2.72, <.001) 2.20 (1.56-3.16, <.001) Alt – – 0.83 (0.68-1.02, .079) 0.84 (0.68-1.04, .108) 0.97 (0.78-1.21, .796) 2.27 (1.91–2.71, <.001) 2.24 (1.59-3.22, <.001) Alt – Alt 0.82 (0.67-1.01, .064) 0.83 (0.67-1.02, .078) 0.96 (0.77-1.19, .698) 2.28 (1.91–2.71, <.001) 2.23 (1.58-3.20, <.001) Alt Alt – 0.88 (0.72–1.08, .234) 0.92 (0.75-1.12, .393) 1.06 (0.86-1.32, .574) 2.31 (1.94-2.76, <.001) 2.24 (1.59-3.22, <.001) Alt Alt Alt 0.88 (0.72–1.07, .209) 0.90 (0.74-1.11, .330) 1.05 (0.85-1.31, .639) 2.32 (1.95-2.76, <.001) 2.23 (1.58-3.20, <.001) Alternative Dichotomization Multivariable Odds Ratio (95% Cl, P Value)* Concern† Edu‡ Health§ Direct Interaction Concern Education Health – – – 1.15 (0.99-1.34, .075) 2.03 (1.75-2.36, <.001) 1.36 (1.16-1.59, <.001) 0.86 (0.72–1.03, .113) – – Alt 1.16 (0.99-1.35, .058) 2.01 (1.73-2.33, <.001) 1.38 (1.18-1.61, <.001) 0.85 (0.54-1.31, .470) – Alt – 1.14 (0.98-1.32, .101) 2.04 (1.75-2.37, <.001) 1.53 (1.22-1.94, <.001) 0.86 (0.71–1.03, .095) – Alt Alt 1.15 (0.98-1.33, .081) 2.02 (1.74-2.35, <.001) 1.57 (1.25-1.98, <.001) 0.82 (0.52-1.27, .384) Alt – – 1.11 (0.95-1.29, .185) 2.73 (2.25-3.33, <.001) 1.36 (1.16-1.60, <.001) 0.88 (0.73-1.05, .161) Alt – Alt 1.12 (0.96-1.30, .153) 2.71 (2.24-3.30, <.001) 1.38 (1.18-1.61, <.001) 0.86 (0.55-1.33, .511) Alt Alt – 1.10 (0.94-1.28, .233) 2.75 (2.27-3.35, <.001) 1.54 (1.22-1.95, <.001) 0.87 (0.73-1.04, .138) Alt Alt Alt 1.11 (0.95-1.29, .198) 2.73 (2.25-3.33, <.001) 1.57 (1.25-1.99, <.001) 0.83 (0.53-1.28, .419) CI, confidence interval; Edu, educational attainment; Alt, alternative.
↵* Boldface text indicates P < .05.
↵† Concern about becoming infected with COVID-19. Concern was reported on a 5-point Likert scale (extremely, moderately, somewhat, slightly, not at all). The original (–) threshold divides between moderately/somewhat. The alternative threshold divides between somewhat/slightly.
↵‡ Educational attainment was reported on a 6-point Likert scale (some high school, high school graduate, some college, college graduate, Master's degree and Doctoral/Professional degree). The original (–) threshold divides between College graduate/Master's degree. The alternative threshold divides between some college/college graduate.
↵§ Self-reported health status was reported on a 5-point Likert scale (excellent, very good, good, fair, poor). The original threshold (–) divides between very good/good. The alternative threshold divides between good/fair.
↵‖ Odds ratio relative to the reference class, age < 30 years.
- Appendix Table 10.
Multivariable Sensitivity Analysis for Inclusion of Survey Completion Timestamp on 3-Month Vaccination Intention
Alternative Dichotomization Multivariable Odds Ratio (95% Cl, P Value)* Concern† Edu‡ Health§ Age Sex (Men) Influenza Direct Interaction Concern – – – 0.95 (0.90–1.00, .049) 2.43 (2.01– 2.95, <.001) 2.34 (1.74-3.17, <.001) 0.92 (0.79-1.07, .298) 2.40 (2.07-2.79, <.001) – – Alt 0.94 (0.89-1.00, .033) 2.43 (2.01– 2.96, <.001) 2.33 (1.73-3.15, <.001) 0.93 (0.80–1.08, .359) 2.37 (2.05-2.75, <.001) – Alt – 0.97 (0.92-1.02, .261) 2.47 (2.04-3.00, <.001) 2.32 (1.73-3.14, <.001) 0.91 (0.78-1.06, .224) 2.41 (2.07-2.79, <.001) – Alt Alt 0.97 (0.92-1.02, .210) 2.47 (2.05-3.00, <.001) 2.31 (1.71–3.12, <.001) 0.92 (0.79-1.07, .270) 2.38 (2.05-2.76, <.001) Alt – – 0.95 (0.90–1.00, .073) 2.60 (2.14-3.19, <.001) 2.38 (1.76-3.24, <.001) 0.88 (0.76-1.03, .117) 4.01 (3.36-4.80, <.001) Alt – Alt 0.95 (0.90–1.00, .050) 2.61 (2.14-3.19, <.001) 2.36 (1.75-3.21, <.001) 0.89 (0.76-1.04, .147) 3.97 (3.33-4.75, <.001) Alt Alt – 0.97 (0.92-1.03, .336) 2.65 (2.18-3.24, <.001) 2.38 (1.76-3.24, <.001) 0.87 (0.74-1.02, .081) 4.02 (3.36-4.81, <.001) Alt Alt Alt 0.97 (0.92-1.02, .273) 2.65 (2.18-3.24, <.001) 2.36 (1.74-3.21, <.001) 0.88 (0.75-1.03, .103) 3.98 (3.34-4.76, <.001) Alternative Dichotomization Multivariable Odds Ratio (95% Cl, P Value)* Concern† Edu‡ Health§ Education Health Timestamp‖ – – – 1.41 (1.20–1.64, <.001) 0.85 (0.71–1.01, .066) 0.99 (0.96-1.01, .241) – – Alt 1.43 (1.22-1.66, <.001) 0.80 (0.53-1.23, .306) 0.99 (0.96-1.01, .240) – Alt – 1.55 (1.25-1.91, <.001) 0.84 (0.70–1.01, .059) 0.98 (0.96-1.01, .167) – Alt Alt 1.58 (1.28-1.96, <.001) 0.78 (0.51–1.19, .239) 0.98 (0.96-1.01, .162) Alt – – 1.41 (1.21–1.65, <.001) 0.85 (0.71–1.02, .073) 0.98 (0.96-1.01, .164) Alt – Alt 1.43 (1.22-1.67, <.001) 0.80 (0.52-1.22, .288) 0.98 (0.96-1.01, .163) Alt Alt – 1.55 (1.25-1.92, <.001) 0.84 (0.70–1.01, .063) 0.98 (0.96-1.01, .115) Alt Alt Alt 1.58 (1.28-1.96, <.001) 0.77 (0.51–1.18, .224) 0.98 (0.96-1.00, .112) CI, confidence interval; Edu, educational attainment; Alt, alternative.
↵* Boldface text indicates P < .05.
↵† Concern about becoming infected with COVID-19. Concern was reported on a 5-point Likert scale (extremely, moderately, somewhat, slightly, not at all). The original (–) threshold divides between moderately/somewhat. The alternative threshold divides between somewhat/slightly.
↵‡ Educational attainment was reported on a 6-point Likert scale (some high school, high school graduate, some college, college graduate, Master's degree and Doctoral/Professional degree). The original (–) threshold divides between College graduate/Master's degree. The alternative threshold divides between some college/college graduate.
↵§ Self-reported health status was reported on a 5-point Likert scale (excellent, very good, good, fair, poor). The original threshold (–) divides between very good/good. The alternative threshold divides between good/fair.
↵‖ Measured in days.
- Appendix Table 11.
Multivariable Sensitivity Analysis for Inclusion of Survey Completion Timestamp on 1-Month Vaccination Intention
Alternative Dichotomization Multivariable Odds Ratio (95% Confidence Interval, P Value)* Concern† Edu‡ Health§ Age Sex (Men) Influenza Direct Interaction Concern – – – 1.00 (0.95-1.06, .953) 2.25 (1.89-2.68, <.001) 2.20 (1.56-3.16, <.001) 1.16 (0.99-1.35, .060) 2.02 (1.74-2.35, <.001) – – Alt 1.00 (0.94-1.05, .903) 2.26 (1.90–2.69, <.001) 2.19 (1.56-3.15, <.001) 1.17 (1.00 to 1.36, .045) 2.00 (1.72-2.32, <.001) – Alt – 1.02 (0.97-1.08, .462) 2.28 (1.91–2.71, <.001) 2.20 (1.56-3.15, <.001) 1.14 (0.98-1.33, .085) 2.03 (1.74-2.36, <.001) – Alt Alt 1.02 (0.96-1.07, .546) 2.28 (1.92-2.71, <.001) 2.18 (1.55-3.13, <.001) 1.15 (0.99-1.34, .066) 2.00 (1.73-2.33, <.001) Alt – – 1.01 (0.96-1.07, .740) 2.29 (1.92-2.73, <.001) 2.22 (1.57-3.18, <.001) 1.12 (0.96-1.30, .152) 2.75 (2.26-3.35, <.001) Alt – Alt 1.00 (0.95-1.06, .865) 2.29 (1.92-2.73, <.001) 2.20 (1.56-3.17, <.001) 1.13 (0.97-1.31, .121) 2.72 (2.25-3.32, <.001) Alt Alt – 1.03 (0.98-1.09, .295) 2.31 (1.94-2.75, <.001) 2.22 (1.57-3.19, <.001) 1.11 (0.95-1.29, .199) 2.75 (2.27-3.35, <.001) Alt Alt Alt 1.03 (0.97-1.08, .353) 2.32 (1.95-2.76, <.001) 2.20 (1.56-3.17, <.001) 1.11 (0.96-1.30, .165) 2.73 (2.25-3.33, <.001) Alternative Dichotomization Multivariable Odds Ratio (95% Confidence Interval, P Value)* Concern† Edu‡ Health§ Education Health Timestamp‖ – – – 1.29 (1.11–1.50, .001) 0.84 (0.70–1.01, .067) 0.99 (0.96-1.01, .246) – – Alt 1.31 (1.13-1.53, <.001) 0.82 (0.52-1.27, .388) 0.99 (0.96-1.01, .244) – Alt – 1.50 (1.19-1.90, <.001) 0.84 (0.70–1.01, .067) 0.98 (0.96-1.01, .184) – Alt Alt 1.54 (1.22-1.94, <.001) 0.81 (0.51–1.24, .337) 0.98 (0.96-1.01, .180) Alt – – 1.30 (1.11–1.52, <.001) 0.86 (0.72-1.03, .102) 0.98 (0.96-1.01, .198) Alt – Alt 1.32 (1.13-1.54, <.001) 0.84 (0.53-1.29, .431) 0.98 (0.96-1.01, .197) Alt Alt – 1.51 (1.20–1.91, <.001) 0.86 (0.72-1.03, .103) 0.98 (0.96-1.01, .149) Alt Alt Alt 1.55 (1.23-1.95, <.001) 0.82 (0.52-1.26, .373) 0.98 (0.96-1.01, .146) CI, confidence interval; Edu, educational attainment; Alt, alternative.
↵* Boldface text indicates P < .05.
↵† Concern about becoming infected with COVID-19. Concern was reported on a 5-point Likert scale (extremely, moderately, somewhat, slightly, not at all). The original (–) threshold divides between moderately/somewhat. The alternative threshold divides between somewhat/slightly.
↵‡ Educational attainment was reported on a 6-point Likert scale (some high school, high school graduate, some college, college graduate, Master's degree and Doctoral/Professional degree). The original (–) threshold divides between College graduate/Master's degree. The alternative threshold divides between some college/college graduate.
↵§ Self-reported health status was reported on a 5-point Likert scale (excellent, very good, good, fair, poor). The original threshold (–) divides between very good/good. The alternative threshold divides between good/fair.
↵‖ Measured in days.
Response (Intention)* Predictor (Race) cOR (95% CI) P Value Significance† 3 months Black or African American‡ 0.16 (0.10–0.25) <.001 *** 3 months Asian‡ 1.53 (1.04-2.29) .036 * 3 months Other/Multiple race‡ 0.65 (0.48-0.88) .006 ** Alt: 1 month Black or African American‡ 0.21 (0.11–0.37) <.001 *** Alt: 1 month Asian‡ 1.08 (0.75-1.56) .677 Alt: 1 month Other/Multiple race‡ 0.87 (0.63-1.20) .401 - Appendix Table 13.
Multivariable Sensitivity Analysis for Inclusion of Four-Level Race (White, Black, Asian, Other/Multiple Race) on 3-Month Vaccination Intention
Alternative Dichotomization Multivariable Odds Ratio (95% Confidence Interval, P Value)* Concern† Edu‡ Health§ Age Sex (Men) Influenza Direct Interaction Concern – – – 0.94 (0.89-1.00, .037) 2.48 (2.04-3.03, <.001) 2.22 (1.64-3.02, <.001) 0.91 (0.78-1.06, .227) 2.53 (2.17-2.95, <.001) – – Alt 0.94 (0.89-0.99, .025) 2.48 (2.04-3.03, <.001) 2.21 (1.63-3.01, <.001) 0.92 (0.79-1.07, .273) 2.50 (2.15-2.92, <.001) – Alt – 0.96 (0.91–1.02, .190) 2.53 (2.09-3.09, <.001) 2.21 (1.63-3.01, <.001) 0.90 (0.77-1.05, .187) 2.54 (2.18-2.96, <.001) – Alt Alt 0.96 (0.91–1.02, .153) 2.53 (2.09-3.09, <.001) 2.20 (1.62-2.99, <.001) 0.91 (0.78-1.06, .225) 2.51 (2.16-2.93, <.001) Alt – – 0.95 (0.89-1.00, .060) 2.65 (2.17-3.26, <.001) 2.23 (1.64-3.05, <.001) 0.87 (0.74-1.02, .088) 4.15 (3.47-4.99, <.001) Alt – Alt 0.94 (0.89-1.00, .042) 2.65 (2.17-3.26, <.001) 2.21 (1.62-3.03, <.001) 0.88 (0.75-1.03, .110) 4.12 (3.44-4.94, <.001) Alt Alt – 0.97 (0.92-1.02, .270) 2.71 (2.22-3.32, <.001) 2.23 (1.64-3.06, <.001) 0.86 (0.74-1.01, .071) 4.16 (3.47-4.99, <.001) Alt Alt Alt 0.97 (0.91–1.02, .222) 2.71 (2.22-3.32, <.001) 2.21 (1.62-3.03, <.001) 0.87 (0.74-1.02, .089) 4.12 (3.45-4.95, <.001) Alternative Dichotomization Multivariable Odds Ratio (95% Confidence Interval, P Value)* Concern† Edu‡ Health§ Education Health Black‖ Asian‖ Other/Multiple Race‖ – – – 1.36 (1.16-1.60, <.001) 0.86 (0.71–1.03, .098) 0.13 (0.08-0.21, <.001) 1.15 (0.77-1.76, .509) 0.59 (0.43-0.82, .001) – – Alt 1.38 (1.18-1.62, <.001) 0.82 (0.54-1.26, .366) 0.13 (0.08-0.22, <.001) 1.16 (0.77-1.78, .481) 0.59 (0.42-0.81, .001) – Alt – 1.44 (1.16-1.78, .001) 0.85 (0.71–1.02, .082) 0.14 (0.08-0.22, <.001) 1.20 (0.80–1.83, .394) 0.59 (0.43-0.82, .002) – Alt Alt 1.47 (1.18-1.82, <.001) 0.80 (0.52-1.23, .299) 0.14 (0.08-0.22, <.001) 1.21 (0.81–1.85, .365) 0.59 (0.43-0.82, .002) Alt – – 1.38 (1.17-1.62, <.001) 0.86 (0.72-1.04, .117) 0.14 (0.08-0.23, <.001) 1.12 (0.74-1.73, .590) 0.59 (0.42-0.82, .002) Alt – Alt 1.39 (1.19-1.64, <.001) 0.82 (0.53-1.26, .353) 0.14 (0.08-0.23, <.001) 1.13 (0.75-1.74, .560) 0.58 (0.42-0.81, .001) Alt Alt – 1.44 (1.15-1.79, .001) 0.85 (0.71–1.03, .094) 0.14 (0.09-0.24, <.001) 1.17 (0.77-1.79, .470) 0.59 (0.43-0.82, .002) Alt Alt Alt 1.46 (1.18-1.82, <.001) 0.79 (0.52-1.22, .284) 0.14 (0.09-0.24, <.001) 1.18 (0.78-1.81, .437) 0.59 (0.42-0.82, .002) CI, confidence interval; Edu, educational attainment; Alt, alternative.
↵* Boldface text indicates P < .05.
↵† Concern about becoming infected with COVID-19. Concern was reported on a 5-point Likert scale (extremely, moderately, somewhat, slightly, not at all). The original (–) threshold divides between moderately/somewhat. The alternative threshold divides between somewhat/slightly.
↵‡ Educational attainment was reported on a 6-point Likert scale (some high school, high school graduate, some college, college graduate, Master's degree and Doctoral/Professional degree). The original (–) threshold divides between College graduate/Master's degree. The alternative threshold divides between some college/college graduate.
↵§ Self-reported health status was reported on a 5-point Likert scale (excellent, very good, good, fair, poor). The original threshold (–) divides between very good/good. The alternative threshold divides between good/fair.
↵‖ Odds ratio relative to the reference class, White race.
- Appendix Table 14.
Multivariable Sensitivity Analysis for Inclusion of Four-Level Race (White, Black, Asian, Other/Multiple) on 1-Month Vaccination Intention
Alternative Dichotomization Multivariable Odds Ratio (95% Confidence Interval, P Value)* Concern† Edu‡ Health§ Age Sex (Men) Influenza Direct Interaction Concern – – – 1.00 (0.95-1.06, .980) 2.27 (1.91–2.71, <.001) 2.12 (1.50–3.05, <.001) 1.14 (0.98-1.33, .094) 2.07 (1.77-2.41, <.001) – – Alt 1.00 (0.94-1.05, .893) 2.28 (1.91–2.72, <.001) 2.11 (1.49-3.04, <.001) 1.15 (0.99-1.34, .073) 2.04 (1.76-2.38, <.001) – Alt – 1.02 (0.97-1.08, .482) 2.30 (1.93-2.74, <.001) 2.12 (1.50–3.05, <.001) 1.13 (0.97-1.32, .119) 2.07 (1.78-2.41, <.001) – Alt Alt 1.02 (0.96-1.07, .559) 2.31 (1.94-2.75, <.001) 2.11 (1.49-3.03, <.001) 1.14 (0.98-1.33, .095) 2.05 (1.76-2.38, <.001) Alt – – 1.01 (0.95-1.07, .745) 2.30 (1.93-2.74, <.001) 2.11 (1.50–3.05, <.001) 1.10 (0.95-1.29, .210) 2.74 (2.26-3.35, <.001) Alt – Alt 1.01 (0.95-1.06, .853) 2.30 (1.93-2.75, <.001) 2.11 (1.49-3.03, <.001) 1.11 (0.95-1.30, .174) 2.72 (2.24-3.32, <.001) Alt Alt – 1.03 (0.98-1.09, .292) 2.33 (1.95-2.78, <.001) 2.12 (1.50–3.06, <.001) 1.09 (0.94-1.28, .251) 2.74 (2.26-3.35, <.001) Alt Alt Alt 1.03 (0.97-1.08, .342) 2.33 (1.96-2.78, <.001) 2.11 (1.49-3.05, <.001) 1.10 (0.95-1.29, .212) 2.72 (2.24-3.32, <.001) Alternative Dichotomization Multivariable Odds Ratio (95% Confidence Interval, P Value)* Concern† Edu‡ Health§ Education Health Black‖ Asian‖ Other/Multiple Race‖ – – – 1.28 (1.09-1.49, .002) 0.85 (0.71–1.02, .091) 0.20 (0.10–0.35, <.001) 0.87 (0.59-1.28, .485) 0.84 (0.60–1.17, .299) – – Alt 1.30 (1.11–1.51, <.001) 0.84 (0.53-1.29, .428) 0.20 (0.10–0.35, <.001) 0.88 (0.60–1.29, .525) 0.83 (0.59-1.16, .279) – Alt – 1.44 (1.14-1.83, .002) 0.85 (0.71–1.02, .087) 0.20 (0.10–0.36, <.001) 0.90 (0.61–1.31, .574) 0.84 (0.60–1.17, .312) – Alt Alt 1.47 (1.17-1.87, .001) 0.82 (0.52-1.27, .382) 0.20 (0.10–0.37, <.001) 0.91 (0.62-1.33, .624) 0.83 (0.59-1.16, .291) Alt – – 1.29 (1.11–1.51, .001) 0.87 (0.73-1.05, .143) 0.21 (0.11–0.38, <.001) 0.87 (0.59-1.28, .490) 0.85 (0.60–1.18, .330) Alt – Alt 1.31 (1.12-1.53, <.001) 0.85 (0.54-1.31, .474) 0.21 (0.11–0.37, <.001) 0.88 (0.60–1.29, .522) 0.84 (0.60–1.17, .308) Alt Alt – 1.45 (1.15-1.85, .002) 0.87 (0.72-1.04, .136) 0.22 (0.11-0.39, <.001) 0.90 (0.61-1.32, .591) 0.85 (0.60–1.18, .343) Alt Alt Alt 1.48 (1.18-1.88, .001) 0.83 (0.53-1.29, .421) 0.22 (0.11-0.39, <.001) 0.91 (0.62-1.33, .631) 0.84 (0.60–1.18, .319) CI, confidence interval; Edu, educational attainment; Alt, alternative.
↵* Boldface text indicates P < .05.
↵* †Concern about becoming infected with COVID-19. Concern was reported on a 5-point Likert scale (extremely, moderately, somewhat, slightly, not at all). The original (–) threshold divides between moderately/somewhat. The alternative threshold divides between somewhat/slightly.
↵* ‡Educational attainment was reported on a 6-point Likert scale (some high school, high school graduate, some college, college graduate, Master's degree and Doctoral/Professional degree). The original (–) threshold divides between College graduate/Master's degree. The alternative threshold divides between some college/college graduate.
↵* §Self-reported health status was reported on a 5-point Likert scale (excellent, very good, good, fair, poor). The original threshold (–) divides between very good/good. The alternative threshold divides between good/fair.
↵* ‖Odds ratio relative to the reference class, White race.


