
Abstract
Background: Patient identification is an important step for advance care planning (ACP) discussions.
Objectives: We conducted a scoping review to identify prognostic indices potentially useful for initiating ACP.
Methods: We included studies that developed and/or validated a multivariable prognostic index for all-cause mortality between 6 months and 5 years in community-dwelling adults. PubMed was searched in October 2018 for articles meeting our search criteria. If a systematic review was identified from the search, we checked for additional eligible articles in its references. We abstracted data on population studied, discrimination, calibration, where to find the index, and variables included. Each index was further assessed for clinical usability.
Results: We identified 18 articles with a total of 17 unique prognostic indices after screening 9154 titles. The majority of indices (88%) had c-statistics greater than or equal to 0.70. Only 1 index was externally validated. Ten indices, 8 developed in the United States and 2 in the United Kingdom, were considered clinically usable.
Conclusion: Of the 17 unique prognostic indices, 10 may be useful for implementation in the primary care setting to identify patients who may benefit from ACP discussions. An index classified as “clinically usable” may not be easy to use because of a large number of variables that are not routinely collected and the need to program the index into the electronic medical record.
In the United States and worldwide, there is recognition that advance care planning (ACP) is important in patient care.1⇓–3 A group of experts using the Delphi process defined ACP as follows: “ACP is a process that supports adults at any age or stage of health in understanding and sharing their personal values, life goals, and preferences regarding future medical care. The goal of ACP is to help ensure that people receive medical care that is consistent with their values, goals and preferences during serious and chronic illness.”4 ACP is a process that allows physicians and other health care professionals to provide care concordant with patient-defined goals and values.5 ACP is not limited to ensuring the designation of a proxy for health care decision-making or documentation of code status, although these aspects are usually part of the discussion.
Although ACP can reduce anxiety and depression in patients and families and increase the likelihood for patients to receive medical care concordant with their goals and values,6⇓–8 only about one-third of the population in the United States participates in some form of ACP.9 Current research efforts focus on expanding the implementation of ACP and measuring its quality and clinical impact.10,11
Although ACP is potentially appropriate for nearly all adult patients, given the realities of a busy practice, it would be useful to have a system for identifying patients with a more limited prognosis. Family medicine physicians are well situated to engage in ACP due to the continuity of care that they provide.12 However, they are often uncertain about which patients to involve in ACP conversations and when to have the discussion.13 Prognosis is often used for referral to hospice or palliative care.14⇓–16 Prognosis is a possible trigger for primary care physicians to initiate ACP with patients.17
We conducted a scoping review and summarized prognostic indices that predict all-cause mortality in community-dwelling adults. The purpose was to identify prognostic indices potentially useful for supporting implementation of ACP in primary care. The key question was the following: “What studies developed and/or validated a prognostic index for 6-month to 5-year all-cause mortality in community-dwelling adults?” Our objective was to identify indices that might assist family physicians and others with identifying patients who may be appropriate for ACP discussions well before the final weeks of life.
Methods
This review was informed by the Preferred Reporting Items for Systematic Reviews and Meta-analyses Extension for Scoping Reviews checklist.18
Eligibility Criteria
We adapted the following criteria from the Transparent Reporting of a multivariable prediction model for Individual Prognosis Or Diagnosis (TRIPOD) checklist19: the study developed and/or validated a multivariable prediction model in community-dwelling adults, and the outcome was all-cause mortality in the range of 6 months to 5 years. The time frame was chosen to aid clinicians in initiating ACP before a patient is eligible for hospice but when a serious illness conversation would be appropriate.8,14 Individuals with a life expectancy of less than 6 months ideally should undergo a series of ACP conversations, but the focus of this article was to identify algorithms that could help predict life expectancy for longer intervals and, thus, promote ACP earlier than it might otherwise be done. All types of articles meeting our eligibility criteria were included.
Information Sources and Search Strategy
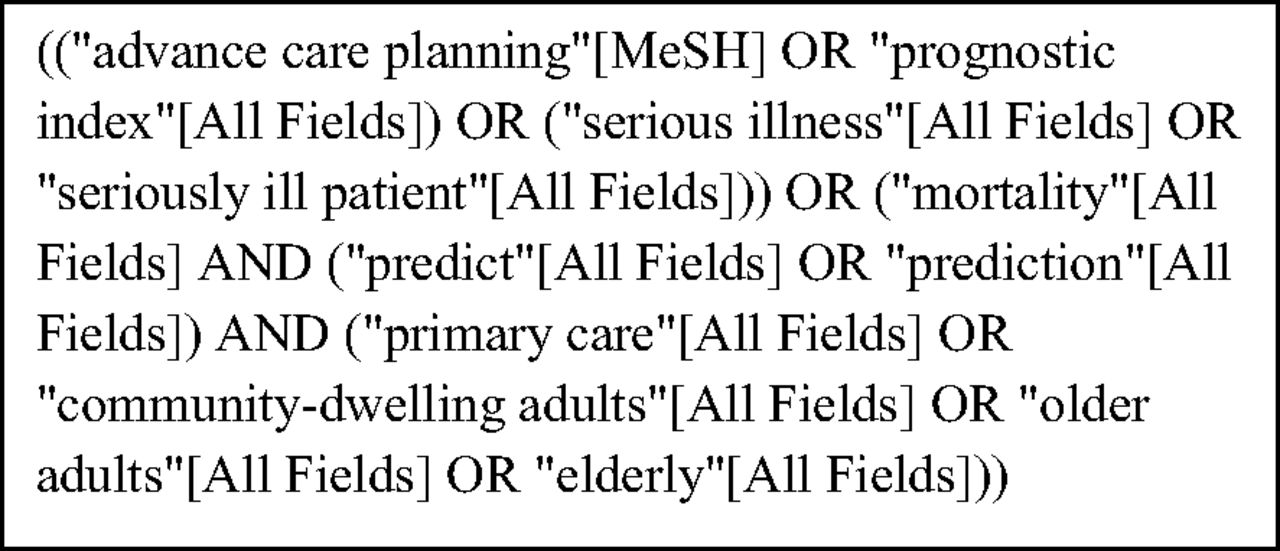
PubMed was searched on October 27, 2018 for articles using the strategy indicated in Figure 1. PubMed includes all articles from 1966 or the first year a given journal was published. Search terms were built using concepts such as ACP, prognostic index, serious illness, and mortality. Filters such as ‘humans,” “English-language,” and “adult: 19+ years” were applied. References of a systematic review that met the eligibility criteria were checked to identify additional studies.

Final Search Query as displayed on PubMed.
Selection of Sources of Evidence
The literature search and screening of titles were completed by 1 author (PK). Articles with titles indicating development and/or validation of a prognostic index in community-dwelling adults were chosen. Then, the abstracts of these articles were reviewed by 2 independent investigators (PK and JD/BTL/MBS) for possible inclusion. Differences were resolved by discussion among all reviewers. Full-text articles of abstracts that met our inclusion criteria were assessed for eligibility by 1 researcher (PK). During full-text review, studies were excluded if (1) a prognostic index was not internally validated, (2) it identified individual predictors of mortality but did not develop a usable index, or (3) over half of the cohort used to develop the index was hospitalized or nursing home patients. Eighteen articles met the inclusion criteria.20⇓⇓⇓⇓⇓⇓⇓⇓⇓⇓⇓⇓⇓⇓⇓⇓–37
Data Abstraction
Two investigators (PK, BTL) reviewed each article and tabulated each prognostic index according to broad categories of usability (clinically usable vs not usable) and summarized key information regarding each index in Tables 1 ⇓to 3. Final tables were agreed on by all authors. An index was considered clinically usable if the instrument scoring and interpretation were available either in the article or online and not usable otherwise. A website link to each index, if available, was included in Table 3.
Descriptive Statistics of the 17 Unique Indices*
Prognostic Indices for Community-Dwelling Adults, by the Most Recent Published Year and Authors in Alphabetical Order, according to the Increasing Order of the Time Frame of Mortality Index
Evaluation of Prognostic Indices according to Usability and Time Frame of Mortality Outcome
Discrimination of a prognostic index, as measured by the c-statistic in the cut-point analyses of the index, was categorized as poor (<0.60), moderate (0.60 to 0.69), good (0.70 to 0.79), very good (0.80 to 0.89), or excellent (≥0.90).38,39 Tools were considered well calibrated if the percent difference between predicted and observed mortality in a given risk group was less than 10 and poor if greater than or equal to 10%.38 Other calibration and fitting methods, such as Hosmer-Lemeshow statistics, a test where statistical significance indicates poor calibration, and Cox calibration regression, where an α intercept of 0 and β slope of 1 indicate perfect calibration, were included if reported.40 If the index predicted mortality at more than 1 time point, it was categorized under the longest mortality estimate that did not exceed 5 years, but information regarding the authors’ other cut points was included in Table 2.
Results
Search Results
Figure 2 shows the flow diagram of the study selection process, adapted from the Preferred Reporting Items for Systematic Reviews and Meta-analyses Extension statement.41 Using our predefined search terms, we identified 18,305 records; applying filters on PubMed excluded 9,151 records and 9,154 titles were screened. After the title screening process, 182 abstracts were reviewed for potential eligibility. Forty-four full-text articles were assessed, and 1 additional unique article was found in the references of a systematic review identified through the search,38 leading to 45 articles that were considered for full-text review. Of these, 18 articles met our inclusion criteria and were summarized in Tables 1 ⇓to 3.20⇓⇓⇓⇓⇓⇓⇓⇓⇓⇓⇓⇓⇓⇓⇓⇓–37 Of these, 1 study externally validated a published index,21 yielding a total of 17 unique indices. Table 1 summarizes the 17 indices. The majority of indices were developed in the United States (n = 10), followed by Europe (n = 6), and Asia (n = 1).
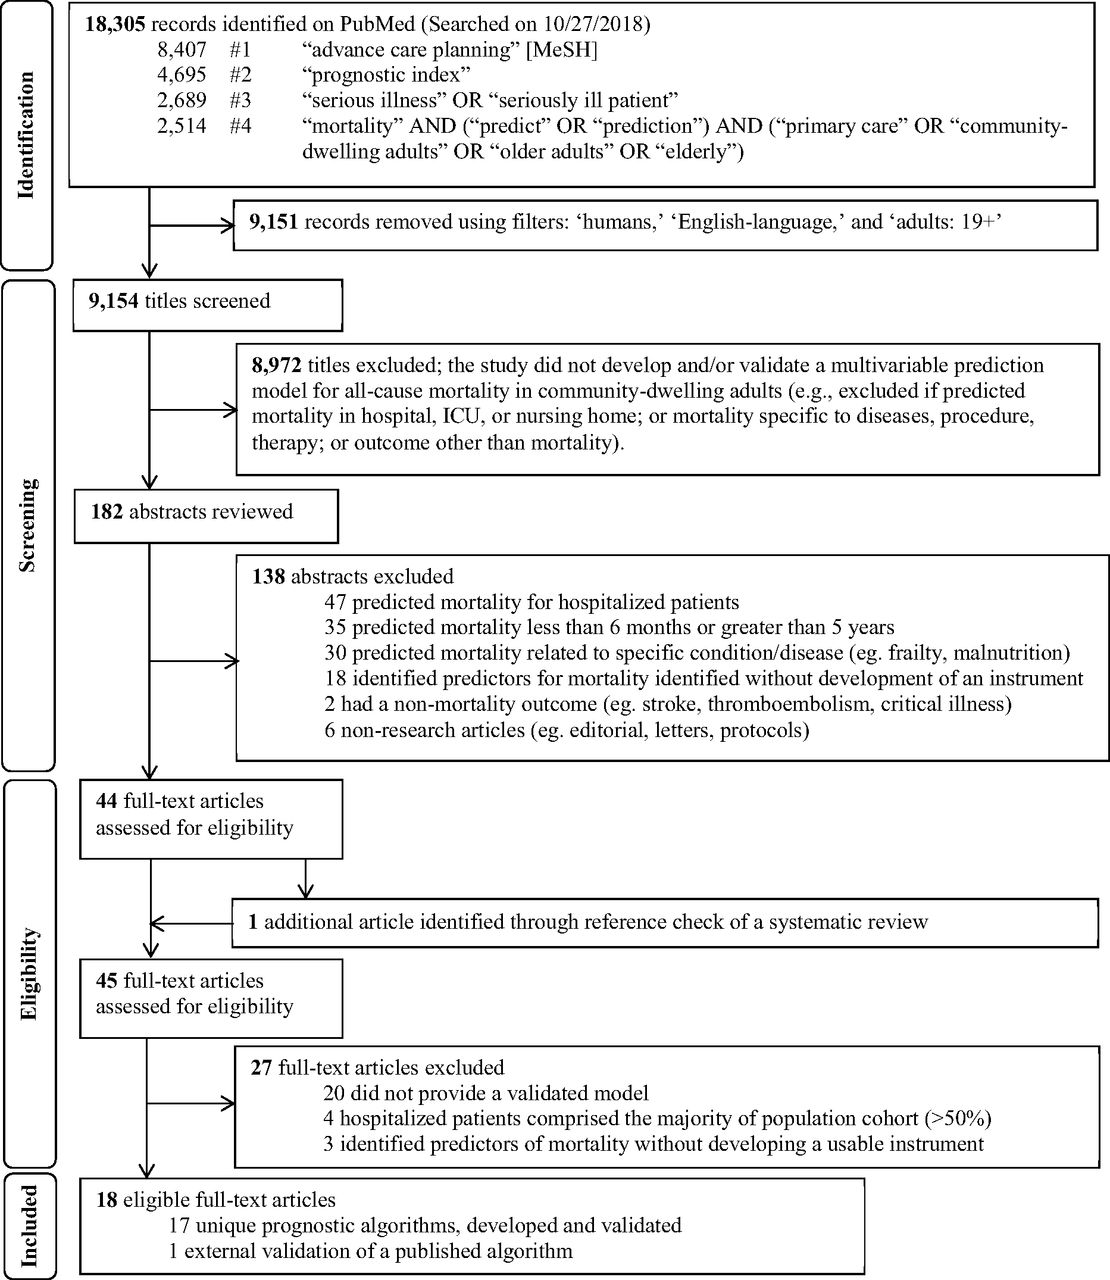
Flow diagram of study selection process to identify potentially useful prognostic indices in the primary care setting to help initiate advance care planning, adapted from the PRISMA statement.24 Abbreviations: MeSH, Medical Subject Headings; ICU, intensive care unit
The systematic review conducted by Yourman et al.38 identified 16 unique prognostic indices that were developed in community, nursing home, and hospital settings. Five out of 6 prognostic indices in the community setting for predicting 1- to 5-year mortality were captured using the search terms in this scoping review.27,28,30,31,37 The combined comorbidity score to predict 1-year mortality by Gagne et al.26 was not captured, possibly because it is listed under the medical subjects heading term “hospital mortality” on PubMed. It met our inclusion criteria and was included in the final list for full-text review. The remaining 10 of 16 studies in Yourman et al.38 were excluded based on our eligibility criteria.
Characteristics of Identified Indices
Table 2 summarizes the 18 articles meeting the criteria for full review, including the population studied, information on the development and/or validation cohort, calibration statistics, and discrimination as assessed by the c-statistic. Calibration and discrimination should be described for clinical prediction models.42 There was heterogeneity in reporting the calibration of prognostic indices, but the majority of indices were well calibrated, as indicated by less than 10% difference in the predicted and observed mortality rates.22,24,26⇓–28,30,31,34,35,37 Two studies did not report calibration.23,29 No prognostic indices had excellent discrimination (c-statistic, ≥0.90). Eight indices had very good discrimination (c-statistic, 0.80 to 0.89),22,23,25,31⇓⇓⇓–35 7 had good discrimination (c-statistic, 0.70 to 0.79),21,24,26⇓–28,36,37 and 2 had moderate discrimination (c-statistic, 0.60 to 0.69).29,30
Table 3 groups the indices by clinical usability. For each index, we report authors and year published, population and country, mortality time frame, where to find, and all variables included in the instrument. Ten articles presented their prognostic indices either in the article or online and were classified as clinically usable.22,26⇓–28,30,31,33,34,36,37 There was 100% agreement between the 2 reviewers (PK and BTL) on clinical usability. Although Pilotto et al.24 included a link to downloadable software, we classified it as not usable because it requires knowledge of Italian. The modified Geriatric Prognostic Index by Jung et al.32 is available as a free downloadable application on mobile devices, but we classified it as not usable because it requires knowledge of Korean and uses scales not commonly used in the United States.
Assessment of Individual Indices
Summarized below are 17 published indices identified from 18 articles according to the time frame of the mortality index.
Six-Month Mortality
Duarte et al.21 externally validated the Patient-Reported Outcome Mortality Prediction Tool (PROMPT) in patients age 65 and older in Maine, US. The development cohort was that used by Han et al.20 The PROMPT questionnaire shown in their Appendix is a patient self-reported questionnaire that takes 15 minutes. The calibration curve was shown, but no information was provided on predicted or observed mortality rates for the different risk groups. The index had good discrimination.
Han et al.20 developed PROMPT, which estimates 6-month mortality risk by using cohorts from the 1998 to 2003 Medicare Health Outcomes Survey of community-dwelling adults aged 65 years and older in the United States. The calibration curve was shown, but no actual data were provided for the predicted or observed mortality rates for the different risk groups. The index had good discrimination.
One-Year Mortality
The QMortality® risk prediction equation developed by Hippisley-Cox and Coupland is a 1-year mortality index for primary care patients aged 65 and older.22 Using a large, validated medical research database in England, the algorithms for both men and women were well calibrated and had very good discrimination.
Crooks et al.23 developed a comorbidity score to predict 1-year mortality using 3 national administrative databases in England. All people older than 20 years registered to a primary care practice were followed for 1 year and were randomly divided into 2 halves for development and validation. Characteristics of each cohort were not reported separately. The relative goodness of fit was statistically significant compared with the Charlson and the Elixhauser indices (likelihood ratio test, P < .0001), indicating improvement in model fitting for the score developed by Crooks et al.23 It also had better discriminatory performance than Charlson43 (c-statistic, 0.87; 95% CI, 0.87–0.87) or Elixhauser comorbidity measures44 (c-statistic, 0.87; 95% CI, 0.87–0.87). Charlson43 and Elixhauser44 are well-known prognostic indices.
Pilotto et al.24 developed an index based on an assessment of community-dwelling adults older than 65 years living at home in Italy. The index was well calibrated across all risk groups and had good discrimination.
Wang et al.25 developed a model to predict 1-year mortality in patients aged 18 to 100 years who were assigned to a Veterans Health Administration primary care provider. It was well calibrated (Cox Intercept, α = 0.001 [95% CI, −0.001 to 0.023]; Cox Slope, β = 1.002 [95% CI, 0.998–1.008]) and had very good discrimination. However, a narrow range of mortality was observed (0.1% to 9.1%) for patients categorized between the 5th and 90th predicted risk percentiles. Coefficients included in the model to predict death are available in a supplemental table with 95% CIs.
Gagne et al.26 used low-income Medicare enrollees from Pennsylvania and New Jersey. The index was well calibrated and had good discrimination. Mortality ranged from 3% to 29%.
Fifteen-Month Mortality
Mazzaglia et al.27 developed and validated a 15-month mortality index for community-dwelling older adults by using data from a screening survey of patients answered by primary care physicians from 2 regions of Florence, Italy. The final model includes a number of positive responses to another screening test, which is not available in the article.45 The index was well calibrated and showed good discrimination. The reported mortality was narrow, ranging from 0% to 10%.
Two-Year Mortality
Carey et al.28 developed a functional morbidity index to predict 2-year mortality in community-dwelling older adults aged 70 and older by using data from the Asset and Health Dynamics Among the Oldest Old study in the United States. The index was well calibrated across the risk groups and demonstrated good discrimination.
Three-Year Mortality
Turusheva et al.29 developed 2 models of mortality risk score to predict 3-year mortality. The derivation cohort (n = 379) was randomly sampled using data from a prospective cohort study of community-dwelling older adults aged 65 to 91 years in Saint Petersburg, Russia. The authors validated the 2 models by using a cohort from an external cohort study of people aged 80 years or older in Belgium (n = 567). Both models had good discrimination in the development cohort but poor-to-moderate performance in validation. Calibration was not reported in the study.
The other 3-year mortality index for community-dwelling elderly was developed by Carey et al.30 This index allows for prediction of 1-, 2-, and 3-year mortality. Its data source was patients enrolled in the Program of All-inclusive Care for the Elderly in the Western, Midwestern, and Eastern regions of the United States. The index was developed using the cohort from the Western region and validated in the other 2 regions. The index had moderate discrimination and was well calibrated across all risk groups for 1-, 2-, and 3-year mortality.
Four-Year Mortality
A 4-year mortality index was developed by Lee et al.31 in community-dwelling adults aged 50 years and older in the United States who answered the Health and Retirement Survey from 1992 to 1998. The development and validation cohorts were chosen based on geographic location in the United States. The index was well calibrated across all risk groups and had very good discrimination.
Five-Year Mortality
Jung et al.32 developed a geriatric prognosis index to predict 3- and 5-year mortality. Its data source for development was the Korean Longitudinal Study on Health and Aging cohort, which included people aged 65 years and older living in a suburban city of South Korea. A retrospective review of medical records of people aged 60 years and older who had a geriatric assessment in the outpatient geriatric clinic or inpatient ward was used for validation. The proportion of inpatients used for the validation cohort was not reported. The index requires the use of a number of other scores such as the Charlson Comorbidity Index and multiple geriatric scales. Three-year mortality was well calibrated for all risk groups. Calibration for 5-year mortality was poor for higher risk groups but well calibrated for lower and middle risk groups. For both 3- and 5-year mortality, the 95% CI for mortality was wide for all risk groups. The index had good discrimination for 3-year mortality and very good discrimination for 5-year mortality.
Ganna and Ingelsson33 developed a 5-year mortality prediction score using UK Biobank participant data from England and Wales, and they validated it using participants from Scotland. Prediction models were developed separately for men (13 items) and women (11 items). These models had very good discrimination for men and good discrimination for women. The score for men was poorly calibrated (Hosmer-Lemeshow, P = .0402), but the score for women was well calibrated (Hosmer-Lemeshow, P = .28). For the Hosmer-Lemeshow test, statistical significance (P < .05) means poor calibration.
The Ensemble Index developed by Mathias et al.34 to predict 5-year mortality was developed using predictive data mining and analysis of electronic health records data from Epic (Verona, WI) and Cerner (Kansas City, MO). The random forest ensemble technique with alternating decision tree was used to develop the model, and 10-fold cross validation was used. Its discrimination was very good, showing a higher c-statistic than the Walter life expectancy method and Charlson Comorbidity Index,46,47 and it was well calibrated across all risk groups.
Tan et al.35 developed a life expectancy model that adapts the Elixhauser comorbidity measure44 to predict 1- and 5-year mortality in the Medicare population in the United States. A 5% random sample of Medicare data was randomly split for development and validation. The model was well calibrated for all risk groups for 5-year mortality and for low-to-middle risk groups for 1-year mortality in both males and females. Calibration in the high-risk groups for 1-year mortality in both males and females was poor. Discrimination was very good for 1-year mortality in females and good for 5-year mortality in females and 1- and 5-year mortality in males.
Zhang et al.36 developed a 1- and 5-year mortality index using data collected alongside a national health survey of noninstitutionalized adults in the United States. The development cohort came from randomly selecting 60% and using the remaining 40% for validation. The models were well calibrated according to the Hosmer-Lemeshow statistics. Both the 1- and 5-year mortality index had good discrimination and predicted a wide range of mortality between low- and high-risk groups (2% to 42% for 1 year and 7% to 81% for 5 year).
Schonberg et al.37 developed a 5-year mortality index for adults aged 65 years and older with good discrimination. Linking data from the National Health Interview Survey and the National Death Index, two-thirds were randomly selected for development and the remainder for validation. The index was well calibrated across all risk groups and predicted a wide range of mortality between the lowest to highest risk groups.
Discussion
This review summarizes 17 unique prognostic indices from 18 articles that predict all-cause mortality between 6 months to 5 years in community-dwelling adults. Our review summarizes the performance of prognostic indices and assesses their potential for clinical use aimed at supporting implementation of ACP in the primary care setting. Ten articles included algorithms that were usable in the setting of primary care office.22,26⇓–28,30,31,33,34,36,37 Our search criteria included adults 18 years and older. However, only 3 of the 10 usable indices were developed and validated in a population cohort that included patients less than 65 years.31,33,34 Three systematic reviews have identified prognostic indices that predict mortality in community-dwelling adults,38,48,49 but none of them made recommendations on which tool to prioritize for clinical implementation. Even a prognostic index that is accurate, externally validated, well calibrated, and with a low risk of bias may still have limited clinical use and impact if it is difficult to use and if the physician does not have access to all variables necessary for a specific prognostic algorithm. Several of the indices we identified as clinically usable require knowledge of multiple variables and are impractical without systematic collection of these variables or additional programming in an electronic medical record.
Implications for Future Research
Currently available approaches to prognostication include clinical intuition and algorithms. A validated approach using clinical intuition to trigger palliative care is to ask the following Surprise Question (SQ): “Would I be surprised if this patient died in the next 12 months?”17 Because the SQ was not originally developed to predict mortality, more research is needed to test how the SQ can aid in the patient identification process for physicians to initiate ACP.16 Combining the SQ with another prognostic tool has the potential to enhance accuracy in determining a patient’s prognosis.50
The indices we classified as clinically usable may not be easy to use. They often require knowledge of many variables that may not be easily accessible to the practicing physician. Future research should compare the clinically usable indices we identified for time spent per patient and resources required to program them into their existing electronic medical records to see which ones are most feasible in busy practices, given the large number of variables that many of them have.22,26⇓–28,30,31,33,34,36,37 It is possible that these algorithms could be programmed into the electronic medical record to prompt physicians to discuss ACP with appropriate patients, the same way many other best practice alerts are now. It is currently unclear which if any of the indices we identified might work best for initiating ACP discussions. With a growing interest in the use of machine learning and artificial intelligence in medical care, our results can guide researchers who wish to test multiple algorithms simultaneously.51,52
Our work has implications for practice-based research networks that wish to expand the implementation of ACP in the primary care setting. For example, the Patient-Centered Outcomes Research Institute recently funded 7 studies to encourage the expansion of ACP and palliative care.53,54 The Meta-network Learning And Research Center (Meta-LARC) ACP trial is 1 of these studies.55 Meta-LARC is a consortium of 7 practice-based research networks in the United States and Canada including over 900 primary care practices and approximately 4000 clinicians who care for over 3 million patients. Meta-LARC is dedicated to increasing the quality, effectiveness, and safety of primary care through accelerated research and collaborative learning (https://www.ohsu.edu/oregon-rural-practice-based-research-network/meta-larc). The ACP trial will use the infrastructure of Meta-LARC to conduct a cluster randomized trial in 42 primarily family physician practices in the United States and Canada to compare the efficacy of clinician-led versus team-based approaches to implement ACP in primary care.
Limitations
The risk of bias in individual indices was not assessed, as it was not applicable for our review. Publication bias may exist because we searched only on PubMed, which may miss some articles. Given the heterogeneity in the way studies reported their calibration, straightforward comparisons were impossible. Studies that included administrative data may have included hospitalized and nursing home patients. Although we attempted to exclude indices developed on cohorts where more than 50% were hospitalized or in nursing homes, not all articles provided this information. For this study, we abstracted the calibration statistics, as reported by the authors of each prognostic index. Currently, methods to assess model performance are not standardized and are reported in a variety of ways. Future studies of prognostic indices should report calibration by using standard means.42 Clinicians and researchers can choose to implement the prognostic algorithms we classified as usable and test whether appropriate patients for ACP conversations are identified in the primary care setting.
Conclusion
Our review identified 18 studies with 17 published prognostic indices that are potentially useful for patient identification for ACP conversations. Eight prognostic indices from the United States and 2 from the United Kingdom were identified as clinically usable.22,26⇓–28,30,31,33,34,36,37 An index classified as clinically usable may not be easy to use because of a large number of variables that are not routinely collected and the need for programming the index into the electronic medical record. Future research should validate these indices in other populations, compare across indices to determine time spent per patient, and program them into electronic medical records to see which ones are most feasible in busy practices.
Acknowledgments
The authors thank Sharon Straus, MD, University of Toronto, Toronto, Ontario, and Annette Totten, PhD, Oregon Health and Science University, Portland, Oregon for their feedback on this manuscript. The authors would like to thank Parang Kim, MS, University of Iowa, for her work in formatting the tables.
Notes
This article was externally peer reviewed.
To see this article online, please go to: http://jabfm.org/content/33/2/322.full.
Conflict of interests: None.
Funding: This work was partially supported by the Iowa Academy of Family Physicians Endowed Chair for Rural Medicine Fund, Department of Family Medicine, University of Iowa Carver College of Medicine, and the Patient-Centered Outcomes Research Institute (PCORI) Award (PLC-1609-36277). The funders had no role in any part of the study including its conception and design, acquisition, or analysis and interpretation of data, and drafting or revision of the manuscript. The statements in this publication are solely the responsibility of the authors and do not necessarily represent the views of the PCORI, its board of governors, or methodology committee.
- Received for publication May 8, 2019.
- Revision received October 11, 2019.
- Accepted for publication October 14, 2019.
References
In this issue


Jump to section
Related Articles
Cited By...
- Can Electronic care planning using AI Summarization Yield equal Documentation Quality? (EASY eDocQ)
- Using Primary Health Care Electronic Medical Records to Predict Hospitalizations, Emergency Department Visits, and Mortality: A Systematic Review
- Evaluation of a process to implement advance care planning conversations in primary care: uptake and patient experience
- Development of a Histopathology Informatics Pipeline for Classification and Prediction of Clinical Outcomes in Subtypes of Renal Cell Carcinoma
- Advance Care Planning During the COVID-19 Pandemic
- Many Family Medicine Successful Interventions and Clinical Reviews for Common Illnesses