
Article Figures & Data
Figures
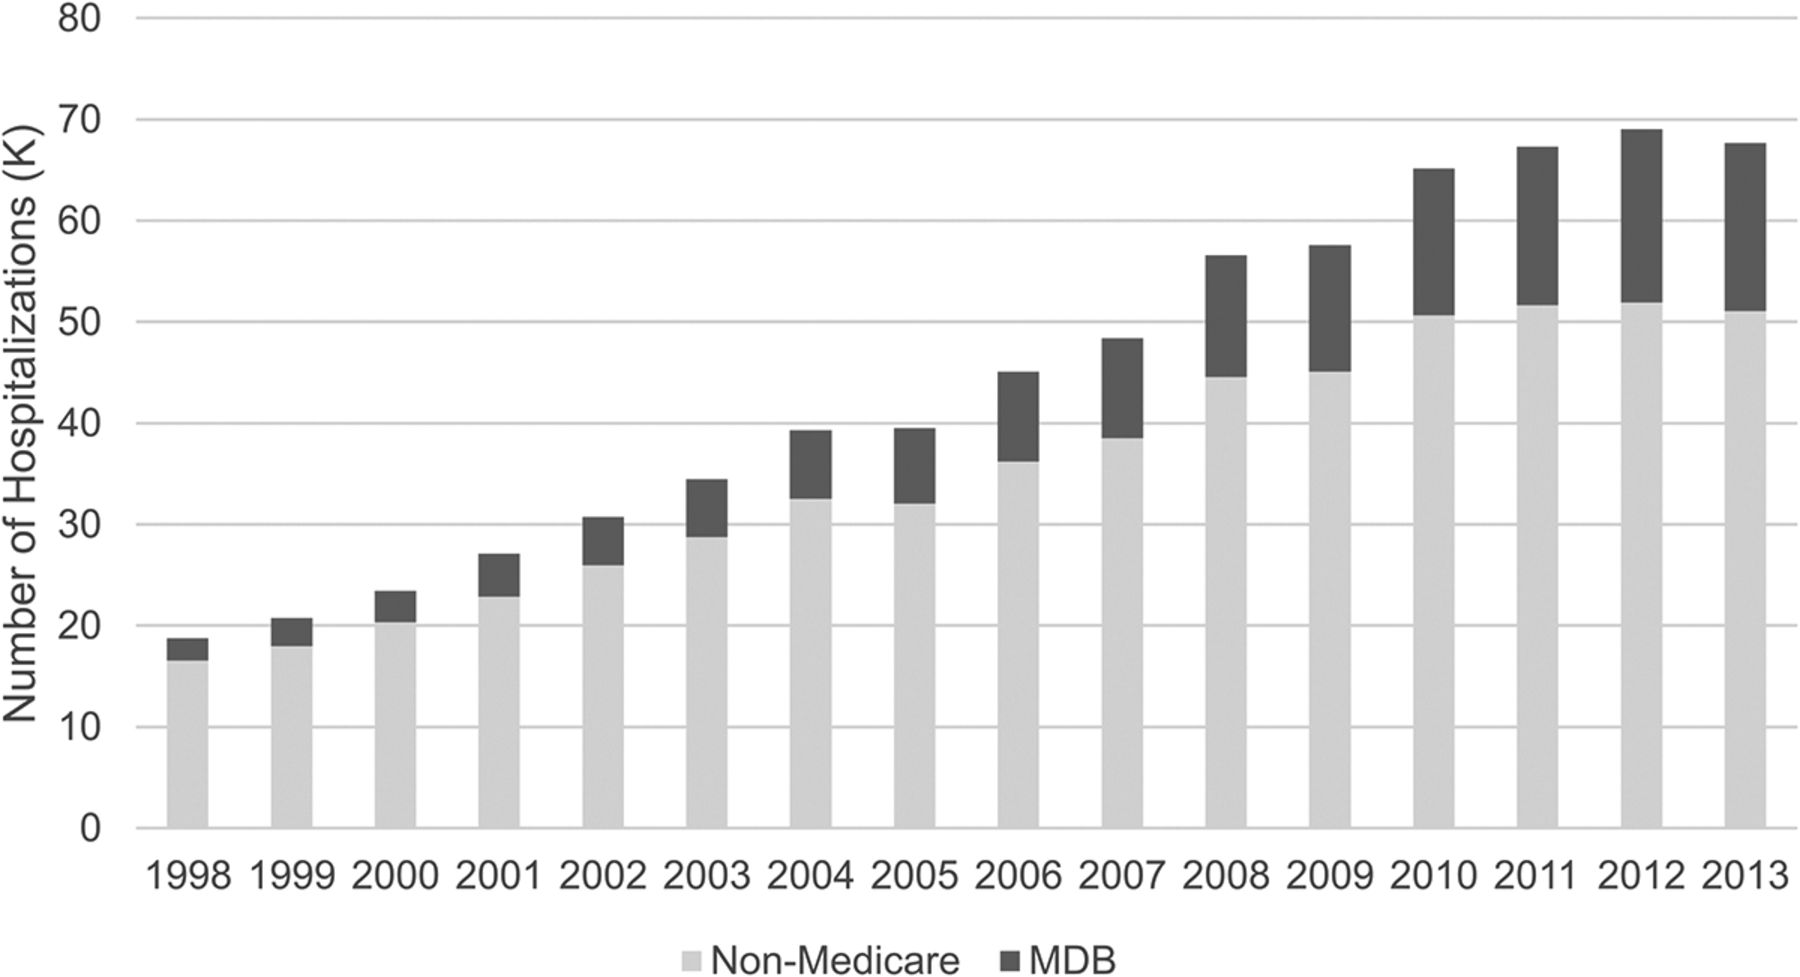
- Figure 1.
Opioid overdose hospitalizations among patients <65 years of age, by payer type (National Inpatient Sample, 1998 to 2013). MDB, Medicare-disability beneficiary.
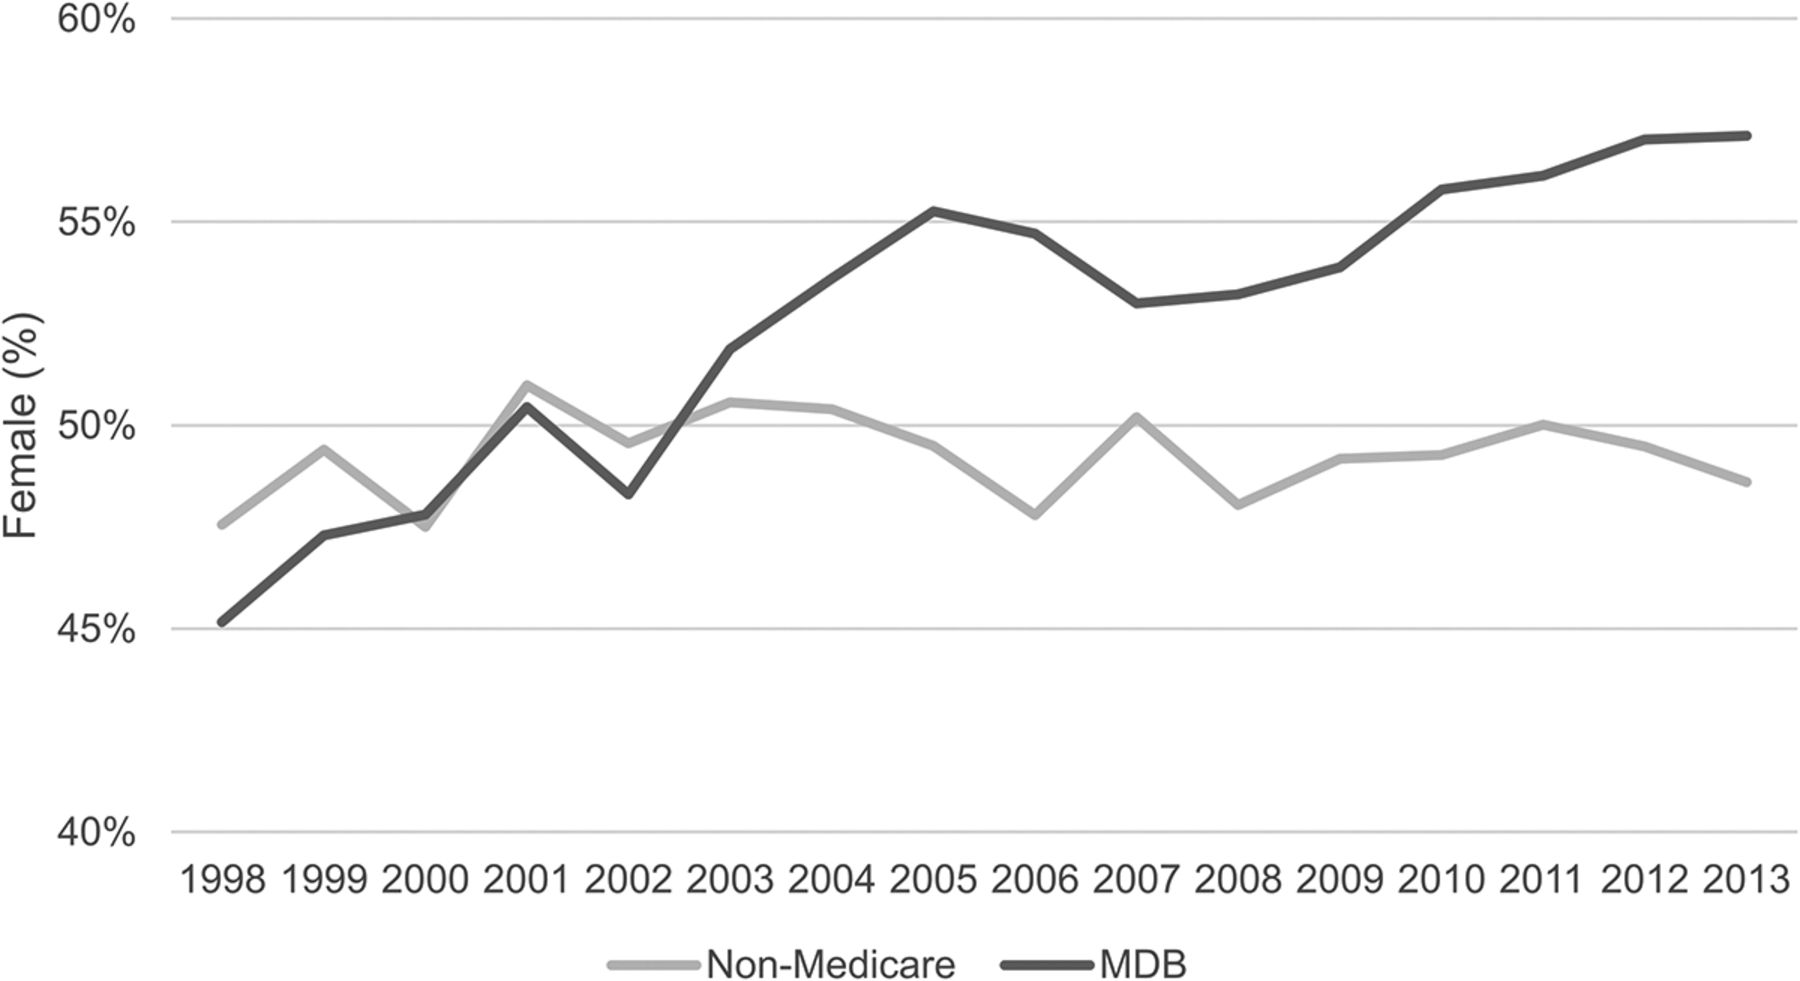
- Figure 2.
Opioid overdose hospitalizations: percentage of female patients among those <65 years of age, by payer type (National Inpatient Sample, 1998 to 2013). MDB, Medicare-disability beneficiary.
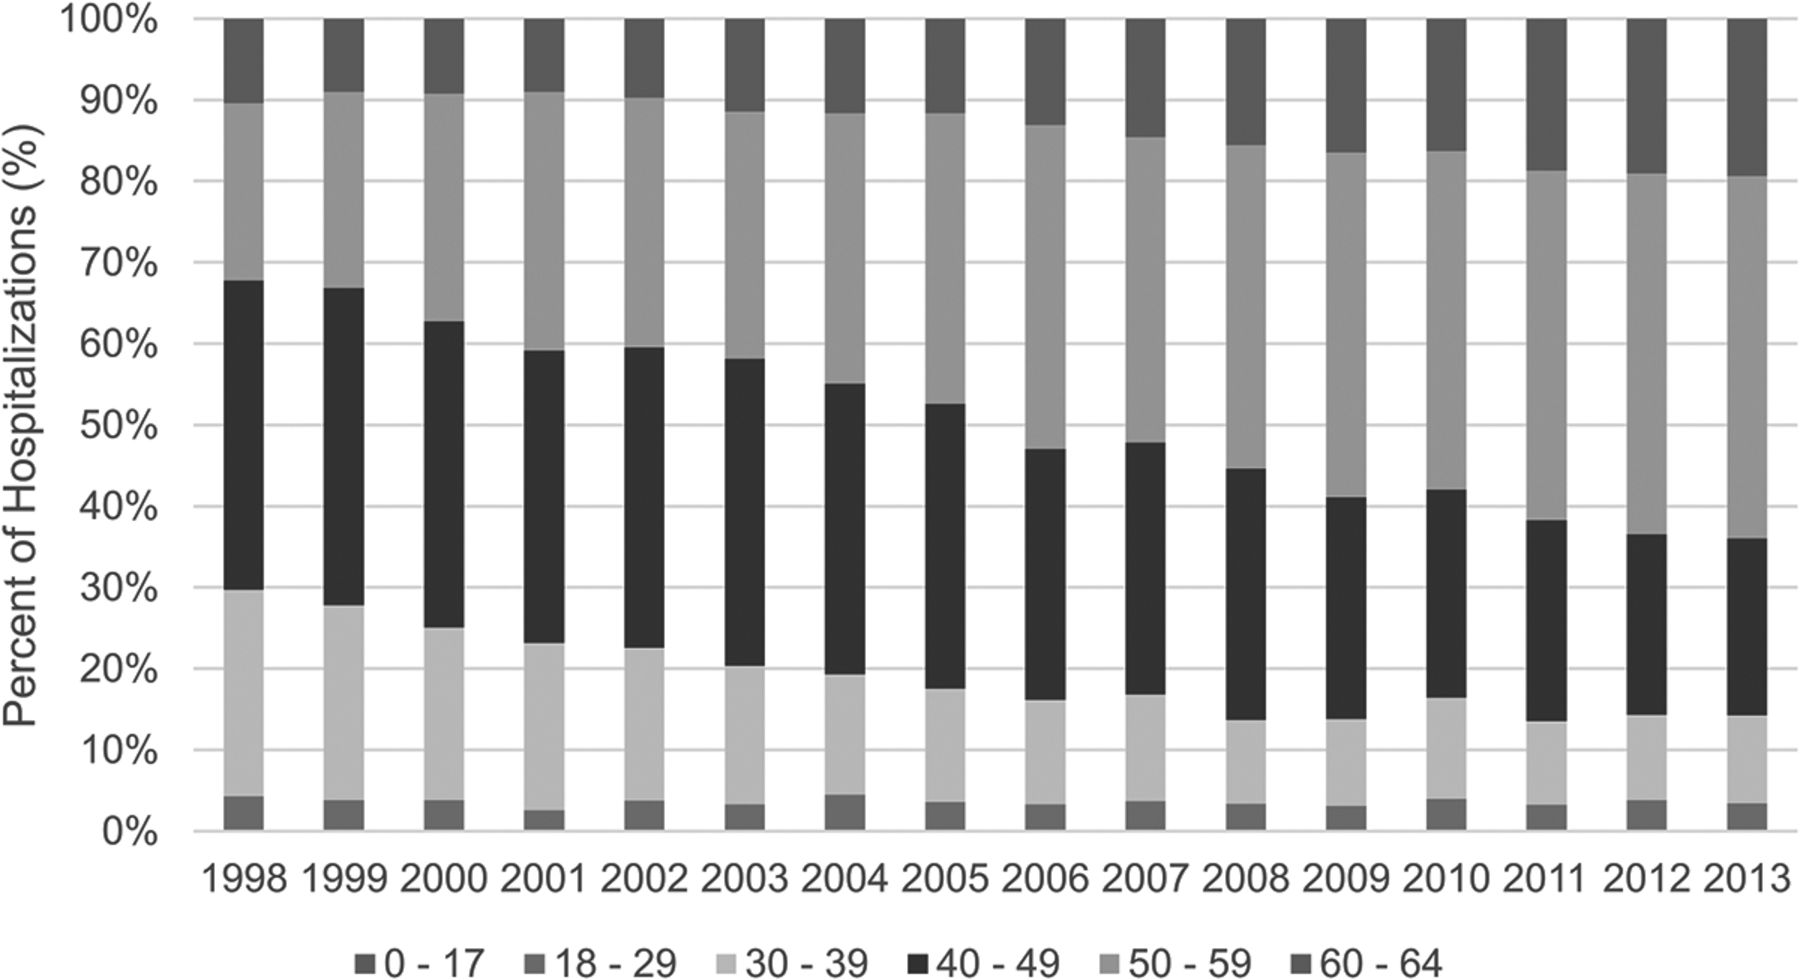
- Figure 3.
Opioid overdose hospitalizations: patient age among medicare-disability beneficiary (MDBs) (National Inpatient Sample, 1998 to 2013). The 0 to 17 age-group constitutes a very small proportion of the overall population and may not, therefore, be visible graphically.
- Figure 4.
Non-heroin opioid overdose (NHOD): percentage among those <65 years of age, by payer type (National Inpatient Sample, 1998 to 2013). MDB, Medicare-disability beneficiary.
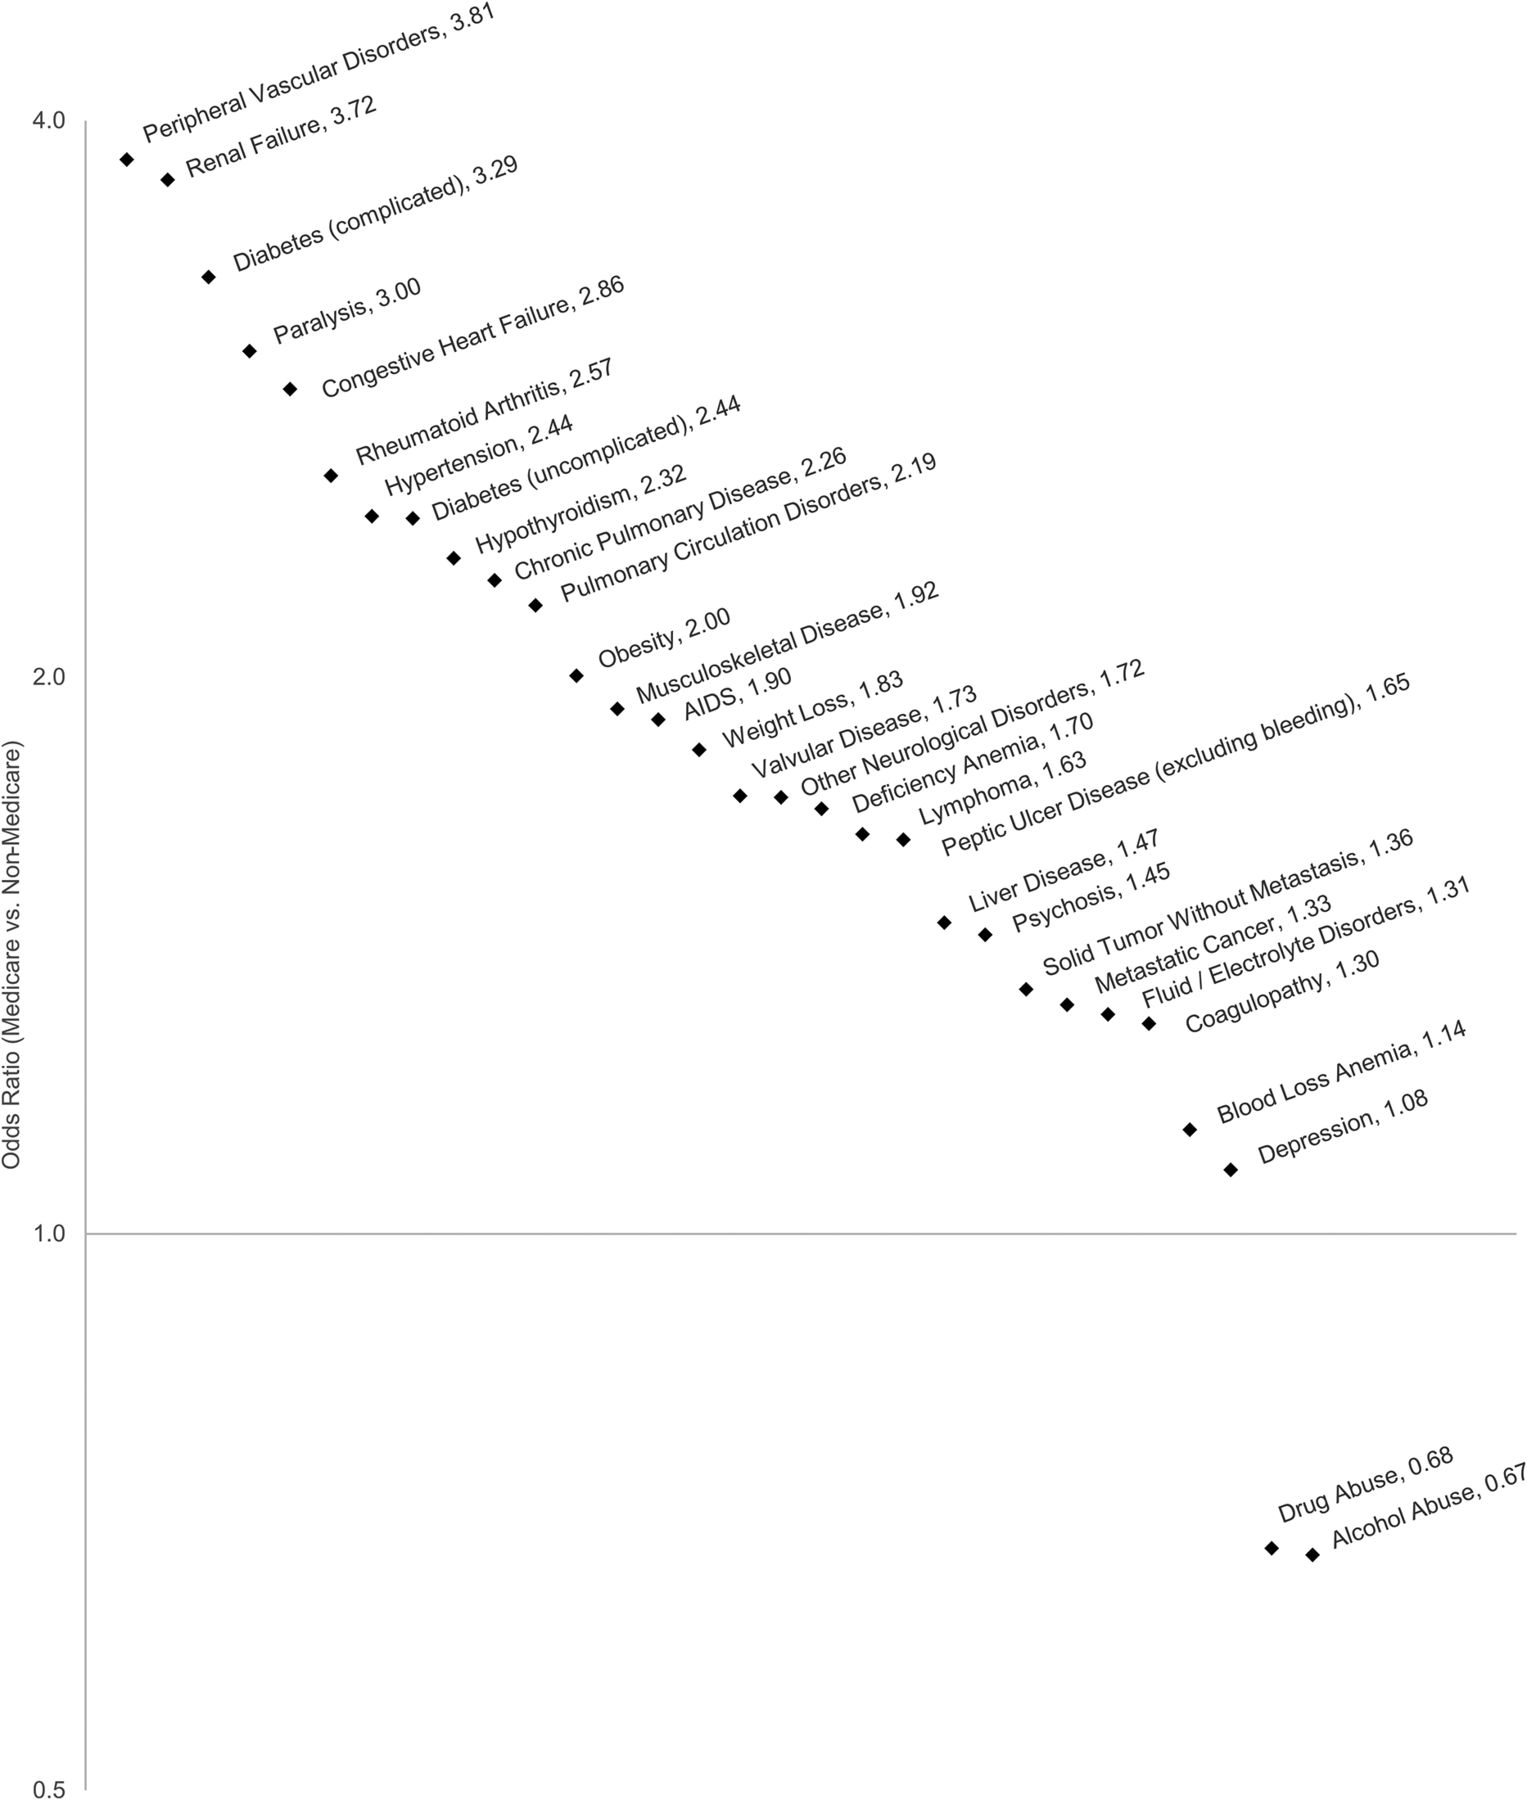
- Figure 5.
Odds ratios for comorbidities among those <65 years of age, by payer type (National Inpatient Sample, 1998 to 2013).
- Appendix Figure 1.
Incidence of Opioid Overdose Hospitalization by Age.
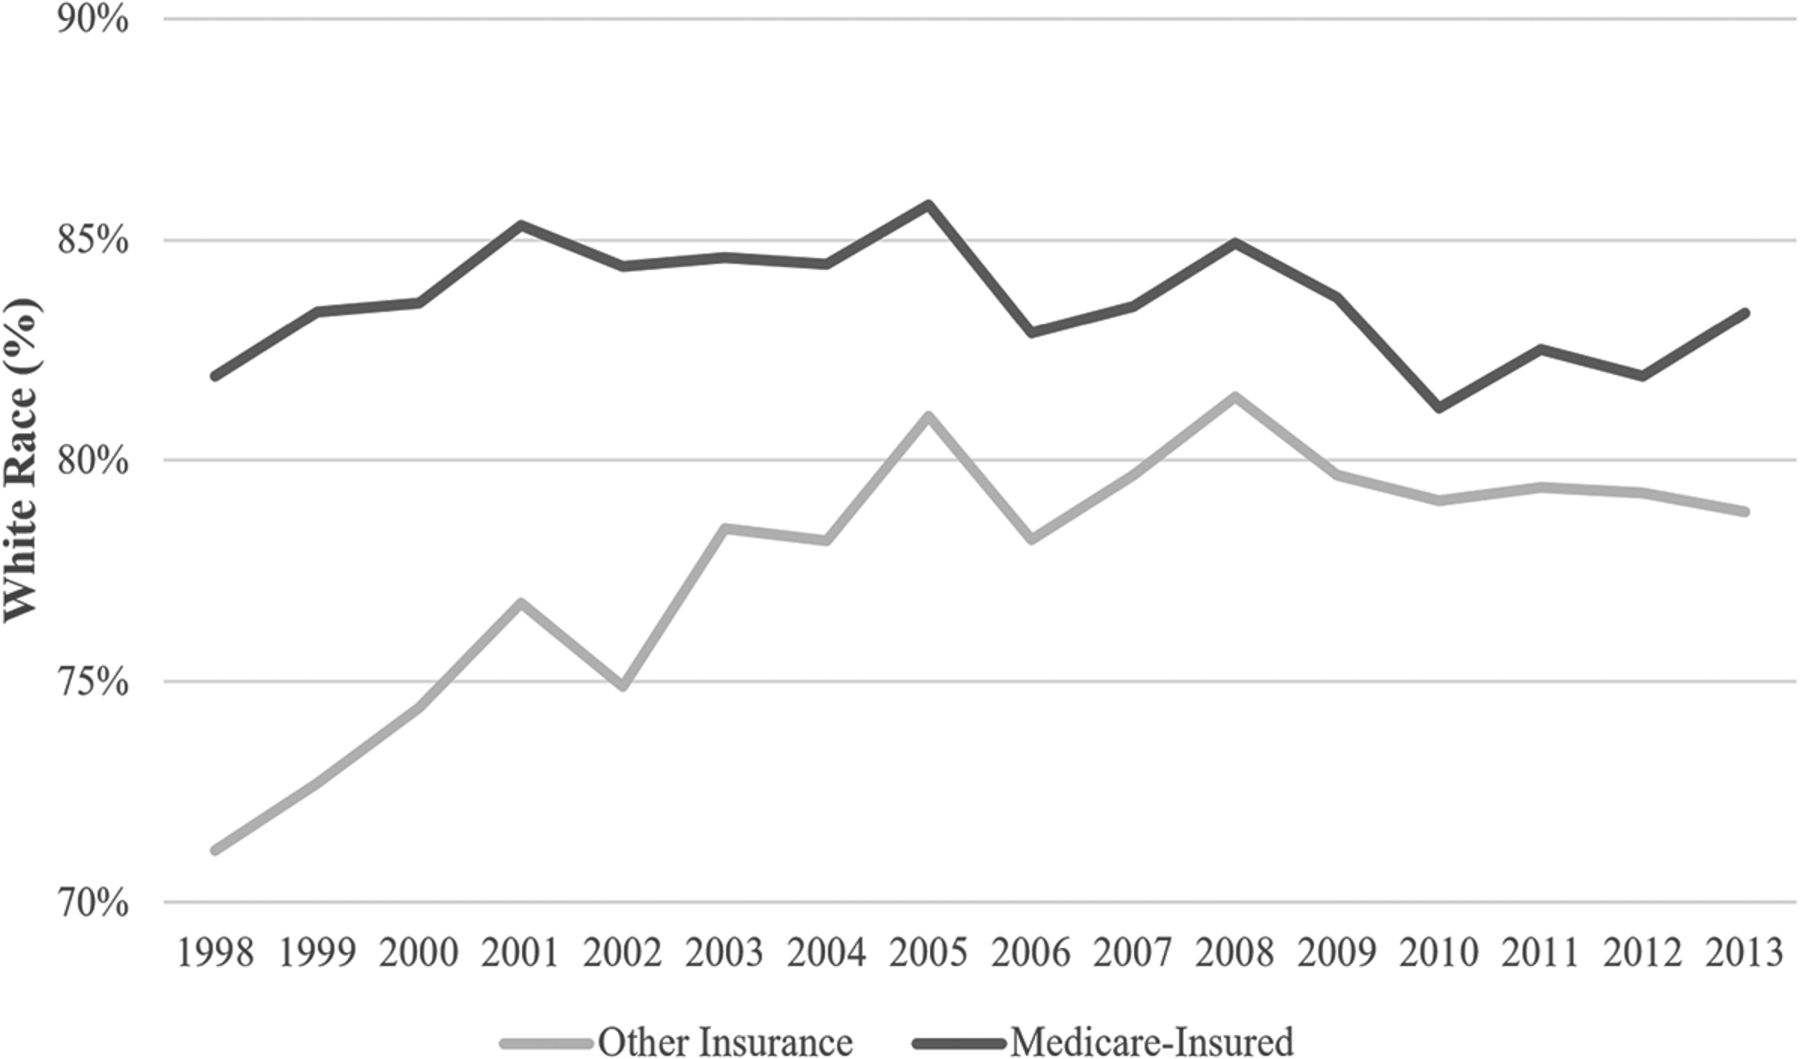
- Appendix Figure 2.
Opioid Overdose Hospitalizations: Percentage of White Patients Among Those <65 years of Age, by Payer Type.


Tables
Musculoskeletal Comorbidity 71600 71601 71602 71603 71604 71605 71606 71607 71608 71609 71610 71611 71612 71613 71614 71615 71616 71617 71618 71619 71620 71621 71622 71623 71624 71625 71626 71627 71628 71629 71630 71631 71632 71633 71634 71635 71636 71637 71638 71639 71640 71641 71642 71643 71644 71645 71646 71647 71648 71649 71650 71651 71652 71653 71654 71655 71656 71657 71658 71659 71660 71661 71662 71663 71664 71665 71666 71667 71668 71680 71681 71682 71683 71684 71685 71686 71687 71688 71689 71690 71691 71692 71693 71694 71695 71696 71697 71698 71699 71500 71504 71509 71510 71511 71512 71513 71514 71515 71516 71517 71518 71520 71521 71522 71523 71524 71525 71526 71527 71528 71530 71531 71532 71533 71534 71535 71536 71537 71538 71580 71589 71590 71591 71592 71593 71594 71595 71596 71597 71598 72400 72401 72402 72403 72409 7241 7242 7243 7244 7245 7246 72470 72471 72479 7248 7249 9050 9051 9052 9053 9054 9055 9056 9057 9058 9059 9060 9061 9062 9063 9064 9065 9066 9067 9068 9069 Prescription Opioid Overdose 96500 96502 96509 E8501 E8502 Heroin Overdose 96501 E8500 1998 1999 2000 2001 2002 2003 2004 2005 2006 2007 2008 2009 2010 2011 2012 2013 Population (million) 0–17 71.9 72.1 72.4 72.6 72.9 73.2 73.4 73.6 73.9 74.0 74.1 74.2 74.4 74.8 75.2 75.7 18–49 111.6 112.0 112.3 112.4 112.4 112.5 112.5 112.4 112.4 112.5 112.8 113.0 113.2 113.7 114.1 114.6 50–64 58.7 60.5 62.4 64.4 66.5 68.6 70.7 72.8 74.8 76.5 78.0 79.6 81.0 82.1 82.4 82.7 65–84 30.6 30.7 30.8 30.9 31.0 31.1 31.3 31.6 31.9 32.3 32.9 33.5 34.1 34.8 36.1 37.4 85+ 3.9 4.1 4.3 4.4 4.6 4.7 4.9 5.1 5.3 5.6 5.7 5.9 6.1 6.3 6.4 6.6 Age Group (Discharges) 0–17 1,066 1,210 1,322 1,162 1,327 1,545 1,659 1,720 1,437 1,532 1,719 1,718 2,324 1,644 1,980 1,695 18–49 12,576 13,875 15,110 16,892 18,385 20,098 22,373 21,563 23,852 25,349 28,707 28,302 32,056 33,262 33,195 32,115 50–64 5,211 5,810 7,103 9,147 11,114 12,998 15,327 16,263 19,914 21,619 26,345 27,813 31,091 32,678 34,100 34,035 65–84 2,050 2,148 2,132 2,820 3,120 3,571 4,362 4,630 5,528 6,263 7,540 7,315 8,808 9,868 10,570 10,535 85+ 309 370 330 331 477 540 498 668 687 717 940 868 1,009 1,250 1,185 1,190 Age Group (%) 0–17 5.0% 5.2% 5.1% 3.8% 3.9% 4.0% 3.8% 3.8% 2.8% 2.8% 2.6% 2.6% 3.1% 2.1% 2.4% 2.1% 18–49 59.3% 59.3% 58.1% 55.7% 53.4% 51.9% 50.6% 48.1% 46.4% 45.7% 44.0% 42.9% 42.6% 42.3% 41.0% 40.4% 50–64 24.6% 24.8% 27.3% 30.1% 32.3% 33.5% 34.7% 36.3% 38.7% 39.0% 40.4% 42.1% 41.3% 41.5% 42.1% 42.8% 65–84 9.7% 9.2% 8.2% 9.3% 9.1% 9.2% 9.9% 10.3% 10.8% 11.3% 11.6% 11.1% 11.7% 12.5% 13.0% 13.2% 85+ 1.5% 1.6% 1.3% 1.1% 1.4% 1.4% 1.1% 1.5% 1.3% 1.3% 1.4% 1.3% 1.3% 1.6% 1.5% 1.5% Age Group (Discharges per Million) 0–17 14.8 16.8 18.3 16.0 18.2 21.1 22.6 23.4 19.5 20.7 23.2 23.2 31.2 22.0 26.3 22.4 18–49 112.7 123.9 134.6 150.3 163.5 178.7 198.9 191.9 212.2 225.3 254.5 250.4 283.1 292.6 290.9 280.3 50–64 88.8 96.0 113.8 141.9 167.0 189.4 216.9 223.4 266.3 282.5 337.6 349.6 383.8 398.3 413.9 411.5 65–84 67.0 70.0 69.2 91.3 100.7 114.7 139.2 146.6 173.5 193.9 228.9 218.1 258.1 283.3 292.7 281.7 85+ 78.5 90.2 77.2 74.8 104.3 114.1 101.4 130.5 128.7 129.1 163.7 146.2 164.8 198.9 184.2 181.0 - Appendix Table 3.
Characteristics of Opioid Overdose Hospitalizations Among Patients <65 Years of Age
1998 1999 2000 2001 2002 2003 2004 2005 2006 2007 2008 2009 2010 2011 2012 2013 Payer Type (Discharges) Non-Medicare 16,565 17,981 20,317 22,846 25,953 28,751 32,522 32,049 36,232 38,513 44,542 45,071 50,672 51,664 51,905 51,070 Medicare 2,197 2,772 3,108 4,256 4,790 5,735 6,774 7,473 8,859 9,859 12,039 12,521 14,469 15,648 17,155 16,610 Payer Type (%) Non-Medicare 88.3% 86.6% 86.7% 84.3% 84.4% 83.4% 82.8% 81.1% 80.4% 79.6% 78.7% 78.3% 77.8% 76.8% 75.2% 75.5% Medicare 11.7% 13.4% 13.3% 15.7% 15.6% 16.6% 17.2% 18.9% 19.6% 20.4% 21.3% 21.7% 22.2% 23.2% 24.8% 24.5% Sex (Discharges) Non-Medicare Male 8,688 9,097 10,664 11,197 13,090 14,192 16,127 16,170 18,903 19,159 23,139 22,898 25,687 25,813 26,225 26,230 Female 7,877 8,883 9,649 11,649 12,859 14,520 16,386 15,846 17,302 19,311 21,398 22,154 24,945 25,836 25,680 24,810 Medicare Male 1,205 1,461 1,622 2,109 2,476 2,760 3,142 3,343 4,013 4,634 5,631 5,773 6,397 6,864 7,370 7,120 Female 993 1,311 1,486 2,147 2,314 2,975 3,632 4,129 4,847 5,225 6,408 6,748 8,073 8,784 9,780 9,485 Sex (%) Non-Medicare Male 52.4% 50.6% 52.5% 49.0% 50.4% 49.4% 49.6% 50.5% 52.2% 49.8% 52.0% 50.8% 50.7% 50.0% 50.5% 51.4% Female 47.6% 49.4% 47.5% 51.0% 49.6% 50.6% 50.4% 49.5% 47.8% 50.2% 48.0% 49.2% 49.3% 50.0% 49.5% 48.6% Medicare Male 54.8% 52.7% 52.2% 49.6% 51.7% 48.1% 46.4% 44.7% 45.3% 47.0% 46.8% 46.1% 44.2% 43.9% 43.0% 42.9% Female 45.2% 47.3% 47.8% 50.4% 48.3% 51.9% 53.6% 55.3% 54.7% 53.0% 53.2% 53.9% 55.8% 56.1% 57.0% 57.1% Age (Discharges) Non-Medicare 0–17 1,061 1,200 1,303 1,153 1,327 1,503 1,641 1,703 1,418 1,514 1,705 1,709 2,297 1,638 1,955 1,675 18–29 4,108 4,360 4,671 5,280 6,175 7,037 8,095 7,888 8,689 9,817 11,103 11,389 12,549 13,524 12,910 12,985 30–39 4,842 5,117 5,986 6,445 6,545 7,022 7,589 6,894 7,884 8,137 9,203 9,385 10,670 11,088 11,250 10,690 40–49 4,391 4,966 5,475 6,331 7,347 7,835 8,773 8,538 9,722 9,315 10,571 10,029 10,983 10,759 10,665 10,220 50–59 1,712 1,875 2,422 3,009 3,857 4,393 5,347 5,829 6,874 8,084 9,749 10,095 11,246 11,428 11,930 12,050 60–64 450 453 454 629 701 942 1,068 1,189 1,635 1,641 2,207 2,460 2,899 3,222 3,185 3,445 Medicare 0–17 * * * * * * * * * * * * * * * * 18–29 * 106 114 112 180 185 300 265 290 360 401 393 580 511 645 560 30–39 558 665 661 872 902 975 1,004 1,040 1,134 1,285 1,239 1,337 1,799 1,611 1,800 1,795 40–49 837 1,082 1,170 1,534 1,772 2,169 2,423 2,622 2,738 3,062 3,731 3,414 3,713 3,864 3,820 3,615 50–59 478 668 871 1,353 1,469 1,742 2,253 2,671 3,532 3,705 4,786 5,311 6,017 6,729 7,615 7,400 60–64 230 251 288 385 468 658 789 871 1,160 1,438 1,878 2,066 2,361 2,933 3,265 3,225 Age (%) Non-Medicare 0–17 6.4% 6.7% 6.4% 5.0% 5.1% 5.2% 5.0% 5.3% 3.9% 3.9% 3.8% 3.8% 4.5% 3.2% 3.8% 3.3% 18–29 24.8% 24.3% 23.0% 23.1% 23.8% 24.5% 24.9% 24.6% 24.0% 25.5% 24.9% 25.3% 24.8% 26.2% 24.9% 25.4% 30–39 29.2% 28.5% 29.5% 28.2% 25.2% 24.4% 23.3% 21.5% 21.8% 21.1% 20.7% 20.8% 21.1% 21.5% 21.7% 20.9% 40–49 26.5% 27.6% 27.0% 27.7% 28.3% 27.3% 27.0% 26.6% 26.8% 24.2% 23.7% 22.3% 21.7% 20.8% 20.6% 20.0% 50–59 10.3% 10.4% 11.9% 13.2% 14.9% 15.3% 16.4% 18.2% 19.0% 21.0% 21.9% 22.4% 22.2% 22.1% 23.0% 23.6% 60–64 2.7% 2.5% 2.2% 2.8% 2.7% 3.3% 3.3% 3.7% 4.5% 4.3% 5.0% 5.5% 5.7% 6.2% 6.1% 6.7% Medicare 0–17 * * * * * * * * * * * * * * * * 18–29 * 3.8% 3.7% 2.6% 3.8% 3.2% 4.4% 3.5% 3.3% 3.7% 3.3% 3.1% 4.0% 3.3% 3.8% 3.4% 30–39 25.4% 24.0% 21.3% 20.5% 18.8% 17.0% 14.8% 13.9% 12.8% 13.0% 10.3% 10.7% 12.4% 10.3% 10.5% 10.8% 40–49 38.1% 39.0% 37.6% 36.0% 37.0% 37.8% 35.8% 35.1% 30.9% 31.1% 31.0% 27.3% 25.7% 24.7% 22.3% 21.8% 50–59 21.8% 24.1% 28.0% 31.8% 30.7% 30.4% 33.3% 35.7% 39.9% 37.6% 39.8% 42.4% 41.6% 43.0% 44.4% 44.6% 60–64 10.4% 9.0% 9.3% 9.1% 9.8% 11.5% 11.7% 11.7% 13.1% 14.6% 15.6% 16.5% 16.3% 18.7% 19.0% 19.4% Race (Discharges) Non-Medicare White 9264 10324 11943 12984 14419 16821 18467 19306 20463 22099 28001 30882 34788 37041 38680 37670 Black 2046 2049 1909 1989 2378 2096 2350 1772 2426 2462 2603 3027 4158 3940 4270 4525 Hispanic 1258 1208 1657 1449 1667 1763 1886 1690 2274 2059 2153 2678 3256 3540 3800 3835 Asian or Pacific Islander * * 103 125 150 141 209 157 163 218 239 316 336 327 325 305 Native American * * * * * * 202 183 261 242 287 456 421 466 450 360 Other 307 464 387 297 588 569 503 726 576 654 1103 1408 1026 1334 1265 1090 Medicare White 1441 1939 2150 2785 3035 3650 4301 4908 5470 6171 8198 8959 10403 11839 13395 13060 Black 202 260 243 276 343 344 436 437 607 721 761 959 1367 1394 1585 1490 Hispanic 89 77 146 143 178 246 208 287 306 341 470 500 612 720 825 795 Asian or Pacific Islander * * * * * * * * * * * * * * * * Native American * * * * * * * * 119 * * * 161 118 145 * Other * * * * * * * * * * 176 161 218 224 340 145 Race (%) Non-Medicare White 71.2% 72.7% 74.4% 76.8% 74.9% 78.5% 78.2% 81.0% 78.2% 79.7% 81.4% 79.7% 79.1% 79.4% 79.3% 78.8% Black 15.7% 14.4% 11.9% 11.8% 12.4% 9.8% 10.0% 7.4% 9.3% 8.9% 7.6% 7.8% 9.5% 8.4% 8.8% 9.5% Hispanic 9.7% 8.5% 10.3% 8.6% 8.7% 8.2% 8.0% 7.1% 8.7% 7.4% 6.3% 6.9% 7.4% 7.6% 7.8% 8.0% Asian or Pacific Islander * * 0.6% 0.7% 0.8% 0.7% 0.9% 0.7% 0.6% 0.8% 0.7% 0.8% 0.8% 0.7% 0.7% 0.6% Native American * * * * * * 0.9% 0.8% 1.0% 0.9% 0.8% 1.2% 1.0% 1.0% 0.9% 0.8% Other 2.4% 3.3% 2.4% 1.8% 3.1% 2.7% 2.1% 3.0% 2.2% 2.4% 3.2% 3.6% 2.3% 2.9% 2.6% 2.3% Medicare White 81.9% 83.4% 83.6% 85.3% 84.4% 84.6% 84.4% 85.8% 82.9% 83.5% 84.9% 83.7% 81.2% 82.5% 81.9% 83.3% Black 11.5% 11.2% 9.5% 8.5% 9.5% 8.0% 8.6% 7.6% 9.2% 9.8% 7.9% 9.0% 10.7% 9.7% 9.7% 9.5% Hispanic 5.1% 3.3% 5.7% 4.4% 4.9% 5.7% 4.1% 5.0% 4.6% 4.6% 4.9% 4.7% 4.8% 5.0% 5.0% 5.1% Asian or Pacific Islander * * * * * * * * * * * * * * * * Native American * * * * * * * * 1.8% * * * 1.3% 0.8% 0.9% * Other * * * * * * * * * * 1.8% 1.5% 1.7% 1.6% 2.1% 0.9% Overdose Type (Discharges) Non-medicare Prescription Opioid Only 11476 12377 14957 18258 20472 23570 27655 27532 30111 33838 37542 38729 43937 44329 42500 39625 Both 203 208 183 222 269 265 171 218 298 258 338 339 478 562 545 630 Heroin Only 4886 5397 5177 4366 5212 4917 4696 4299 5823 4418 6662 6003 6256 6772 8860 10815 Medicare Prescription Opioid Only 1923 2385 2801 3932 4363 5382 6365 7126 8367 9455 11333 11968 13864 15091 16245 15600 Both * * * * * * * * * * * * * * * * Heroin Only 269 362 292 305 414 314 390 328 451 372 655 519 545 517 845 925 Overdose Type (%) Non-medicare Prescription Opioid Only 69.3% 68.8% 73.6% 79.9% 78.9% 82.0% 85.0% 85.9% 83.1% 87.9% 84.3% 85.9% 86.7% 85.8% 81.9% 77.6% Both 1.2% 1.2% 0.9% 1.0% 1.0% 0.9% 0.5% 0.7% 0.8% 0.7% 0.8% 0.8% 0.9% 1.1% 1.0% 1.2% Heroin Only 29.5% 30.0% 25.5% 19.1% 20.1% 17.1% 14.4% 13.4% 16.1% 11.5% 15.0% 13.3% 12.3% 13.1% 17.1% 21.2% Medicare Prescription Opioid Only 87.5% 86.0% 90.1% 92.4% 91.1% 93.8% 94.0% 95.4% 94.4% 95.9% 94.1% 95.6% 95.8% 96.4% 94.7% 93.9% Both ** * * * * * * * * * * * * * * * Heroin Only 12.3% 13.1% 9.4% 7.2% 8.6% 5.5% 5.8% 4.4% 5.1% 3.8% 5.4% 4.1% 3.8% 3.3% 4.9% 5.6% Comorbidity NMI MDB OR 95%CI p Hypertension 21.9 40.6 2.44 2.37 2.52 <.0001 Drug Abuse 46.3 36.8 0.68 0.66 0.70 <.0001 Fluid / Electrolyte Disorders 29.4 35.4 1.31 1.28 1.35 <.0001 Psychosis 22.9 30.1 1.45 1.41 1.50 <.0001 Chronic Pulmonary Disease 15.9 29.8 2.26 2.18 2.34 <.0001 Depression 23.6 25.1 1.08 1.05 1.12 <.0001 Other Neurological Disorders 15.6 24.1 1.72 1.66 1.78 <.0001 Musculoskeletal Disease 13.8 23.5 1.92 1.86 1.99 <.0001 Diabetes (uncomplicated) 7.5 16.6 2.44 2.34 2.54 <.0001 Deficiency Anemia 8.5 13.7 1.70 1.63 1.77 <.0001 Alcohol Abuse 18.9 13.5 0.67 0.64 0.70 <.0001 Obesity 5.7 10.8 2.00 1.91 2.10 <.0001 Hypothyroidism 4.2 9.2 2.32 2.20 2.45 <.0001 Renal Failure 2.4 8.5 3.72 3.50 3.95 <.0001 Congestive Heart Failure 2.9 7.8 2.86 2.70 3.04 <.0001 Liver Disease 5.1 7.3 1.47 1.39 1.56 <.0001 Diabetes (complicated) 1.7 5.5 3.29 3.06 3.54 <.0001 Coagulopathy 3.3 4.3 1.30 1.21 1.39 <.0001 Rheumatoid Arthritis 1.6 4.1 2.57 2.37 2.79 <.0001 Weight Loss 2.0 3.5 1.83 1.69 1.98 <.0001 Peripheral Vascular Disorders 0.8 3.1 3.81 3.45 4.21 <.0001 Paralysis 1.0 2.9 3.00 2.72 3.31 <.0001 Valvular Disease 1.2 2.1 1.73 1.56 1.91 <.0001 Pulmonary Circulation Disorders 0.8 1.7 2.19 1.94 2.46 <.0001 AIDS 0.7 1.3 1.90 1.64 2.19 <.0001 Metastatic Cancer 0.8 1.1 1.33 1.17 1.52 <.0001 Solid Tumor Without Metastasis 0.8 1.1 1.36 1.18 1.56 <.0001 Lymphoma 0.3 0.4 1.63 1.31 2.04 <.0001 Blood Loss Anemia 0.3 0.4 1.14 0.92 1.42 0.243 Peptic Ulcer Disease (excluding bleeding) 0.1 0.1 1.65 1.01 2.68 0.043 Note: MDB (Medicare-Disability Beneficiaries); NMI (Non-Medicare-Insured)


