
Abstract
Background: Presenting symptoms of multiple myeloma (MM) are vague and nonspecific. Early detection poses a diagnostic challenge in primary care. We assessed whether clinical and laboratory data could provide early clues to MM diagnosis and whether time to detection affects survival.
Methods: A retrospective population-based study, including 110 men and women diagnosed with MM between 2002 and 2011, and matched cancer-free controls presenting with back pain. Clinical and laboratory data were extracted from medical records for the 2-year period prior to diagnosis of MM/back pain complaint.
Results: During the two years prior to diagnosis 64 (58%) of MM patients complained of back pain, and 37 (34%) suffered from fatigue or weight loss. Case-control comparisons did not reveal any significant differences in the number of pain complaints or infections in the two-year prediagnostic period. However, fatigue or weight loss, anemia, elevated ESR and creatinine (p < 0.001 for all) occurred more frequently in MM patients than controls and were confirmed as independent predictors in multivariated analysis. TTD did not impact stage at diagnosis, survival, or mortality.
Conclusions: Back pain accompanied by fatigue, weight loss or abnormal lab results should raise a “red flag” warning of MM. Nonetheless, we did not find evidence that TTD influences the initial stage or the prognosis of MM.
- Anemia
- Back Pain
- Creatinine
- Early Detection of Cancer
- Electronic Health Records
- Health Maintenance Organizations
- Multiple Myeloma
- Primary Health Care
- Prognosis
- Retrospective Studies
- Weight Loss
Multiple myeloma (MM) is the second most common hematologic malignancy in adults and represents 10% to 20% of all hematologic malignancies.1 The median age at diagnosis is 64 years, and the incidence increases with age. Thus, MM prevalence is expected to rise in Western countries as a result of the aging population.1 MM is a malignancy of plasma cells that accumulate in the bone marrow, usually secrete large amounts of paraprotein, and cause local destruction of the bones. Other features of MM include anemia, kidney failure, hypercalcemia, and immunodeficiency with recurrent infections. These complications may be life- or organ- threatening and may be irreversible, particularly renal failure. The disease is currently considered to progress in most cases from monoclonal gammopathy of undetermined significance (MGUS),2 a premalignant plasma cell dyscrasia characterized by the presence of paraprotein in the blood though less than 10% plasma cells in the bone marrow and no target organ failure.3 The progression of MGUS to MM varies depending on the type and amount of paraprotein in the blood; the average rate of transformation is 1% yearly.3
The diagnosis of MM is based on the presence of at least 10% clonal plasma cells in the bone marrow or the presence of a biopsy-proven soft-tissue plasmacytoma, with the presence of any of the following myeloma-defining events: hypercalcemia, renal failure, anemia, or bone disease.4 The severity of MM correlates with plasma cell mass and may be graded using the Durie-Salmon staging system (DSS), which considers the degree of anemia and hypercalcemia, the extent of bone disease, and the amount of the paraprotein.5 Patients with MM and a lower DSS stage experience longer survival than patients with a high DSS score.5 The International Staging System (ISS), a newer staging system based on β2 microglobulin and albumin serum concentrations, was also shown to classify patients into low- and high-risk groups.6 Thus it may be surmised that early diagnosis—when the DSS or ISS stage is low—would improve survival. Previous studies have shown that for patients with low-risk MGUS, there is no survival advantage for close follow-up to diagnose progression at an early stage.7 However, a recent study suggested that initiating treatment at a preclinical stage (“smoldering” MM) may improve survival.8
In this study we describe the clinical and laboratory characteristics of patients with MM during the 2 years before their diagnosis and compare them with controls with back pain who did not develop myeloma or cancer within the 2-year follow-up. We sought to identify “red flags” that should alarm physicians that MM is the cause of the symptoms and signs. We further evaluated the effect of time to diagnosis (TTD; the time from the first signs and symptoms of myeloma to the time of diagnosis) on the stage of the disease at diagnosis and on the survival of patients with MM. We also investigated whether age at diagnosis had an impact on TTD. We hypothesized that patients with MM (ie, those with biopsy-proven clonal plasmacytosis and any myeloma-defining event necessitating treatment) would have poorer survival when the diagnosis is delayed.
Methods
Patients and Controls
We included in the study all patients with MM who were insured in one of the Israeli health maintenance organizations (HMOs) between the years 2002 to 2011. By law, all Israelis are covered by health insurance but can choose to receive their care from 1 of 4 providers. To confirm the diagnosis, the cases were linked with the Israel National Cancer Registry (Israeli Ministry of Health). Controls were individuals with a complaint of back pain who were matched to cases by age, sex, area of residence, and date of appointment at the medical clinic that was closest to the date of diagnosis of MM in the matched case. We chose back pain as a control condition since it is one of the most common complaints in primary care, and vigilance is required on the part of the primary care physician to distinguish benign, self-limiting, or chronic back pain of musculoskeletal origin from back pain caused by malignancy.9 Controls with any malignancy were excluded.
Data Extraction
We collected clinical data for the patients and controls from the period of 2 years before the diagnosis of MM or the back pain complaint, respectively, from the patients' electronic medical records and the computerized database of the HMOs. The data included the number of requests for medical assistance and the reason for the medical request (main complaint), as well as blood tests that were done. The “main complaint” represents a summary of the cause for the visit as interpreted by the treating physician. We extracted any of the following main complaints as potential symptoms or signs of MM based on previous descriptions of signs and symptoms at MM presentation10: complaint of pain, infection, weight loss, fatigue, peripheral edema, constipation, presyncope, syncope, dizziness. Pain complaints were further categorized into back pain, cervical spine pain, musculoskeletal pain, or nonspecific pain. The date of any of these complaints was recorded. Other main complaints were not considered suggestive symptoms or signs of MM and were not extracted. We defined an abnormal blood test that may hint at the presence of MM as a result that deviates from the normal cutoff in the local laboratory of the HMO. Thus a pathologic laboratory test included any 1 of the following: anemia (hemoglobin <12.3 g/dL for women and <13.5 g/dL for men), hypercalcemia (calcium >10.2 mg/dL), elevated erythrocyte sedimentation rate (ESR) (>20 in the first hour), hypoalbuminemia (albumin <3.4 g/dL), high total protein concentration (>8.7 g/dL), renal failure (serum creatinine >1.1 mg/dL for women and >1.2 mg/dL for men), proteinuria (>10 mg/dL), or hyperuricemia (uric acid >5.7 mg/dL).
For the MM cases we also documented the date of diagnosis and the stage of MM according to the DSS5 and ISS6 at diagnosis.
TTD was calculated as the duration from the time of the first “combination” of symptoms and laboratory results to the actual time of diagnosis (Figure 1). A combination included either an abnormal laboratory test plus a clinic visit for a symptom(s) suggestive of MM within a 1-month period, or 2 pathologic blood tests within a 1-month period, or 2 clinic visits for the above-mentioned signs or symptoms suggestive of MM within 1 to 3 months. We used the combination strategy to better define TTD, since 1 MM-related main complaint or 1 deviation of a blood test result from the normal range may be a chance and not alarm the physician that MM may be present.
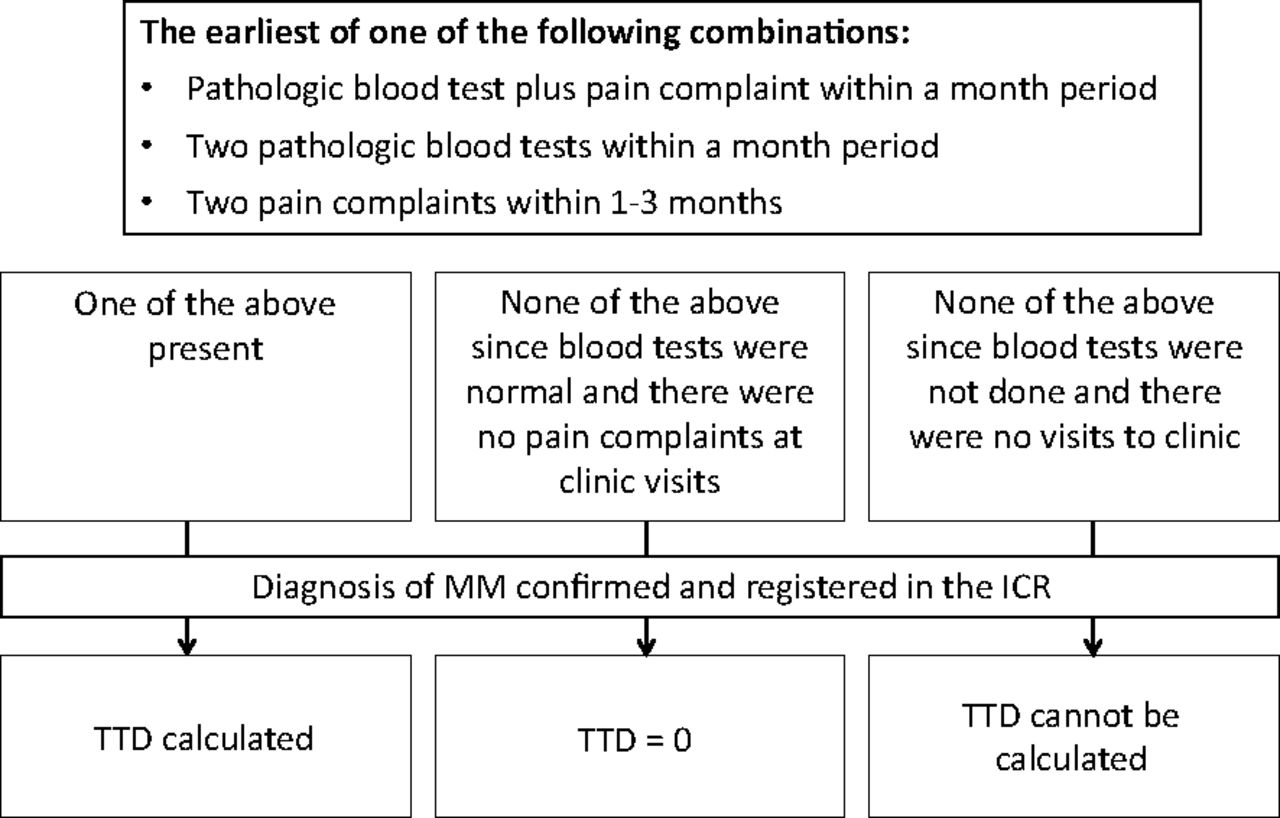
Flow chart for the calculation of time to diagnosis (TTD). ICR, Israel cancer registry; MM, multiple myeloma.
The TTD was categorized into 3 groups: <2 months, 2 to 12 months, and >12 months. There is no consensus in the literature on the length of time to describe TTD.11 We chose these time points because they correspond to time points previously used to describe diagnostic delay.12,13
Statistical Analysis
We report mean values and standard deviations for continuous variables and percentages for categorical values. Patient and control characteristics were compared using the paired t test and the McNemar test.
We used the Kruskal-Wallis test and Fisher exact test to examine the effect of TTD on the stage of MM at diagnosis, and the Mann-Whitney and Pearson log rank tests to examine the effect of TTD on survival. Overall survival was measured from the date at diagnosis to the date of death or was censored at last follow-up. We constructed Kaplan-Meier survival curves to demonstrate survival according to TTD.
A study comparing 79 cases and controls had a 90% power to detect a difference of 25% in the frequency of a parameter (eg, anemia) between cases and controls given an α level of 0.05. The sample size including all cases (n = 110) was used for the time-to-event analysis.
A multivariable logistic regression analysis was performed to determine independent predictors of MM status, including factors that were significantly associated with MM diagnosis in the univariate analysis. This was done using both the matched analysis (79 cases and controls) and the entire pool of cases.
Statistical analysis was performed using SPSS Statistics for Windows, version 20.0 (IBM, Armonk, NY). For all hypotheses tested, a 2-sided P value ≤.05 was considered statistically significant.
Ethics
The study was approved by the Helsinkin Committee institutional review board of the Hadassah Medical Organization and by the Leumit HMO, which granted a waiver of individual informed consent for access to electronic medical records.
Results
Patient Characteristics
A total of 110 patients were included, of whom 58 (53%) were males; the median age at diagnosis was 63 years (range, 34–88 years). MM was diagnosed in 103 patients, and 7 had plasmacytoma. Of the 110 patients, 14 were followed for MGUS. The DSS stage could be calculated in 95 patients; however, because detailed data regarding imaging status were missing, there is a possibility of misclassification and down-staging because of a lack of information on bone lesions. Sixty-seven patients (71%) were in DSS stage I, 18 (19%) were in stage II, and 10 (10%) in stage III (Table 1). The ISS could be calculated in 43 patients, of whom 28 (65%) were in stage I, 11 (26%) were in stage II, and 4 (9%) were in stage III (Table 1).
Durie-Salmon Stage, International Staging System Stage, and Survival Status According to Time to Diagnosis in Multiple Myeloma Cases
Symptoms, Signs, and Laboratory Results in the 2-Year Period before Diagnosis
Table 2 summarizes the distribution of patient complaints. Of the 110 patients, 96 (87%) had at least 1 pain complaint in the 2 years before the diagnosis of MM. Back and musculoskeletal pain were more common than other complaints, with a mean number of clinic visits of 3 and 2.6, respectively, for these. More than half of the patients had at least 1 infectious episode in the 2 years before the diagnosis of MM. Weight loss and fatigue were present in 9% and 25%, respectively. We included all other relevant complaints, including peripheral edema, constipation, presyncope, syncope, and dizziness, in 1 group named “Others.” These “other” complaints were found in 33% of patients.
Chief Complaint among 110 Cases with Multiple Myeloma, within the 2 Years before Diagnosis
All patients had at least 1 blood test done in the 2 years before the diagnosis of MM (Table 3). Creatinine was elevated in 26 of the 92 patients (28%) who did the test. Anemia was found in 68 of the 100 patients (68%) who had a complete blood count done, and elevated ESR was found in 56 of the 68 patients (82%) who did the test. Other laboratory parameters are detailed in Table 3.
Abnormal Blood Tests in the 2-Year Period before the Diagnosis of Multiple Myeloma among 110 Cases
During the 24 months before diagnosis, extreme abnormalities in laboratory parameters were detected among the patients: hemoglobin concentration was <10 g/dL in 28 patients (29%), creatinine was >2 mg/dL in 6 patients (6%), and calcium was >10.1 mg/dL in 21 patients (22%).
Comparison of Patients and Controls
Of the 110 patients, 79 were matched to 79 controls; these groups had a median age of 62 and 59 years, respectively.
The frequency and number of visits per complaint for various pain complaints were the same among patients and paired controls (Table 4). This was also true for infections. However, nonspecific nonpain complaints such as weight loss, fatigue, abnormal tests (specifically anemia), elevated ESR, renal failure, proteinuria, hypercalcemia, and high total protein were all more common in patients than controls (Table 4). Using backward stepwise regression, 3 variables independently predicted MM status in the matched analysis: symptoms including weight loss or fatigue (odds ratio [OR], 2.96; 95% confidence interval [CI], 1.24–7.04), presence of anemia (OR, 3.19; 95% CI, 1.39–7.28), and presence of any abnormal laboratory values (those listed in Table 3) (OR, 7.35; 95% CI, 1.52–35.25). These predictors were strengthened in the unmatched analysis that took into account all cases.
Comparison of Clinical Features of 79 Multiple Myeloma Cases and 79 Age-, Sex-, and Regionally Matched Controls
TTD and Disease Stage
There were sufficient data to calculate TTD for 107 of the 110 patients. The mean TTD was 10.9 ± 8.8 months and the median was 11.2 months. In 30 patients (27%) the TTD was <2 months, in 28 (25%) the TTD was 2 to 12 months, and for the rest (49 patients, 45%) the TTD was ≥12 months.
The mean TTD tended to be longer in patients with a higher DSS stage, though this was not significant (P = .45; Table 1). Even when categorizing TTD into 3 groups, it had no influence on the stage of disease at diagnosis (P = .7; Table 1).
TTD and Survival
At a mean follow-up of 4.5 years, 30 patients (27.3%) died and 9 (8.2%) were lost to follow-up. The mean TTD tended to be longer for the patients who died (12.4 ± 8.5 months) compared with those who survived (11.1 ± 8.8 months), though this difference was not significant (P = .5; Table 1). Even when categorizing TTD into 3 groups, the TTD had no influence on survival status (P = .6; Table 1). The Kaplan-Meier curve shown in Figure 2 demonstrates that survival was not influenced by the length of TTD (3 categories; P = .83, log rank).
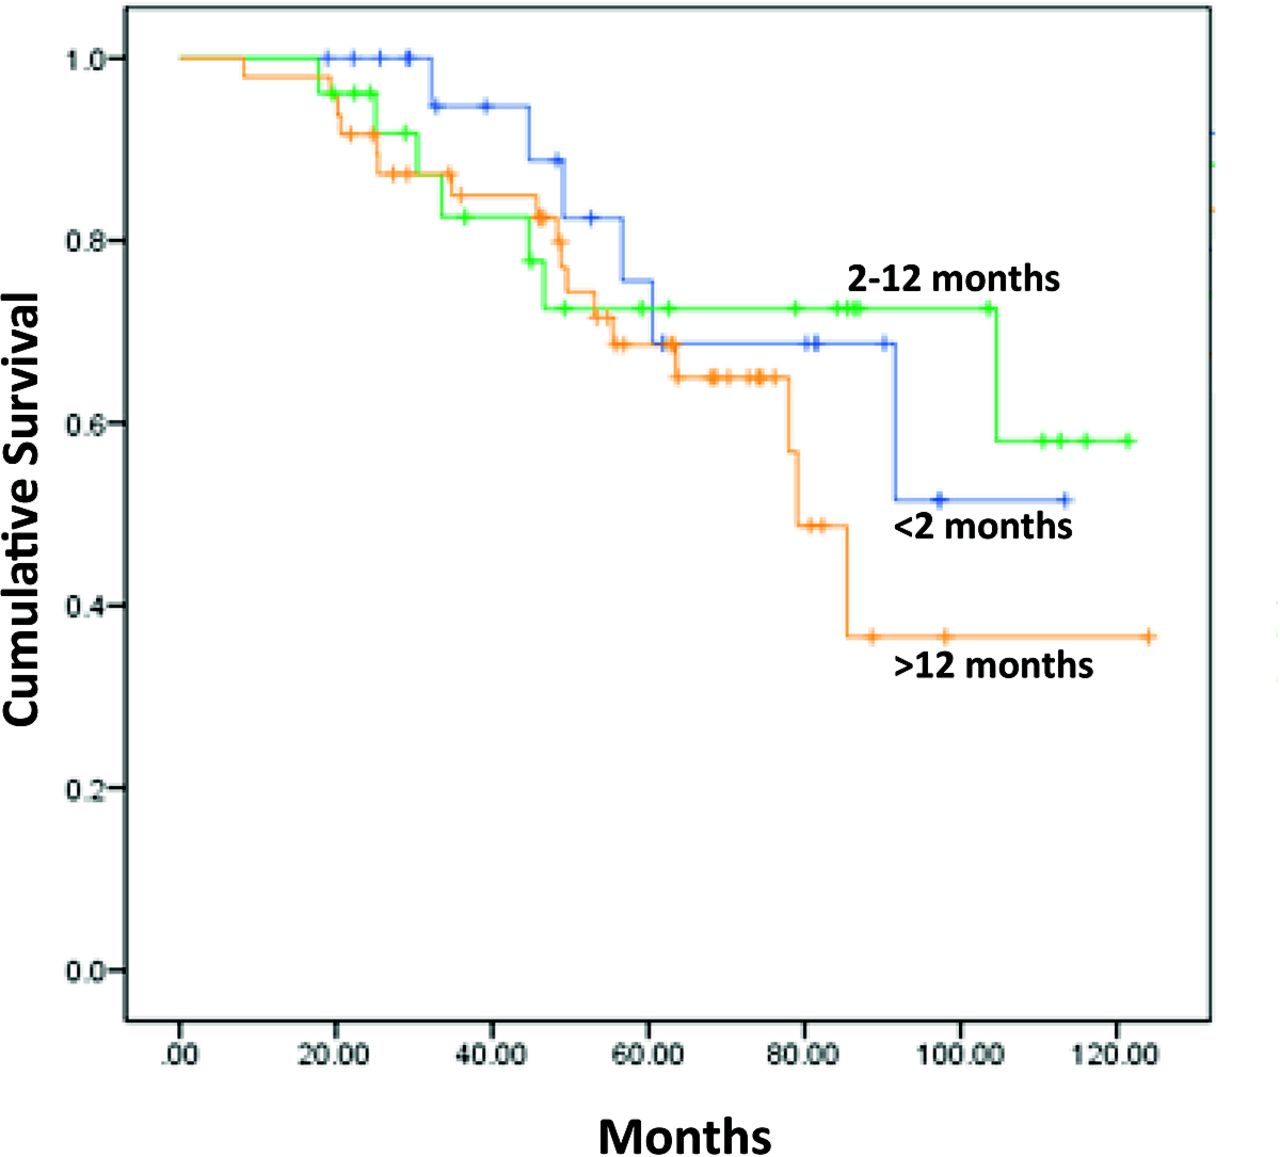
Overall survival according to time to diagnosis.
TTD and Age
TTD was significantly longer in older patients (P = .04; Table 5). The mean age at diagnosis was 60.1 ± 11.9 for patients with TTD <2 months, 63 ± 8.6 for patients with TTD of 2 to 12 months, and 66.3 ± 10.3 for patients with TTD >12 months.
Time to Diagnosis and Age
Discussion
When we look at the “ecology of medical care”14 we understand that primary physicians are the ones who see the most patients and that physicians treating specific malignancies such as MM are the last to see the patient. Back pain is the second most common complaint (after upper respiratory infection) in the primary care setting.9 However, only 0.7% of patients who present with back pain have a malignant cause.15 In an individual clinical practice, the average primary care physician may see fewer than 10 patients with MM throughout their career. Despite the rarity of MM, many times when a diagnosis of MM is established, a question comes up: “Why was it not recognized earlier?” However, there is a paucity of data regarding the clinical scenarios in which MM should be suspected and whether diagnostic delay indeed has an impact on outcome.16,17 This study aims to answer these questions using HMO outpatient data recorded prospectively in an electronic medical record. The availability of these data permit the performance of a community-based study that is free of the referral biases usually present in hospital-based research.16,17
We found that back pain is, as suspected, the most common complaint in the 2 years before a diagnosis of MM, comprising 58% of complaints. Expecting this, we designed our study to include controls with at least 1 back pain complaint to identify alarming signs that could differentiate nonmalignant back pain from back pain related to MM. We did not show that the number of visits for back pain or the presence/frequency of other pain complaints differed among patients and controls (Table 4). Thus, in our group of patients, the presence of pain and how often it brings the patient for medical care is not a red flag. Note that we could not extract from the files details of the type of pain, which was previously shown to help differentiate malignancy-related from nonmalignant pain.9 For example, pain that is not relieved by bed rest is more commonly related to back pain associated with cancer.9
We were able show in a multivariate analysis that accompanying nonpain complaints, such as weight loss and fatigue, could serve as alarms since they were significantly more common in patients than controls (Table 4). However, only 25% of our patients had these symptoms at presentation, which makes it more difficult to identify the patients with MM-related back pain based on this.
Abnormal blood tests were common among our patients, including an elevated ESR and anemia. This was previously described.18 Most abnormal tests (excluding hypoalbuminemia and hyperuricemia) were found to be more common in patients with MM-related back pain than in controls (P < .05; Table 4), and on multivariable analysis both anemia and any abnormal laboratory test predicted that the back pain is related to MM and can serve as an important marker to define high-risk back pain.
We did not have information on the free light chain serum concentrations in our study subjects. The availability of the free light chain assay, which is positive in 90% to 100% of patients with myeloma,19 may facilitate the differentiation of unexplained back pain stemming from MM or other causes. Thus some guidelines for the diagnosis of MM include routine testing of serum free light chains.20
About half of our patients had a viral or bacterial infection recorded in the 2 years before the diagnosis of MM, but this did not differ significantly from that recorded in controls. Patients with myeloma are reported to have 0.5 to 1.5 infections per year,21 quite close to the numbers in our patients.
Overall, our patients had fewer abnormalities in their laboratory results compared with the data published by Kyle et al.22 This may be related to the fact that our patients were diagnosed at earlier stages of disease than previously described: 71% had DSS stage I disease, where in other studies stage I disease was found at diagnosis in only 40%.23 We acknowledge that our data are limited since we are missing data on the bone disease in up to 50% of our patients with DSS stage I disease. This may explain the higher percentage of patients in stage I. However, when we staged our patients according to the ISS (47 patients), 65% were found to be in stage I (compared with 23–29% in previous studies6,24), confirming that our patients indeed presented at a lower stage. Moreover, even if some of the patient at stage I were up-staged to stage II or III based on imaging data, this would only lower the TTD in the stage II and III patients (since stage I had mildly lower TTD) and supports our findings that patients with an advanced stage at diagnosis did not have a longer TTD. The more modest deviations from normal laboratory results at diagnosis may also be related to the fact that our patients were diagnosed in an ambulatory system, whereas in the article by Kyle et al the patients were referred to a tertiary center and may have been sicker.
In about half of our patients, the TTD was longer than 11 months. This was longer than expected from the literature, where in up to 40% of patients there were only 3 to 6 months of delay.16,17 Friese et al17 defined the study period as from 1 year before the diagnosis. We collected data from the files for 2 years before the diagnosis, and this may prolong the TTD, since even nonspecific back pain 2 years before the diagnosis was considered as a relevant event used to calculate TTD. To minimize this deviation, we calculated the TTD from a combination of clinical and/or laboratory signs of myeloma and not from a single event (Figure 1).
TTD was not associated with the stage of disease in our patient population. This was somewhat unexpected because it was previously suggested that delayed diagnosis results in a higher frequency of target organ damage, such as renal failure or bone disease.16 It was also shown that delayed diagnosis worsened progression free survival (PFS) but not overall survival (OS).16 In our study TTD did not affect overall survival (Figure 2). This may result from the fact that our study was done in the era of autologous bone transplantation and novel agents for treating MM, enabling multiple lines of therapy and improving overall survival. It may also be the result of our small sample size, which limited the power to detect survival differences: the likelihood of a type II (β) error to detect a statistically significant difference in survival between the group with TTD <2 months (24 patients) and the group with TTD >12 months (48 patients) is 40% (only 60% power).
We found that TTD was longer in the elderly. This may have resulted from the fact that geriatric patients tend to have multiple comorbidities, and thus complaints of pain and fatigue, as well as laboratory abnormalities, might be attributed to previously diagnosed illnesses and not to a new disease. Indeed, it was previously shown that geriatricians minimize their referrals for a malignancy workup.25
Conclusion
In this study we were able to identify red flags that may lead physicians to an early diagnosis of MM: back pain combined with other systemic symptoms such as fatigue and weight loss, or back pain combined with abnormal blood tests. However, we could not show a relationship between TTD and the stage of disease at diagnosis or the outcome. Given the changing clinical course of MM, recommendations for early treatment of smoldering myeloma,8 and calls for “screening” using free light chain levels, it is important to repeat this study in larger populations and in other clinical settings to determine whether there is justification for a policy recommending early detection of MM.
Notes
This article was externally peer reviewed.
Funding: This work was supported by the Israel Society of Hematology and Blood Transfusion.
Conflict of interest: none declared.
This work was completed as an MD thesis at the Faculty of Medicine at the Hebrew University for LZ.
- Received for publication December 18, 2015.
- Revision received June 27, 2016.
- Accepted for publication July 12, 2016.
References
In this issue


Jump to section
Related Articles
Cited By...
- Clinical features and diagnosis of multiple myeloma: a population-based cohort study in primary care
- Improving the diagnostic pathway in patients presenting with acute kidney injury secondary to de novo multiple myeloma: a short report
- Excluding myeloma diagnosis using revised thresholds for serum free light chain ratios and M-protein levels
- Quantifying intervals to diagnosis in myeloma: a systematic review and meta-analysis
- Re: Presenting Signs of Multiple Myeloma and the Effect of Diagnostic Delay on the Prognosis
- Bread and Butter of Family Medicine: Guidelines, Population Screening, Diagnostic Evaluations, and Practice Models