
Article Figures & Data
Figures
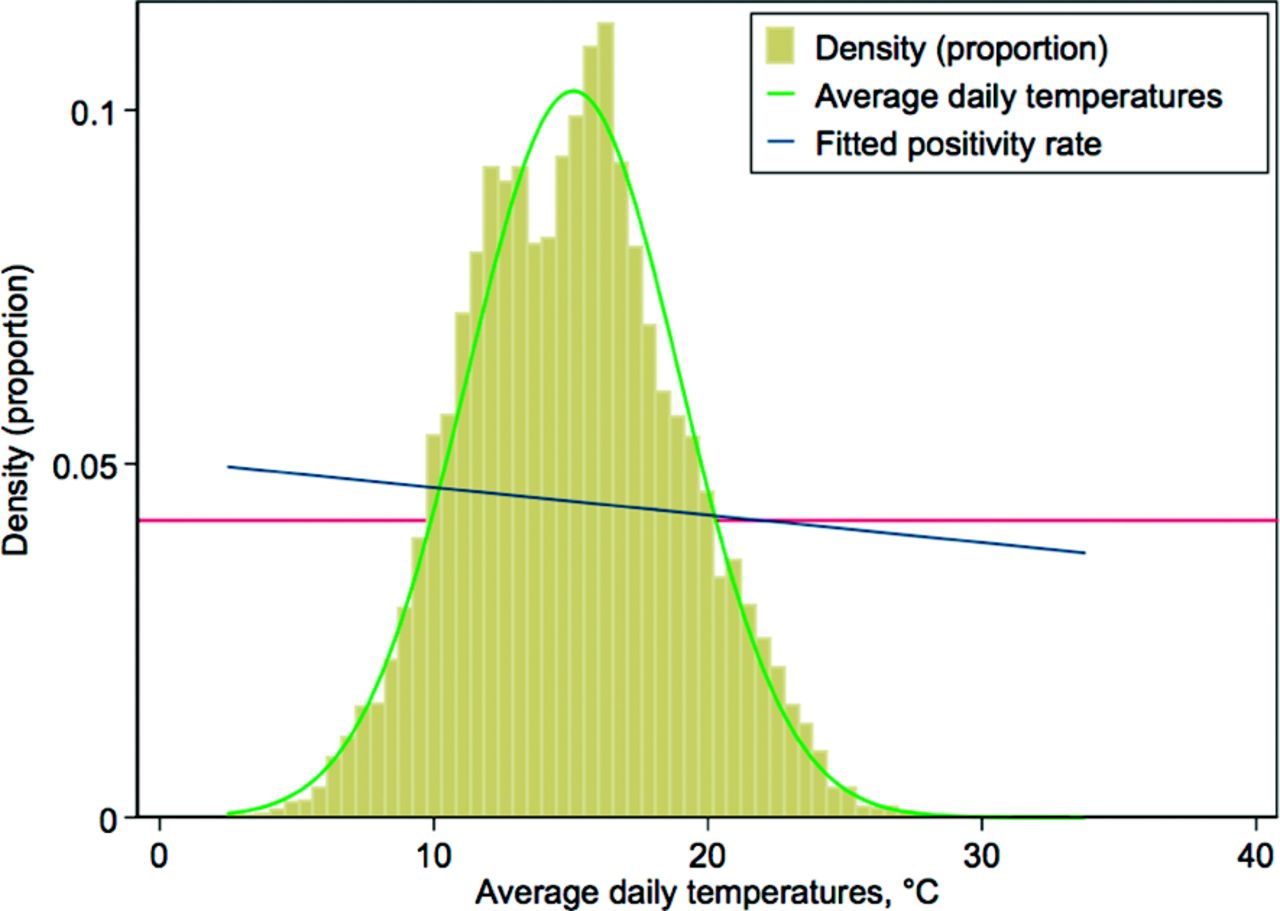
- Figure 1.
Distribution of temperatures across the regions over the study period, Kaiser Permanente–Northern California (KPNC) 2007 to 2013. Note: The horizontal reference line is for the model probability of a positive test (0.045). The temperature distribution in Celsius used the average of the daily minimum and maximums of the entire regions and study period; the average for the 4 temperature categories is: 1, 9.6°C; 2, 11.7°C; 3, 14.3°C; 4, 17.5°C; and 5, 18.7°C.
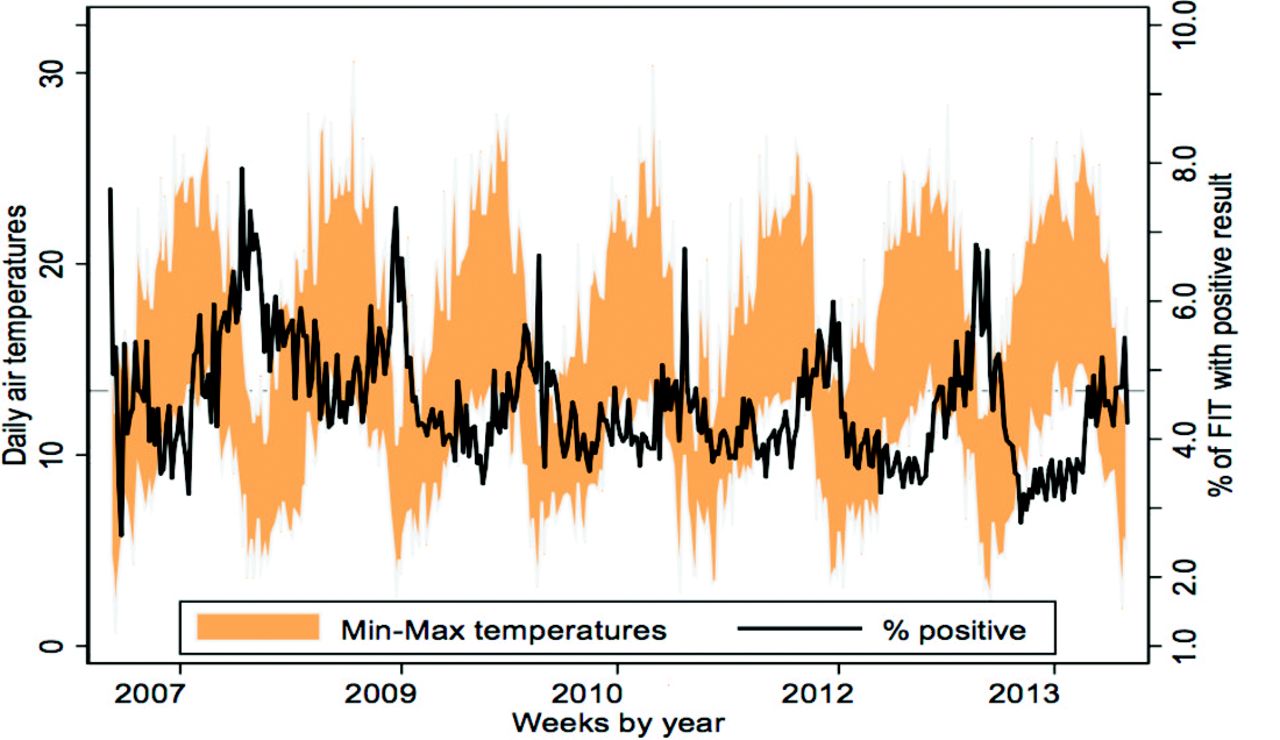
- Figure 2.
Seasonal variation in the positivity rate of fecal immunochemical test, Kaiser Permanente–Northern California (KPNC) 2007 to 2013. Note: The figure was generated using time series analysis methods for the minimum and maximum air temperatures (min–max temperatures, °C) and the positivity rates aggregated according to week over the study years. The positivity rate ranged from 2.6% to 8.0%). The false-positive rates paralleled the positivity rate such that the higher the positivity rate, the higher the false-positivity rate.
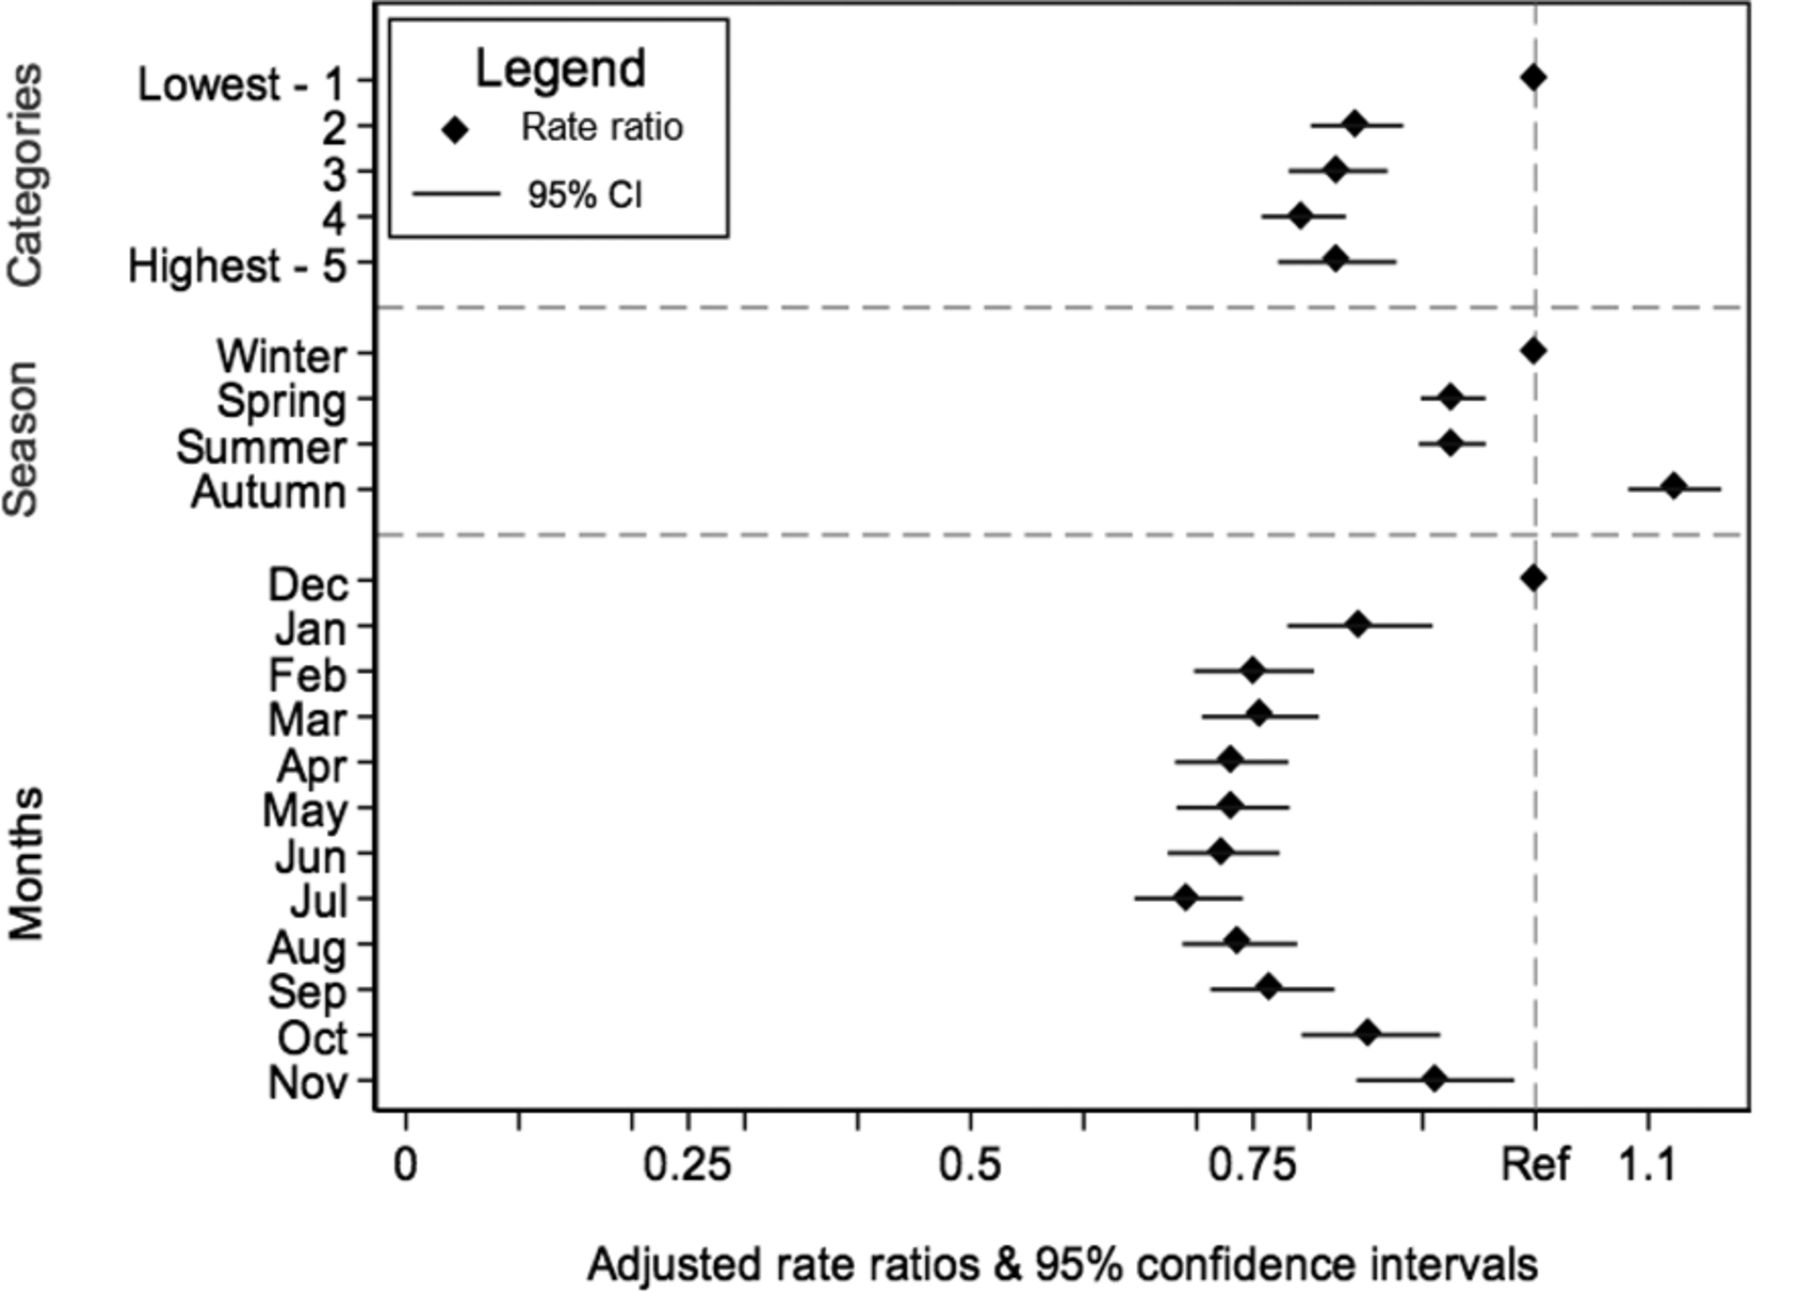
- Figure 3.
Association of positivity rate by season, month, and temperature levels, Kaiser Permanente–Northern California (KPNC) 2007 to 2013. *, Each set of estimates (by levels, by month, and by season of the year) was generated, separately, using predictive margins from the logistic regression adjusted for age, race/ethnicity, and sex using the generalized estimating equations approach with exchangeable covariance matrix.


Tables
- Table 1.
Characteristics of the Cohort, Kaiser Permanente–Northern California (KPNC) 2006 to 2013
Characteristics, % N (472,541) % Age, years 50 to 54 204,019 43.2 55 to 59 111,756 23.7 60 to 64 72,076 15.3 65 to 69 52,149 11.0 70 to 74 32,541 6.9 Females 254,632 53.9 Race-ethnicity Non-Hispanic White 269,639 57.1 Non-Hispanic Black 34,369 7.3 Hispanics/Latinos 57,729 12.2 Asian/Pacific Islanders 68,683 14.5 Native Americans 2,197 0.5 Multiple race 18,959 4.0 Unknown 20,965 4.4 Geographical region Alameda 80,225 17.0 San Francisco/Peninsula/South Bay 158,877 33.6 North Bay 46,550 9.9 Walnut Creek/Diablo 47,001 9.9 Central Valley 26,840 5.7 Sacramento 105,783 22.4 Fresno 7,265 1.5 Percentage of households below federal poverty level, quintiles 1 100,498 21.3 2 98,428 20.9 3 96,150 20.4 4 92,072 19.5 5 84,798 18.0 Charlson Comorbidity Index 0 370,544 78.4 1 85,730 18.1 2 12,764 2.7 3+ 3,503 0.7 Enrollment in health plan, years 2.0 to 4.99 72,675 15.4 5.0 to 9.99 114,065 24.1 10.0+ 285,801 60.5 - Table 2.
Temperature Ranges and Positivity Rates and Adjusted Rate Ratios for Associations of Daily Ambient Temperatures with Fecal Immunochemical Test Positivity Rate, Kaiser Permanente–Northern California (KPNC) 2007 to 2013
Temperature Categories Average of the Minimum–Maximum, °C, mean (range) Positive % Positivity Rate Ratio (95% Confidence Interval) Temperature levels 1 (lowest) 9.6 (8.0 to 11.1) 5.5 1.00 2 11.7 (10.3 to 12.9) 4.4 0.82 (0.78 to 0.86) 3 14.3 (12.7 to 15.8) 4.4 0.82 (0.77 to 0.86) 4 17.5 (15.5 to 19.4) 4.2 0.78 (0.75 to 0.82) 5 (highest) 18.7 (16.7 to 20.7) 4.3 0.81 (0.76 to 0.86) Seasons Winter 10.9 (9.5 to 12.4) 4.5 1.00 Spring 14.8 (12.6 to 16.5) 4.1 0.92 (0.90 to 0.96) Summer 18.3 (16.1 to 20.1) 4.2 0.93 (0.90 to 0.96) Autumn 15.4 (13.1 to 17.9) 5.1 1.13 (1.09 to 1.17) Test result month (individually) January 10.0 (8.5 to 11.7) 4.8 0.83 (0.77 to 0.90) February 11.0 (9.8 to 12.4) 4.3 0.74 (0.69 to 0.79) March 11.8 (10.4 to 13.0) 4.3 0.75 (0.70 to 0.80) April 13.5 (11.8 to 14.9) 4.2 0.73 (0.68 to 0.77) May 15.2 (13.5 to 16.5) 4.1 0.72 (0.67 to 0.77) June 17.3 (15.3 to 19.0) 4.1 0.72 (0.67 to 0.77) July 18.1 (16.1 to 19.8) 3.9 0.69 (0.64 to 0.74) August 18.5 (16.2 to 20.5) 4.2 0.74 (0.69 to 0.79) September 18.9 (16.7 to 20.9) 4.4 0.77 (0.71 to 0.82) October 17.2 (15.4 to 18.6) 4.9 0.85 (0.79 to 0.91) November 13.7 (11.8 to 15.5) 5.2 0.91 (0.84 to 0.98) December 9.9 (8.4 to 11.5) 5.8 1.00 Test result month (grouped in pairs) December/January 10.0 (8.4 to 11.7) 5.2 1.00 February/March 11.4 (10.2 to 12.7) 4.3 0.84 (0.80 to 0.88) April/November 13.6 (11.8 to 15.1) 4.5 0.87 (0.83 to 0.91) May/October 15.9 (14.1 to 17.4) 4.4 0.86 (0.82 to 0.90) June/July 17.7 (15.7 to 19.4) 4.0 0.79 (0.76 to 0.83) August/September 18.6 (16.4 to 20.6) 4.3 0.84 (0.80 to 0.88) Ambient temperature levels were defined using the mean and 1.25 times the standard deviation (SD) of maximum temperatures by year aggregated over weekly intervals, >mean + 1.25 SD, >mean, >means-1.25 SD, and <means + 1.25 SD (reference), in that order. Thus, the highest and lowest temperature levels were 1.25 times the level above or below the mean, respectively.
Each set of estimates (by level, month, and by season of the year) was generated individually using generalized estimating equations with logit link and exchangeable covariance matrix, adjusted for age, sex, and medical region. The estimates are relative ratios from the predictive margins.
- Table 3.
Fecal Immunochemical Test Sensitivity for All Cases According to Regions, Seasons, Months and Temperature Levels and by Location of Tumors, Kaiser Permanente–Northern California (KPNC) 2007 to 2013
All Cases Right-Sided Cancers Left-Sided Cancers Tests, n Cases Positive Adjusted sensitivity, %* Cases Positive Adjusted sensitivity, %* Cases Positive Adjusted sensitivity, %* Overall 1,141,162 1837 1425 75.8 (73.8 to 77.8) 700 525 72.6 (69.2 to 75.9) 1124 893 78.3 (75.9 to 80.7) Temperature levels 1 (Lowest) 60,197 131 103 79.6 (77.8 to 81.4) 39 29 76.9 (73.8 to 80.0) 91 74 81.6 (79.4 to 83.8) 2 322,864 465 361 76.2 (74.3 to 78.2) 186 135 73.0 (70.0 to 76.4) 275 223 78.4 (76.0 to 81.0) 3 160,516 260 203 76.0 (74.0 to 78.0) 107 83 72.8 (69.5 to 76.2) 150 119 78.2 (76.0 to 80.7) 4 528,129 845 657 75.2 (73.2 to 77.2) 330 251 72.0 (68.6 to 75.4) 510 403 77.5 (75.0 to 80.0) 5 (Highest) 69,456 136 101 75.7 (73.6 to 77.8) 38 27 72.6 (69.2 to 76.1) 98 74 77.9 (75.4 to 80.4) Seasons Winter 239,873 348 269 76.4 (74.4 to 78.3)† 132 95 73.2 (69.9 to 76.5) 215 173 78.6 (76.2 to 81.0) Spring 393,119 554 427 74.9 (73.0 to 77.0) 235 176 71.6 (68.2 to 75.0) 315 249 77.3 (75.8 to 79.8) Summer 340,998 593 460 75.0 (73.0 to 77.0) 210 159 71.8 (68.3 to 75.2) 379 299 77.3 (74.8 to 80.0) Autumn 167,172 342 269 78.6 (76.8 to 80.5) 123 95 75.7 (72.6 to 78.9) 215 172 80.6 (78.5 to 83.0) Test result month December/January 87,825 161 127 79.0 (77.0 to 80.7)† 54 38 75.9 (72.8 to 79.1) 106 89 80.9 (78.7 to 83.1) February/March 220,792 294 229 75.7 (73.7 to 77.7) 118 86 72.4 (69.0 to 75.8) 174 141 78.0 (75.5 to 80.4) April/November 175,195 283 218 76.4 (74.4 to 78.3) 107 81 73.2 (70.0 to 76.5) 173 135 78.6 (76.2 to 81.0) May/October 204,814 333 259 76.2 (74.3 to 78.2) 148 117 73.3 (70.0 to 76.6) 182 141 78.5 (76.1 to 81.0) June/July 249,656 380 299 74.5 (72.5 to 76.6) 138 106 71.1 (67.8 to 74.7) 239 191 76.9 (74.3 to 79.4) August/September 202,880 386 293 75.6 (73.6 to 77.6) 135 97 72.4 (69.0 to 75.8) 250 196 78.0 (75.5 to 80.3) Ambient temperature levels were defined using the mean and 1.25 times the standard deviation (SD) of maximum temperatures by year aggregated over weekly intervals, >mean + 1.25 SD, >0.25mean, >means-0.25 SD, >means-1.25 SD and <means-1.25 SD (reference), in that order. Thus, the highest and lowest temperature levels were 1.25 times the level above or below the mean, respectively.
↵* The P-values for the differences in sensitivities in pair-wise comparison using Bonferonni correction were all < .01 relative to this group.
↵† This model was adjusted for age, race/ethnicity, and sex. All models included a variable on colorectal cancer diagnosis and the sensitivity was derived using a predictive margins conditioned on cancer diagnosis.


