
Abstract
Objective: The objective of this research was to gauge the diagnostic utility of serology tests compared with urea breaths tests (UBTs) and determine reliable threshold values/ranges for diagnosis of Helicobacter pylori infection using only immunoglobulin (Ig) G results.
Methods: Data were obtained from 371 patients with UBTs and/or serology tests. Quantitative results were converted to multiple of minimum positive value (MMPV). Results were paralleled to obtain percentage change in serum IgG levels and 95% confidence intervals were obtained to establish new ranges for diagnosis.
Results: Treated patients with only serology tests in a time frame of 3 to 6 months after final treatment displayed a 68.33% ± 2.95% decrease in 95% confidence interval of serum IgG. Uninfected patients with serology and UBT results within 2 weeks displayed a range of 1.32 ± 0.23 MMPV; infected patients produced a range of 3.32 ± 0.88 MMPV.
Conclusion: Treated patients should display a 65.38% to 71.28% decrease in serum IgG levels, along with an ending IgG level of ≤1.75 U/mL or ≤4.025 EV (ELISA value). Before treatment or exposure, patients with serum IgG values of 1.09 to 1.55 U/mL or 2.507 to 3.565 EV or lower are generally uninfected. Because of the lower cost and high confidence of results, we believe that IgG testing should be considered as a reasonable and even perhaps preferred method of monitoring H. pylori infections.
- Cancer
- Cost Effectiveness
- Evidence-Based Medicine
- Gastric Ulcer
- Gastrointestinal Diseases
- Helicobacter pylori
Helicobacter pylori is a gram-negative spiral bacterium with an established association with gastric ulcers and gastric cancer.1,2 This microorganism is found around the gastric mucosa of humans in populations worldwide; although more than 50% of humans harbor it,3 most individuals seem asymptomatic.4 Currently, the most commonly used and approved method for the diagnosis of active infection is the urea breath test (UBT), and although there exists evidence supporting the diagnostic efficacy of immunoglobulin G (IgG) titers,5⇓–7 it remains approved only for research-related use. It should be noted that current guidelines consider the UBT the best diagnostic test in terms of the accuracy and interpretability of its results, and because of the nonequivalence of certain commercial serologic tests, only results from validated serologic assays are included in this study, per current guidelines for the management of H. pylori infections.8 The aim of this study is to gauge the diagnostic utility of the serologic IgG test compared with the UBT and strive to determine a reliable threshold value or relative range for the diagnosis of infection using only serum IgG results.
Methods
Data were collected and evaluated retrospectively from an archive of past and current patients at a suburban general practice clinic who had either been diagnosed with or screened for H. pylori within a 10-year time span; complete eradication of infection in patients was confirmed either by UBT or endoscopy.9 Patient data sets are divided into 2 main categories for analysis: those with quantitative results both before and after treatment and those with one quantitative followed immediately (within 2 weeks) by a qualitative UBT. Patients with only one diagnostic test result on record were excluded from all figures and values in this study.
Quantitative Tests
Quantitative tests in this study comprise results obtained from 2 similar IgG assays performed by 2 different commercial laboratories. Of the patients on record in whom complete eradication of the infection was confirmed, those with IgG serology results from both immediately before and after treatment (all after treatment values included in the study were obtained 3 to 6 months after administration of the final treatment) were grouped. Serum antibody measurements are mainly reported in either units of EV (ELISA value) or units per milliliter. Readings in EV use a minimum positive value of 2.3 (ie, patients with values equal to or greater than this threshold are considered positive for infection); readings in units per milliliter use a minimum positive value of 1.0. It should be noted that measurements in EV report exact values only between the bounds of 0.8 and 70 EV, and measurements in units per milliliter between the bounds of 0.4 and 8.0 U/mL; for the purposes of this study, values reported as >70 EV and >8.0 U/mL are treated as exactly 70 EV and 8.0 U/mL, respectively.
Because of the differing units of measurement used by the laboratories from which we obtained our patients' IgG values, a means of equating the values was required. To accomplish this, we used a custom unit of measurement designed for the purpose of this study: multiple of minimum positive value (MMPV). This value is obtained by dividing the patient's test value by the respective minimum positive values mentioned above (2.3 for EV and 1.0 for U/mL). Percentage decreases for each data set measured in this manner were obtained the same way: MMPV after treatment divided by MMPV before treatment.
To provide a more reliable range of values based on the sample sizes, means, and standard deviations of the data sets, the 95% confidence interval for large samples (sample size >30) was calculated using the equation  .10 All patient data sets with both pre- and posttreatment IgG values measured in the same units (EV or units per milliliter) are grouped for comparison with all other identically measured data sets. Posttreatment values were divided by pretreatment values to obtain percentage decreases, which were subsequently averaged to obtain a mean percentage decrease.
Qualitative Tests
Qualitative tests included in this study comprised patients' UBT results obtained from 2 different commercial laboratories using the same test. Using patient records, we identified patients undergoing UBT within 2 weeks of a serology test; of these, a subgroup of tests taking place before treatment was created. Because the data pairs are not homogenous with regard to their units of IgG measurement, the MMPV system was used to provide a common ground for their comparison.
To illustrate the relationship between IgG MMPV and UBT infection detection, patient results were paired adjacently: one chart contained only the pretreatment data pairs and the other containing all data pairs. Arithmetic mean and standard deviation were calculated separately for MMPV data points linked with positive UBT tests and with negative UBT tests on each chart; 95% confidence intervals were then calculated.
Establishing Ranges
One of the primary objectives of this study was to suggest ranges for IgG values within which physicians can be highly confident in making a diagnosis. Because of the naturally elevated antibody count for specific antigens in people previously exposed to H. pylori,11 separate ranges must be established for patients with and without prior exposure (before treatment and after treatment) to H. pylori. Patient data were categorized as either pre- or posttreatment to calculate separate ranges. The average MMPV and 95% confidence interval range calculated for noninfected patients (pretreatment) established the value range for patients without prior exposure to the H. pylori antigen. The average MMPV and 95% confidence interval range calculated for treated patients (posttreatment) established the value range for patients having prior exposure to the H. pylori antigen.
To apply the ranges obtained in our custom unit of measurement, they were converted to standard units (units per milliliter and EV) by multiplying the upper and lower limits of each range by the baselines of each standard measurement (1.0 U/mL and 2.3 EV). The resulting value ranges of these conversions represent the 95% probability of no infection for patients testing within the upper and lower limits, assuming that the diagnosing physician has knowledge of which group each patient belongs to (with or without prior exposure to H. pylori).
In addition to establishing a range negative for infections, a value threshold for the confirmation of infection was established by calculating the MMPV and respective 95% confidence interval from patients confirmed to be infected by qualitative (UBT) testing. After obtaining the average and value range, the same conversion was applied to obtain equivalent measurements in units per milliliter and EV so that the numbers are usable in a typical clinical setting. Naturally, an upper limit does not need to be set.
Results
This study included 371 patients (186 men and 185 women; mean age ± standard deviation, 47.8 ± 13.0 years). Of the 176 patients with confirmed eradication of infection (94 men and 82 women; mean age ± standard deviation, 48.0 ± 11.7 years), 146 patients had quantitative serology results both before and after treatment. In addition, 93 unique cases of UBT (Otsuka America Pharmaceutical, Inc., Rockville, MD). performed immediately following serum IgG lab tests were identified, 84 of which took place before treatment.
Quantitative Results
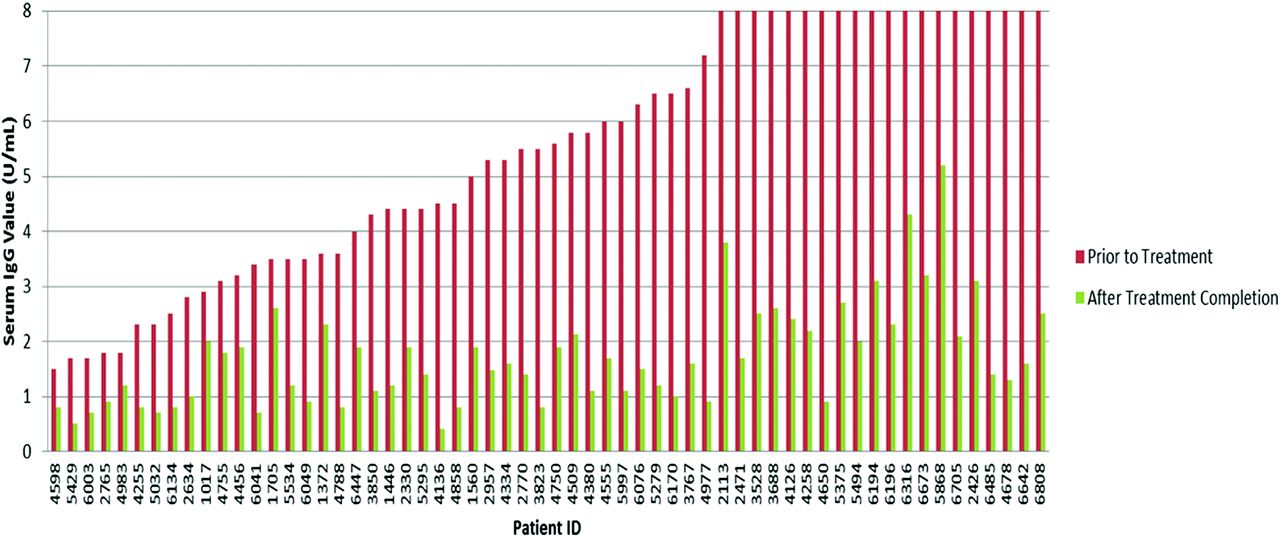
In total, 93 patients possessed records including serum IgG values measured in exclusively the same units before and following treatment: 60 in units per milliliter and 33 in EV. In the units per milliliter group, patients displayed an average 66.57% decrease in IgG values from before to after treatment, with a 95% confidence interval of 62.67–70.47% (Figure 1). In the EV measurement group, patients displayed an average 62.67% decrease in IgG values, with a 95% confidence interval of 54.16–71.18% (Figure 2). Results in both units of measurement were combined using our custom unit of measurement. Data from a total of 146 patients with IgG tests both before and after treatment were converted and graphed (Figure 3), revealing an average IgG decrease of 68.33%, with a 95% confidence interval of 65.38–71.28%. MMPV of IgG tests after treatment of all treated patients averaged at 1.57, with a 95% confidence interval of 1.39–1.75 MMPV. The MMPV for treated patients before treatment averaged at 6.578 ± 0.99, but this was not used because of the large standard deviation (6.09)—which indicates a very large variation in IgG values before treatment, which is to be expected.

Comparison of serum immunoglobulin (Ig) G values as units per milliliter in all patients with Helicobacter pylori before and after treatment. Laboratory measurements (units per milliliter) are capped at an 8 U/mL maximum and a 0.4 U/mL minimum.

Comparison of serum immunoglobulin G (EV) values in all patients with Helicobacter pylori before and after treatment. Laboratory measurements are capped at a 70 EV maximum and a 0.8 EV minimum.

Comparison of multiple of minimum positive serum immunoglobulin G values in all patients with Helicobacter pylori before and after treatment.
Qualitative Results
Of the 93 total instances of UBT performed immediately following serum IgG lab tests, 42 cases resulted in the detection of no infection, whereas infection was detected by UBT in the remaining 51 cases (Table 1). The data pairs with no infection detected averaged 1.37 MMPV in their IgG test results and yielded a 95% confidence interval of ±0.23. The data pairs for which infection was detected averaged 3.21 MMPV in their IgG test results and yielded a 95% confidence interval of ±0.8.
Removing data pairs from tests after treatment left 84 total instances of UBT performed immediately following serum IgG lab tests, including 46 cases with infection detected and 38 without (Table 2). The pretreatment data pairs without infection detected averaged 1.32 MMPV for IgG test results and yielded a 95% confidence interval of ±0.23. The data pairs for which infection was detected averaged 3.32 MMPV for IgG test results and yielded a 95% confidence interval of ±0.88.
Establishing Ranges
The first range established was for the negative diagnosis of patients without prior exposure. Patient data categorized as without prior exposure to H. pylori and proven negative for infection by the UBT resulted in an average MMPV of 1.32 and 95% confidence interval of 1.09–1.55. Converted to standard measurements, the resulting ranges were 1.09 to 1.55 U/mL and 2.507 to 3.565 EV.
The second range we established was for the negative diagnosis of patients after the treatment of an active infection. Converting the MMPV 95% confidence interval of 1.57 ± 0.18 (obtained from negatively tested patients after treatment) to standard measurement units of units per milliliter and EV, ranges of 1.39 to 1.75 U/mL and 3.197 to 4.025 EV were obtained; based on the data, these ranges represent the 95% probability of no active H. pylori infection after treatment.
Last, we established a range for positive infections. Qualitative data for patients testing positive for infection by UBT yielded a MMPV 95% confidence interval of 3.21 ± 0.8. Converted to standard measurements, ranges of 2.41 to 4.01 U/mL and 5.543 to 9.223 EV were obtained.
Discussion
While the UBT provides qualitative results in the diagnosis of H. pylori infection, quantitative serum lab tests allow medical practitioners to make a diagnosis and track the progression of the disease to very small numerical differences (Figure 4)—differences that may otherwise cause the qualitative end results of UBTs to be tipped completely into either a positive or negative report. Based on the data obtained, treated patients should display a 65.38% to 71.28% decrease in serum IgG levels 3 to 6 months after treatment compared with levels before treatment, along with an ending IgG level of ≤1.75 U/mL or ≤4.025 EV. A similar follow-up study found the seroreversion (from positive to negative results) rate of IgG to be 53% at 12 months and 86% at 24 months,12 which matches the trend of our raw data but uses the standard 1.0 U/mL baseline, implying that seroreversion could have been detected earlier with our revised ranges.
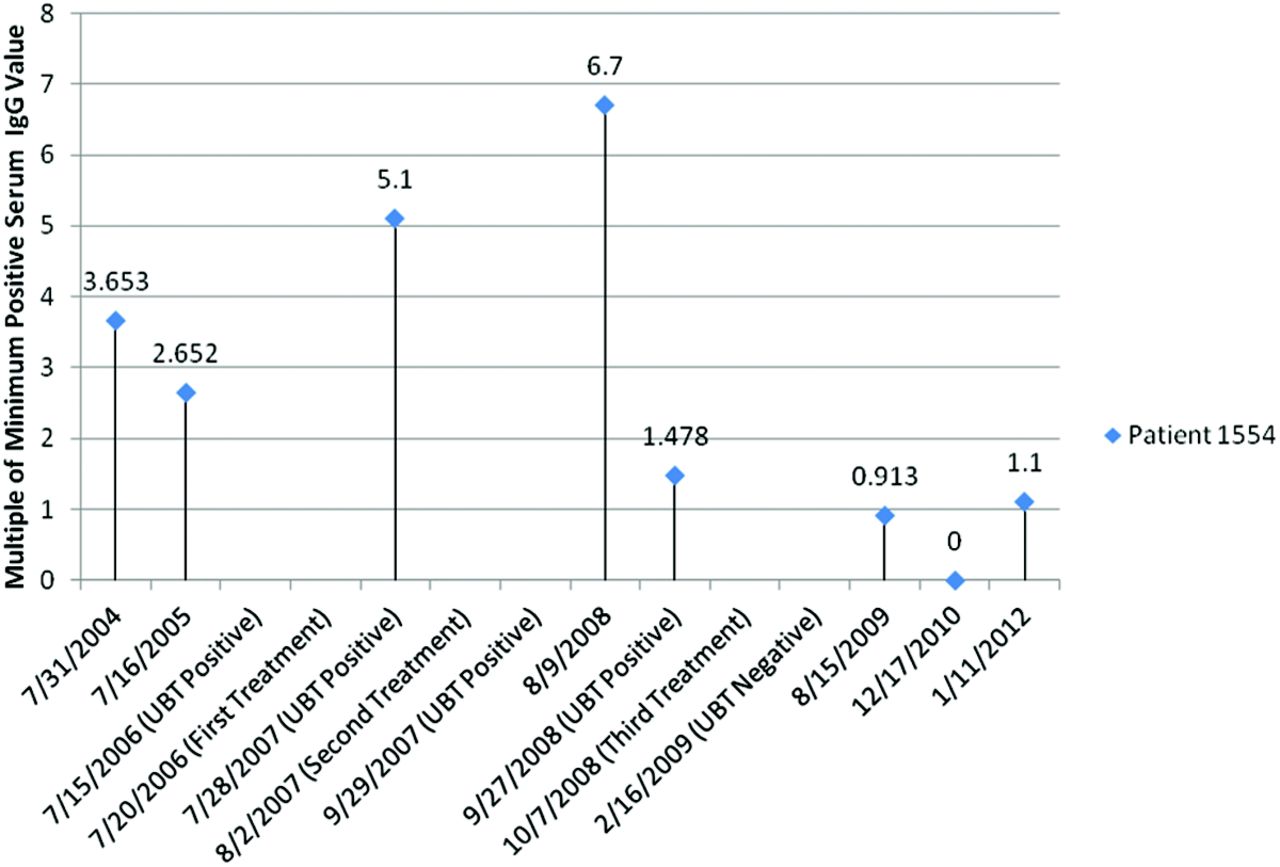
Timeline of Helicobacter pylori and immunoglobulin G (IgG) value progression in the patient with the longest treatment. UBT, urea breath test.
In situations of diagnosis before any kind of treatment or prior exposure of a patient to H. pylori, around 95% of patients with serum IgG tests resulting in 1.09 to 1.55 U/mL or 2.507 to 3.565 EV are negative for infection. Based on the values obtained in this study, patients with test results scoring lower than these value ranges are almost certainly not infected. After analyzing the results for serum IgG lab tests linked with positive UBTs, we found that patients testing at ≥2.41 U/mL and ≥5.543 EV are almost certainly positive for active H. pylori infection.
It should be noted that the values in this study were obtained from only a single suburban clinic, and the patient pool may not reflect a sufficiently heterogeneous demographic. Other limitations of this study include the inability to monitor and confirm whether patients undergoing treatment ingested their prescriptions faithfully. This specific issue led to several records being excluded from this study after discovery. To expand on this study, we suggest next steps be the inclusion of results from clinics located in more diverse populations to eliminate demographic biases, along with monitoring to confirm that patients are adhering treatment guidelines.
Conclusion
Although the UBT is in fact a more definitive diagnostic test than IgG testing, clinicians and patients alike may favor the latter because of its much lighter financial burden. In addition, clinicians wishing to track the progression of infections or treatments may favor IgG testing because results are reported quantitatively. Clinically, considering the much lower cost of IgG testing, in addition to its simplicity and wide availability, we believe that IgG testing should be considered as a reasonable and even perhaps preferred method of monitoring H. pylori infections.
Notes
This article was externally peer reviewed.
Funding: none.
Conflict of interest: none declared.
- Received for publication June 11, 2013.
- Revision received June 12, 2014.
- Accepted for publication June 20, 2014.
In this issue


Jump to section
Related Articles
Cited By...
- No citing articles found.