
Article Figures & Data
Figures
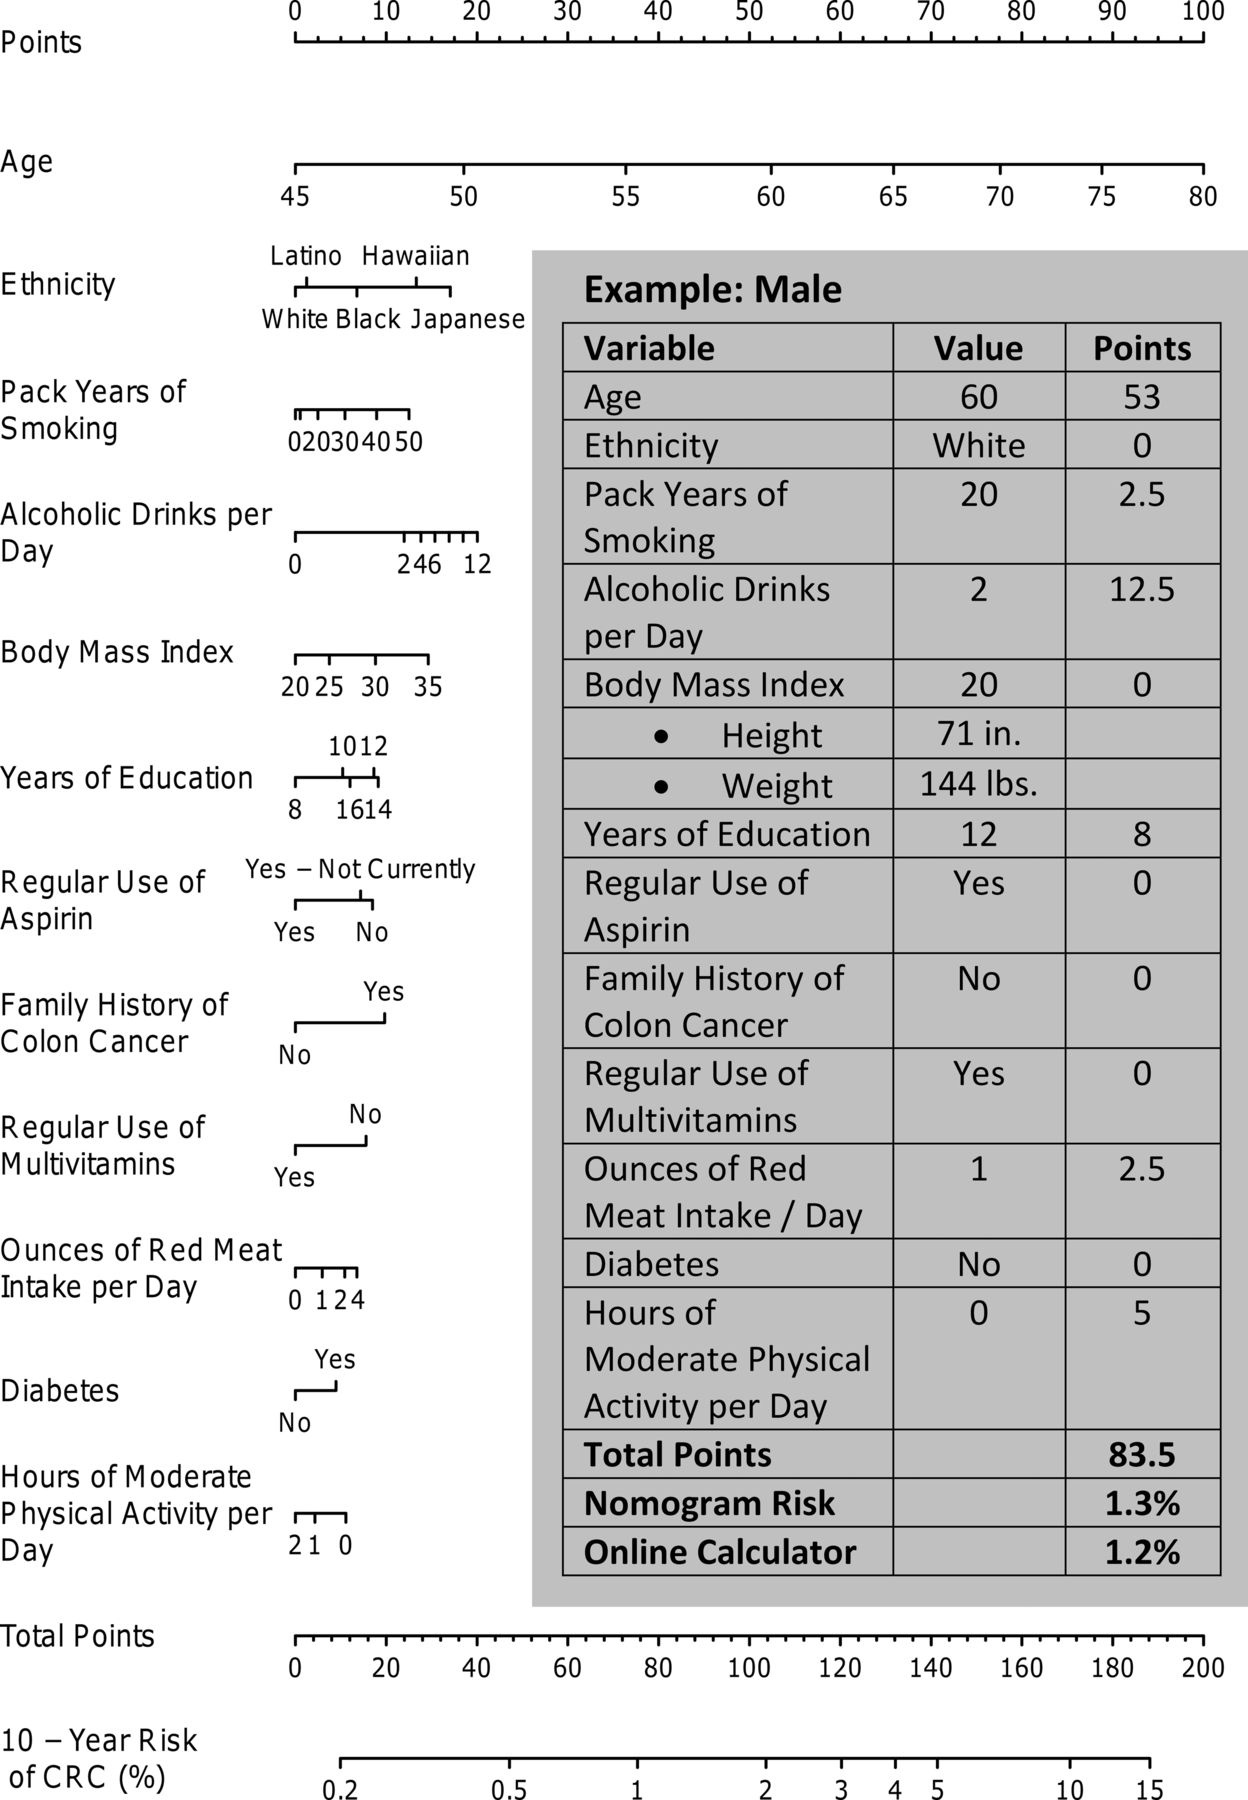
- Figure 1A.
Nomogram for predicting colorectal cancer risk in men. Instructions: Draw a perpendicular line from the patient's age to the “points” axis and record the value. Repeat this process for the remaining variables and tally. The 10-year risk of colorectal cancer (CRC) is identified where a line drawn straight down from the “total points” axis intersects the “10-year risk of CRC (%).” Please note that the “years of education” variable has a U-shaped relationship with the 10-year risk of CRC. That is, the lowest risk of CRC occurs at 8 years and increases as you move along the top of the axis from left to right until reaching the highest risk at 14 years, and then it decreases along the bottom of the axis as you move to the left from 14 to 16 years.
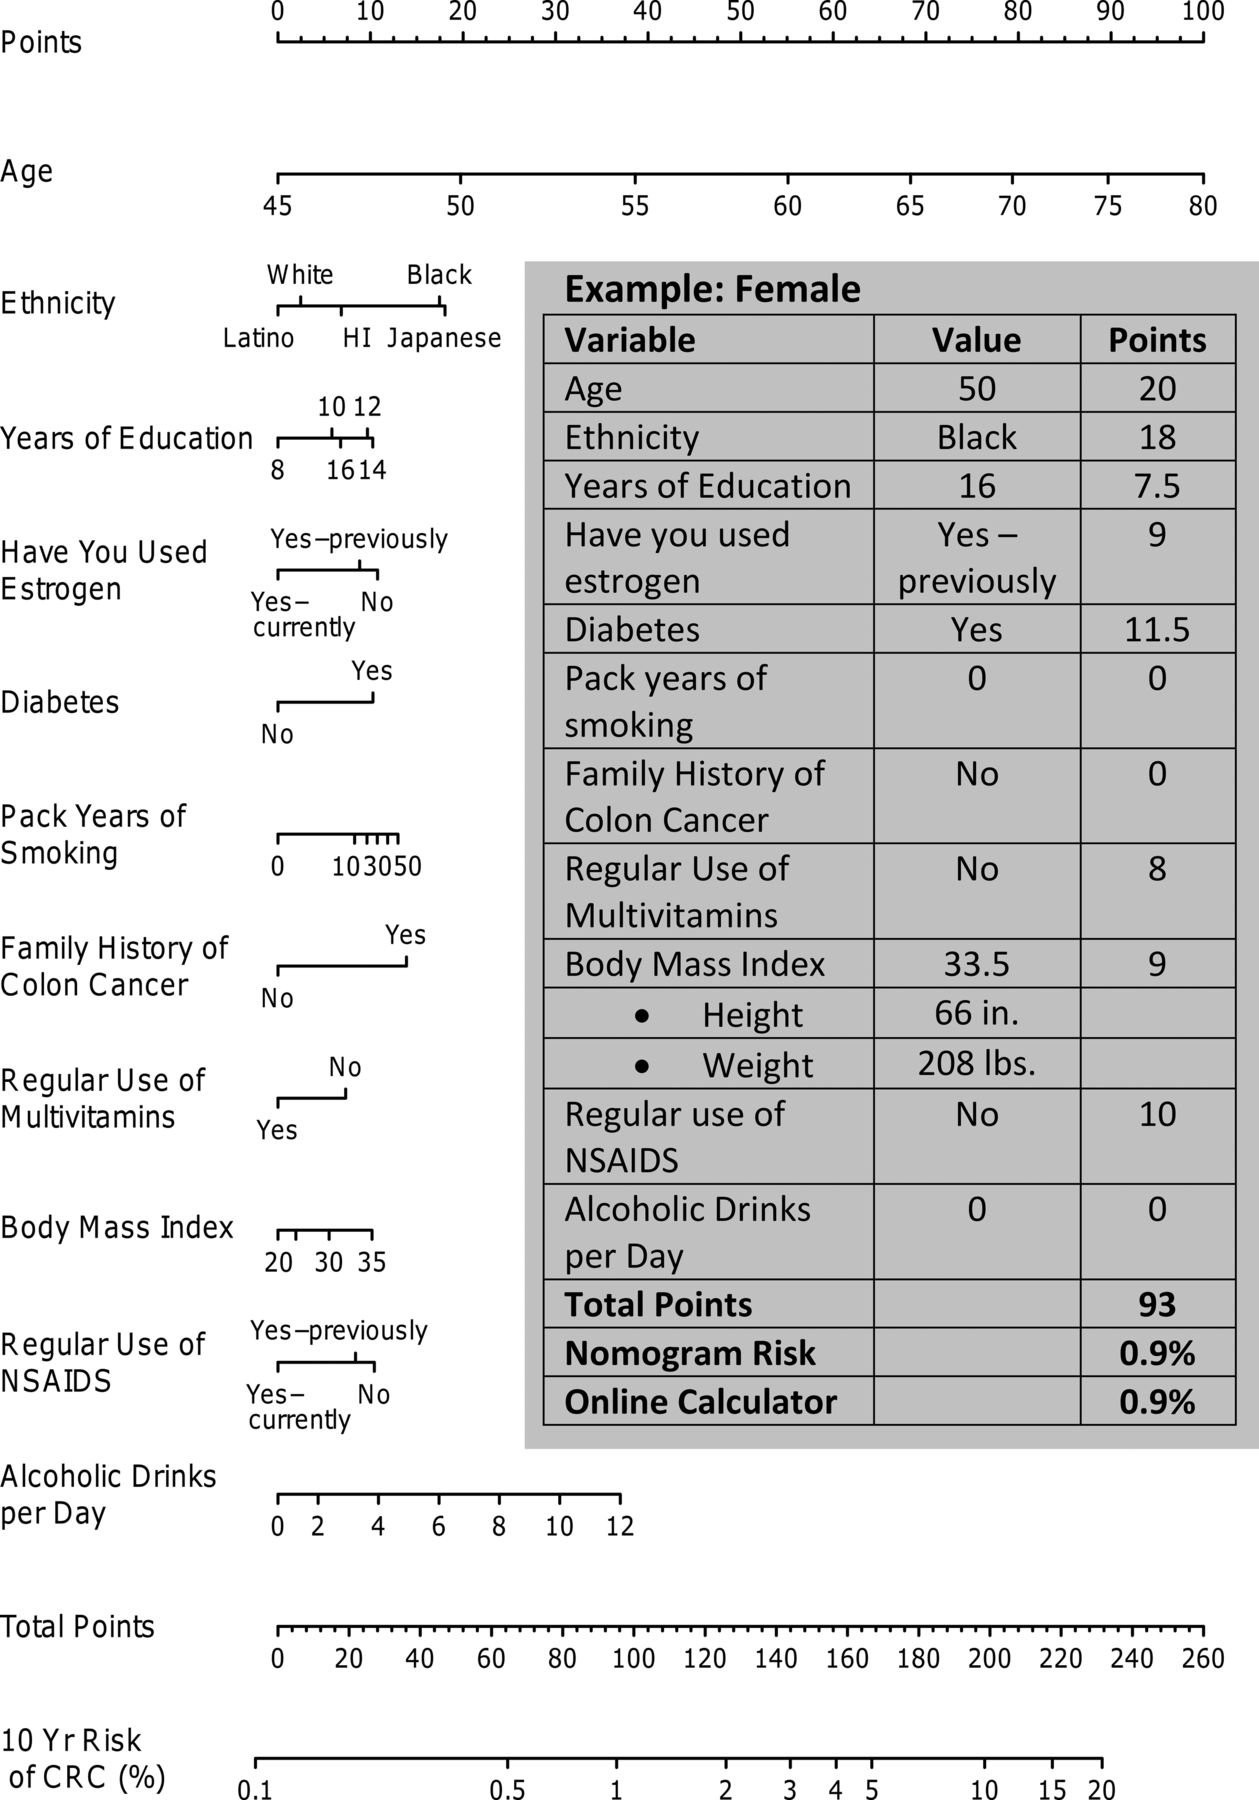
- Figure 1B.
Nomogram for predicting colorectal cancer risk in women. NSAIDS, nonsteroidal anti-inflammatory drugs.
- Figure 2.
Calibration curve for the prediction in men (A) and women (B). The calibration curves were created by plotting the mean predicted risk of colorectal cancer in each quintile of risk on the x-axis against the corresponding Kaplan-Meier (K-M) estimated incidence in the same quintile. Error bars reflect the 95% confidence interval around the K-M estimate. The risks are displayed as probabilities. Perfect calibration would fall directly on the 45-degree line.


Tables
- Table 1. Differences between Variable Definitions in the Freedman (aka National Cancer Institute) Calculator and the Multiethnic Cohort Study
Variable National Cancer Institute Definition Multiethnic Cohort Study Estrogen Asks about estrogen use in the past 2 years. Also asks about menopausal status and allows different estrogen effects depending on menopausal status Does not specifically ask about estrogen use in the past 2 years Vegetable intake “In the past 30 days, about how many servings per week of vegetables or leafy green salads did you eat?” (cups) Vegetables quantified according to grams per day based on detailed food frequency questionnaire Family history of colorectal cancer Number of first-degree relatives with a history of cancer of the colon or rectum Family history of colon cancer in first-degree relative (yes or no) Activity Defined according to the number of hours of activity in the past week, but also requires detailed information about how many months the participant was active in the past year Only asked about current activity level Nonsteroidal anti-inflammatory drugs and aspirin Regular use defined as 3 times per week Regular use was defined as twice per week - Table 2A. Descriptive Statistics for Men by Colorectal Cancer Outcome in the Multiethnic Cohort Study (n = 80,062)
Characteristics Developed Colorectal Cancer Patients with Missing Data No (n = 78,576) Yes (n = 1,486) Mean age, years (SD)* 59.8 (8.9) 64.2 (7.8) 0 (0.0) Race/ethnicity* 0 (0.0) Black 11,202 (14.3) 231 (15.5) Hawaiian 5,565 (7.1) 105 (7.1) Japanese 22,247 (28.3) 558 (37.6) Latino 19,879 (25.3) 301 (20.3) White 19,683 (25) 291 (19.6) Mean pack-years smoking (SD)* 13.9 (16.6) 17 (18.4) 3,088 (3.9) Alcohol, mean drinks/day (SD)*† 1.0 (2.3) 1.3 (2.6) 0 (0.0) Mean years of education (SD)* 13.2 (3.4) 13 (3.1) 884 (1.1) Family history of colon cancer* 6,030 (7.7) 156 (10.5) 11,015 (13.8) Mean body mass index (SD) 26.6 (4.1) 26.6 (4.2) 753 (0.9) Regular use of aspirin‡ 7,439 (9.3) No 46,001 (58.5) 901 (60.6) Yes, not currently 13,795 (17.6) 255 (17.2) Yes, currently 18,780 (23.9) 330 (22.2) Regular use of multivitamins*§ 37,395 (47.6) 627 (42.2) 4,189 (5.2) Diabetes* 9,749 (12.4) 214 (14.4) 0 (0.0) Mean hours of moderate activity per day (SD)* 1.3 (1.5) 1.2 (1.4) 3,590 (4.5) History of cancer 7,038 (9.0) 130 (8.7) 1 (<0.1) Preference for well-done meat 34,122 (43.4) 625 (42.1) 2,327 (2.9) Mean intake of red meat per day, oz (SD)* 2.6 (2.1) 2.5 (1.9) 0 (0.0) Regular use of NSAIDs*† 10,214 (12.8) No 57,852 (73.6) 1,146 (77.1) Yes, not currently 12,924 (16.4) 207 (13.9) Yes, currently 7,800 (9.9) 133 (9) Data are n (%) unless otherwise indicated. The Multiethnic Cohort study enrolled an ethnically diverse mix of residents from Hawaii and California between 1993 and 1996.
↵* Statistically significant in univariate analysis (P < .05).
↵† One alcoholic drink is defined as 1 oz of alcohol, which is approximately equivalent to one 12 oz beer, one 4-oz glass of wine, or 1 shot of liquor.
↵‡ At least twice a week for 1 month or longer.
↵§ At least once per week for the past year.
NSAIDS, nonsteroidal anti-inflammatory drugs; SD, standard deviation.
Characteristics Developed Colorectal Cancer Patients with Missing Data No (n = 99,292) Yes (n = 1,276) Mean age, years (SD)* 59.5 (8.8) 64 (7.9) 0 (0.0) Race/ethnicity* 0 (0.0) Black 19,694 (19.8) 347 (27.2) Hawaiian 7,464 (7.5) 77 (6) Japanese 26,500 (26.7) 413 (32.4) Latino 21,730 (21.9) 194 (15.2) White 23,904 (24.1) 245 (19.2) Mean pack-years smoking (SD)* 6.6 (12.1) 7.4 (12.8) 3,739 (3.7) Alcohol intake (mean drinks/day [SD])*† 0.3 (1.1) 0.4 (1.6) 0 (0.0) Mean years of education (SD) 13.0 (3.3) 12.8 (2.9) 1,255 (1.2) Family history of colon cancer* 9,165 (9.2) 174 (13.6) 12,707 (12.6) Mean body mass index (SD) 26.4 (5.5) 26.6 (5.7) 2,346 (2.3) Regular use of aspirin‡ 4,971 (4.9) No 61,593 (62) 806 (63.2) Yes, not currently 19,193 (19.3) 234 (18.3) Yes, currently 18,506 (18.6) 236 (18.5) Regular use of multivitamins*§ 53,596 (54) 625 (49) 2,649 (2.6) Diabetes* 10,910 (11) 188 (14.7) 0 (0.0) Mean hours of moderate activity/day (SD) 1.1 (1.2) 1 (1.2) 2,420 (2.4) History of cancer 11,576 (11.7) 151 (11.8) 0 (0.0) Preference for well-done meat* 53,082 (53.5) 739 (57.9) 1,287 (1.3) Mean intake of red meat per day, oz (SD)* 1.7 (1.6) 1.6 (1.4) 0 (0.0) Regular use of NSAIDs*‡ 6,488 (6.2) No 62,132 (62.6) 849 (66.5) Yes, not currently 21,284 (21.4) 266 (20.8) Yes, currently 15,876 (16) 161 (12.6) Estrogen use*‖ 3,277 (3.1) No 53,754 (54.1) 709 (55.6) Yes, not currently 17,752 (17.9) 278 (21.8) Yes, currently 27,786 (28) 289 (22.6) Data are n (%) unless otherwise indicated. The Multiethnic Cohort study enrolled an ethnically diverse mix of residents from Hawaii and California between 1993 and 1996.
↵* Statistically significant in univariate analysis (P < .05).
↵† One alcoholic drink is defined as 1 oz of alcohol, which is approximately equivalent to one 12 oz beer, one 4 oz glass of wine, or one shot of liquor.
↵‡ At least twice a week for 1 month or longer.
↵§ At least once per week for the past year.
↵‖ Estrogen use was defined as female hormones administered by pill, injection, or patch for menopause or other reasons.
NSAID, nonsteroidal anti-inflammatory drug; SD, standard deviation.
- Table 3A. Variable Impact on the Apparent C-Statistic for the Colorectal Cancer Model in Men
Variable C-Statistic Change in C-Statistic Variables (n) No Model 0.5 — 0 Age 0.663280 0.163280 1 Race/ethnicity 0.672989 0.009710 2 Pack-years of smoking 0.678214 0.005224 3 Alcoholic drinks per day 0.681442 0.003229 4 Body mass index 0.684263 0.002821 5 Years of education 0.686596 0.002333 6 Regular use of aspirin 0.688405 0.001809 7 Family history of colon cancer 0.689931 0.001526 8 Regular use of multivitamins 0.691143 0.001212 9 Red meat intake (oz) per day 0.691765 0.000622 10 History of diabetes 0.692365 0.000600 11 Moderate physical activity per day (hours) 0.692879 0.000513 12 History of cancer* 0.693176 0.000297 13 Regular use of NSAIDs* 0.693397 0.000221 14 Preference for well-done meat* 0.693538 0.000141 15 (Full) The outcome was colorectal cancer.
↵* The variable was excluded from the final model because of the relatively small amount of additional prediction accuracy that it could have contributed to the model. The final model, which included 12 variables, had an apparent c-statistic of 0.6929, which was within 0.001 of the accuracy associated with the c-statistic of the full model, which was 0.6935.
NSAIDS, nonsteroidal anti-inflammatory drugs.
- Table 3B. Variable Impact on the Apparent C-Statistic for the Colorectal Cancer Model in Women
Variable C-Statistic Change in C-Statistic Variables (n) No Model 0.5 — 0 Age 0.657655 0.157655 1 Race/ethnicity 0.667666 0.010010 2 Years of education 0.670909 0.003243 3 Use of estrogen 0.674048 0.003139 4 History of diabetes 0.676648 0.002600 5 Pack-years of smoking 0.679123 0.002476 6 Family history of colon cancer 0.680963 0.001839 7 Regular use of multivitamins 0.682497 0.001534 8 Body mass index 0.683796 0.001300 9 Regular use of NSAIDs 0.684893 0.001097 10 Alcoholic drinks per day 0.685869 0.000976 11 Preference for well-done meat* 0.686268 0.000399 12 Moderate physical activity per day (hours)* 0.686525 0.000257 13 Regular use of aspirin* 0.686790 0.000266 14 Red meat intake per day (oz)* 0.686869 0.000078 15 History of cancer* 0.686865 -0.000003 16 (Full) The outcome was colorectal cancer.
↵* The variable was excluded from the final model because of the relatively small amount of additional prediction accuracy that it could have contributed to the model. The final model, which included 11 variables, had an apparent c-statistic of 0.6859, which was within 0.001 of the accuracy associated with the c-statistic of the full model, which was 0.6869.
NSAIDS, nonsteroidal anti-inflammatory drugs.
Variable Comparison Groups* Adjusted Hazard Ratio Point Estimate 95% CI Age (years) 67 vs 52 3.03 2.69–3.41 Diabetes Yes vs no 1.12 0.96–1.30 Regular multivitamin use Yes vs no 0.83 0.74–0.92 Family history of colon cancer Yes vs no 1.27 1.08–1.51 Education (years) 16 vs 12 0.94 0.85–1.03 Race/ethnicity Black vs white 1.18 0.99–1.42 Hawaiian vs white 1.39 1.10–1.75 Japanese vs white 1.52 1.31–1.77 Latino vs white 1.03 0.86–1.23 Body mass index (kg/m2) 28.7 vs 23.8 1.12 1.04–1.21 Alcoholic drinks per day (n) 1.15 vs 0 1.26 1.13–1.41 Moderate activity per day (hours) 1.6 vs 0.4 0.92 0.83–1.02 Regular aspirin use Not currently vs no 0.97 0.84–1.11 Yes vs no 0.81 0.71–0.92 Pack-years smoking (n) 19.8 vs 0 1.06 0.93–1.21 ↵* Continuous variables were modeled using restricted cubic splines with 3 knots. Comparison groups for the continuous variables are based on the 75th percentile versus the 25th percentile.
CI, confidence interval.
Variable Comparison Groups* Adjusted Hazard Ratio Point Estimate 95% CI Age (years) 67 vs 52 2.81 2.48–3.18 Diabetes Yes vs no 1.26 1.08–1.48 Regular use of multivitamins Yes vs no 0.85 0.76–0.95 Family history of colon cancer Yes vs no 1.37 1.17–1.61 Education (years) 14 vs 12 1.01 0.97–1.06 Race/ethnicity Black vs white 1.41 1.18–1.67 Hawaiian vs white 1.10 0.85–1.44 Japanese vs white 1.43 1.20–1.70 Latino vs white 0.95 0.77–1.17 Body mass index (kg/m2) 29.3 vs 22.5 1.10 1.00–1.21 Alcoholic drinks per day (n) 0.1 vs 0 0.99 0.93–1.06 Regular use of NSAIDs Not currently vs no 0.95 0.83–1.10 Yes vs no 0.79 0.66–0.94 Pack-years of smoking (n) 8.9 vs 0 1.20 1.05–1.38 Estrogen use Not currently vs no 0.96 0.83–1.10 Yes vs no 0.78 0.68–0.90 ↵* Continuous variables were modeled using restricted cubic splines with 3 knots. Comparison groups for the continuous variables are based on the 75th percentile versus the 25th percentile.
CI, confidence interval; NSAIDS, nonsteroidal anti-inflammatory drugs.
Variables Coefficient Standard Error Age* Linear component 0.0917 0.0106 Nonlinear component −0.0234 0.0106 Diabetes 0.1102 0.0758 Regular use of multivitamins −0.1918 0.0532 Family history of colon cancer 0.2425 0.0850 Years of education* Linear component 0.0721 0.0181 Nonlinear component −0.0734 0.0193 Race/ethnicity Hawaiian 0.1609 0.1208 Japanese 0.2535 0.0820 Latino −0.1366 0.0925 White −0.1673 0.0921 Body mass index* Linear component 0.0180 0.0162 Nonlinear component 0.0090 0.0194 Alcoholic drinks per day* Linear component 0.2838 0.0752 Nonlinear component −1.7375 0.5356 Hours of moderate activity per day* Linear component −0.0907 0.0702 Nonlinear component 0.1103 0.1496 Regular aspirin use Yes, not currently −0.0323 0.0719 Yes −0.2096 0.0655 Pack-years of smoking* Linear component 0.0002 0.0059 Nonlinear component 0.0177 0.0170 ↵* Continuous variables were modeled using restricted cubic splines with 3 knots. Therefore, continuous variables contain one coefficient for the linear component and a nonlinear component.
Variable Coefficient Standard Error Age* Linear component 0.0900 0.0112 Nonlinear component −0.0276 0.0114 Diabetes 0.2333 0.0821 Regular use of multivitamins −0.1665 0.0568 Family history of colon cancer 0.3159 0.0820 Years of education* Linear component 0.0744 0.0204 Nonlinear component −0.0757 0.0212 Race/ethnicity Hawaiian −0.2410 0.1284 Japanese 0.0140 0.0844 Latino −0.3967 0.0977 White −0.3406 0.0892 Body mass index Linear component 0.0075 0.0146 Nonlinear component 0.0121 0.0177 Alcoholic drinks per day Linear component −0.0886 0.3046 Nonlinear component 0.4092 0.7886 Regular use of NSAIDs Yes, not currently −0.0464 0.0731 Yes −0.2370 0.0887 Pack-years of smoking† Linear component 0.0627 0.0498 Nonlinear component 1 −1.8515 2.1240 Nonlinear component 2 2.2999 2.6795 Estrogen use Yes, not currently −0.0443 0.0719 Yes −0.2450 0.0724 ↵* Continuous variables were modeled using restricted cubic splines with three knots. Therefore, continuous variables contain one coefficient for the linear component (displayed first) and a non-linear component (displayed in the next row and denoted with a single quotation mark).
↵† Unable to obtain a natural spline using 3 knots and therefore restricted cubic splines with 4 knots were used for this variable.
NSAIDS, nonsteroidal anti-inflammatory drugs.
In this issue


Jump to section
Related Articles
Cited By...
- Lifestyle predictors of colorectal cancer in European populations: a systematic review
- External Validation of Risk Prediction Models Incorporating Common Genetic Variants for Incident Colorectal Cancer Using UK Biobank
- Risk Prediction Models for Colorectal Cancer Incorporating Common Genetic Variants: A Systematic Review
- Comparison of prognostic models to predict the occurrence of colorectal cancer in asymptomatic individuals: a systematic literature review and external validation in the EPIC and UK Biobank prospective cohort studies
- Inclusion of a Genetic Risk Score into a Validated Risk Prediction Model for Colorectal Cancer in Japanese Men Improves Performance
- Risk assessment in pulmonary arterial hypertension
- Risk Prediction Models for Colorectal Cancer: A Systematic Review
- Content Usage and the Most Frequently Read Articles of 2014
- Serum Vascular Adhesion Protein-1 Level Predicts Risk of Incident Cancers in Subjects with Type II Diabetes
- Family Physicians are Complex Care Physicians and Quality of Care Advancement Experts