
Article Figures & Data
Figures
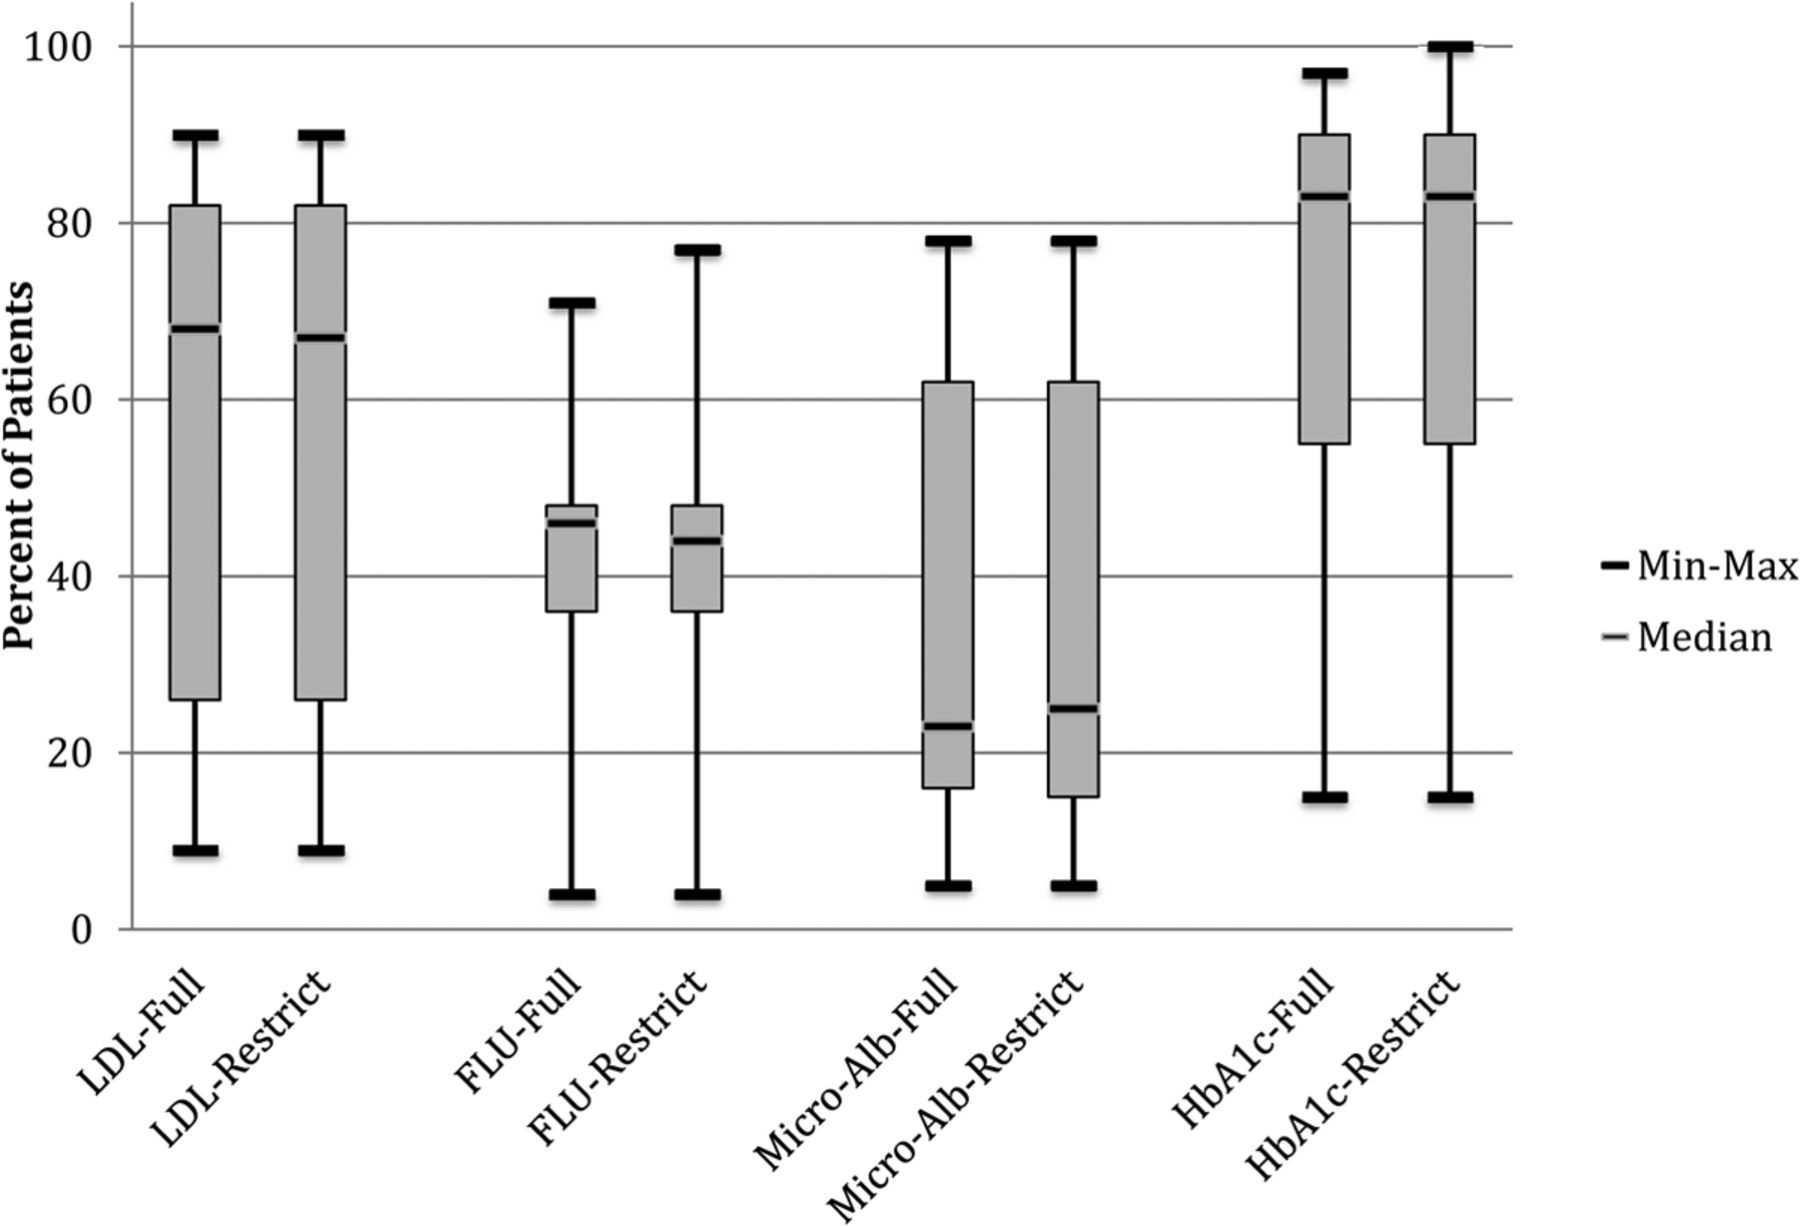
- Figure 1.
Variability in the percentage of patients provided diabetes-related preventive services in the full versus restricted patient panels at the clinic level. FLU, influenza vaccination; HbA1c, hemoglobin A1c monitoring; LDL, low-density lipoprotein cholesterol screening; Micro-Alb, urine microalbumin screening.
- Figure 2.
Proportion of variability in the percentage of patients provided diabetes-related preventive services accounted for by clinic-level patient panel characteristics. Note that the percentage variability associated with clinic patient panel characteristics was determined from the change in r2 when the variable was added to a model already containing the variables with stronger associations with delivery of the service. The variable order was determined through stepwise selection based on the addition of variables, resulting in the maximum change in r2. The proportion of clinic variability in the delivery of a service that is not explained by a model including all patient characteristics in this study is shown in gray. *P < .05. HbA1c, hemoglobin A1c monitoring; LDL, low-density lipoprotein cholesterol screening; Micro-Albumin, urine microalbumin screening.
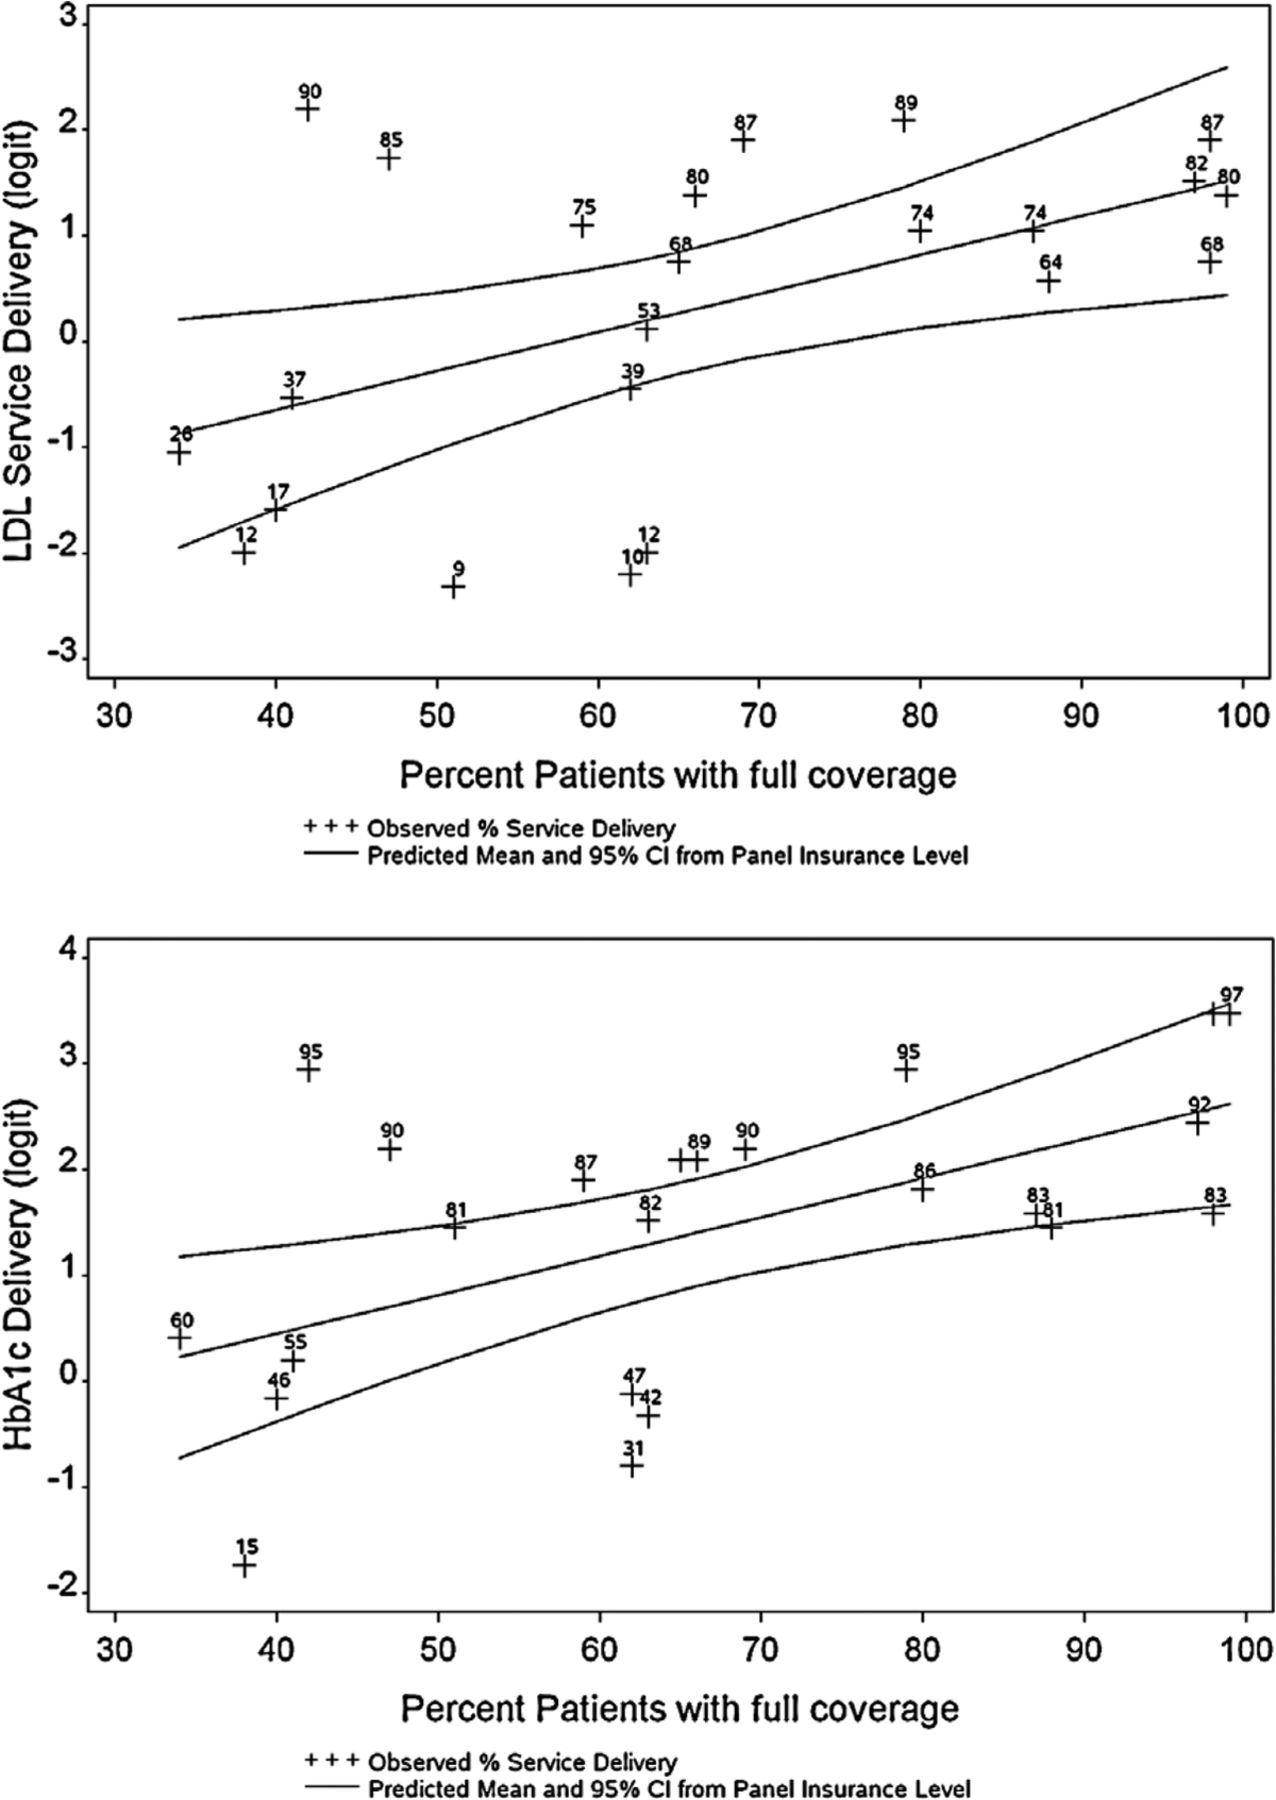
- Figure 3.
Observed rates of diabetes preventive services by clinic compared with rates predicted by the percentage of each clinic's patient panel with full insurance coverage. Note that predicted values and 95% confidence intervals (CIs) were estimated from regression models of the delivery of preventive service rates on the percentage of patient panel with full insurance coverage. The model used logit-transformed rates to keep the predicted rates bounded between 0% and 100%. Graphed values are the logit transformed values (y-axis) of observed values labeled with the actual rates (percentages) to facilitate interpretation. HbA1c, hemoglobin A1c; LDL, low-density lipoprotein cholesterol.


Tables
Patient Characteristics Patients, % (n = 4019) Clinic Panel Summary (n = 23 clinics) Full Panels* Restricted Panels† Mean (SD) Median (Range) Mean (SD) Median (Range) Mean age, years (SD) 55.8 (12.9) 53.7 (2.9) 53.9 (48.3–59.0) 53.8 (3.1) 53.7 (48.1–60.1) Minority race‡ 11.1 22.0 (19.8) 16.0 (2.0–76.0) 21.9 (19.6) 16.0 (2.0–76.0) English-speaking 58.8 60.6 (22.9) 58.9 (12.6–100) 61.7 (22.2) 58.8 (12.6–100) Spanish-speaking 32.1 33.2 (23.1) 28.3 (0–87.4) 32.0 (22.2) 27.6 (0–87.4) No Insurance 28.6 28.6 (19.0) 30.0 (1.0–57.0) 28.5 (18.3) 30.0 (2.0–56.0) Continuous Insurance 66.2 66.4 (21.1) 63.0 (34.0–99.0) 66.3 (20.6) 64.0 (34.0–98.0) Income <50% of FPL 29.4 36.9 (19.7) 31.0 (10.0–87.0) 29.6 (13.7) 31.0 (6.0–66.3) ↵* Includes all diabetic patients meeting inclusion criteria of at least 1 visit in 2006 and 2007; 425 patients were included in multiple clinic panels.
↵† Each patient assigned to only one clinic denominator.
↵‡ Any patient with a race other than “white.” This includes black, Asian, Native American, Pacific Islander, nonwhite, and “other race.”
FPL, Federal poverty level; SD, standard deviation.
- Table 2. Correlations Between Clinic-Level Percentages of Patients Provided Diabetes-Related Preventive Services and Clinic-Level Patient Panel Characteristics
Clinic Patient Panel Characteristics Correlation of Clinic-Level Patient Panel Characteristic with Delivery of Diabetic Preventive Services Full Patient Panel* Restricted Patient Panel† LDL FLU Micro-Alb HbA1c LDL FLU Micro-Alb HbA1c Mean age 0.40 0.48‡ 0.14 0.42‡ 0.38 0.48‡ 0.21 0.37 Minority race§ 0.22 0.15 0.73‡ 0.21 0.22 0.22 0.68‡ 0.24 English-speaking 0.11 −0.15 0.05 0.08 0.19 −0.16 0.05 0.11 Spanish-speaking −0.11 0.07 −0.37 0.03 −0.16 0.04 −0.31 0.02 No insurance −0.45‡ −0.61‡ −0.03 −0.54‡ −0.44‡ −0.52‡ −0.11 −0.48‡ Continuous insurance 0.46‡ 0.60‡ 0.04 0.55‡ 0.45‡ 0.53‡ 0.08 0.48‡ Income <50% of FPL −0.01 0.45‡ −0.17 0.13 −0.03 0.41‡ −0.11 0.10 Data are Spearman rank correlation coefficients.
↵* This includes all diabetic patients meeting inclusion criteria of at least 1 visit in 2006 and 2007; 425 patients were included in multiple clinic panels.
↵† Each patient assigned to only one clinic denominator.
↵‡ P < .05.
↵§ Any patient with a race other than white. This includes black, Asian, Native American, Pacific Islander, nonwhite, and “other race.”
FDL, Federal poverty level; FLU, influenza vaccination; HbA1c, hemoglobin A1c monitoring; LDL, low-density lipoprotein cholesterol screening; Micro-Alb, urine microalbumin screening.
- Table 3. Proportion of Variability in Clinic-Level Percentages of Patients Provided Diabetes-Related Preventive Services Accounted for by Clinic-Level Patient Panel Characteristics
Clinic Patient Panel Characteristics Full Patient Panel* Restricted Patient Panel† LDL FLU Micro-Alb HbA1c LDL FLU Micro-Alb HbA1c Model r2‡ Mean age 0.21§ 0.12 0.01 0.20§ 0.22§ 0.16 0.02 0.30§ Minority race‖ 0.12 0.06 0.55§ 0.08 0.12 0.06 0.51§ 0.02 English-speaking 0.02 0.10 0.01 0.01 0.04 0.06 0.01 0.02 Spanish-speaking 0.03 0.03 0.08 <0.01 0.06 0.01 0.08 0.01 No insurance 0.25§ 0.18§ <0.01 0.29§ 0.25§ 0.18§ <0.01 0.25§ Continuous insurance 0.26§ 0.18§ <0.01 0.31§ 0.25§ 0.18§ <0.01 0.28§ Income <50% of FPL 0.04 0.15 0.02 0.06 0.03 0.15 0.01 0.08 Change in model r2¶ Mean age 0.01 <0.01 0.02 <0.01 0.02 0.02 0.03 0.05 Minority‖ 0.13§ 0.07 0.55§ 0.10 0.12 0.06 0.48§ 0.02 English-speaking 0.01 0.07 0.01 <0.01 0.01 0.11 0.01 <0.01 Spanish-speaking 0.01 0.08 0.09 0.01 0.01 0.07 0.05 0.02 Average income <50% of FPL 0.02 0.03 0.03 0.02 0.02 0.02 <0.01 0.03 Values were estimated using regression models of the logit transformation of the percentage of the patient panel receiving services.
↵* Includes all diabetic patients meeting inclusion criteria of at least 1 visit in 2006 and 2007; 425 patients were included in multiple clinic panels.
↵† Each patient was assigned to only one clinic denominator.
↵‡ Proportion of variability accounted for by clinic-level patient panel characteristics (unadjusted).
↵§ P < .05.
↵‖ Any patient with a race other than “white.” This includes black, Asian, Native American, Pacific Islander, nonwhite, and “other race.”
↵¶ The difference between the r2 of a model containing the listed patient characteristic and the percentage of patients with continuous insurance and the r2 of a model containing only the percentage of patients with continuous coverage. Changes in r2 were not reported for the percentage of patients with no insurance because of the high correlation of the measure with the percentage of patients continuously insured.
FPL, Federal poverty level; FLU, influenza vaccination; HbA1c, hemoglobin A1c monitoring; LDL, low-density lipoprotein cholesterol screening; Micro-Alb, urine microalbumin screening.
- Appendix Table 1. Dependent Variable: Logit Transformed Percentage of Patients With Low-Density Lipoprotein Screening
Variables in Model DF Parameter Estimate Standard Error t Value Pr > t Squared Semipartial Correction, Type I Model r2 Model Pr > t Intercept 1 −2.10870 0.93713 −2.25 0.0353 — 0.2599 0.0130 Patients with full coverage (%) 1 0.03658 0.01347 2.72 0.0130 0.2599 Intercept 1 −5.97023 7.56967 −0.79 0.4395 — 0.2695 0.0433 Patients with full coverage (%) 1 0.02768 0.02208 1.25 0.2244 0.25987 Mean age 1 0.08296 0.16134 0.51 0.6127 0.00966 Intercept 1 −2.81469 0.93099 −3.02 0.0067 — 0.3944 0.0066 Patients with full coverage (%) 1 0.03796 0.01251 3.04 0.0065 0.25987 Minority (%) 1 0.02799 0.01328 2.11 0.0479 0.13451 Intercept 1 −2.38941 1.16285 −2.05 0.0532 — 0.2665 0.0451 Patients with full coverage (%) 1 0.03584 0.01385 2.59 0.0176 0.25987 English speakers 1 0.00609 0.01436 0.42 0.6761 0.00659 Intercept 1 −1.86300 1.14844 −1.62 0.1204 — 0.2654 0.0458 Patients with full coverage (%) 1 0.03537 0.01411 2.51 0.0209 0.25987 Spanish speakers 1 −0.00497 0.01286 −0.39 0.7030 0.00549 Intercept 1 −3.03195 11.25567 −0.27 0.7904 0.2601 0.0492. Patients with full coverage (%) 1 0.04596 0.11475 0.40 0.6930 0.25987 Patients with no coverage (%) 1 0.01049 0.12747 0.08 0.9352 0.00025072 Intercept 1 −2.13305 0.94599 −2.25 0.0355 — Patients with full coverage (%) 1 0.04513 0.01734 2.60 0.0170 0.25987 0.2825 0.0362 Patients at <50% of the FPL (%) 1 −0.01474 0.01858 −0.79 0.4367 0.02260 FPL, Federal poverty level; DF, degrees of freedom; Pr, probability.
- Appendix Table 2. Dependent Variable: Logit Transformed Proportion of Patients With Influenza Immunizations
Variables in Model DF Parameter Estimate Standard Error t Value Pr > t Squared Semipartial Correction Type I Model r2 Model Pr > t Intercept 1 −1.48987 0.55458 −2.69 0.0138 — 0.1759 0.0463 Patients with full coverage (%) 1 0.01688 0.00797 2.12 0.0463 0.1759 Intercept 1 −1.90687 4.50817 −0.42 0.6768 — 0.1763 0.1438 Patients with full coverage (%) 1 0.01592 0.01315 1.21 0.2402 0.17593 Mean age 1 0.00896 0.09609 0.09 0.9266 0.00035809 Intercept 1 −1.78215 0.58135 −3.07 0.0061 — 0.2492 0.0569 Patients with full coverage (%) 1 0.01745 0.00781 2.23 0.0370 0.17593 Minority (%) 1 0.01159 0.00829 1.40 0.1776 0.07330 Intercept 1 −0.77608 0.63184 −1.23 0.2336 — 0.3115 0.0239 Patients with full coverage (%) 1 0.01876 0.00753 2.49 0.0216 0.17593 English speakers 1 −0.01548 0.00780 −1.98 0.0611 0.13554 Intercept 1 −2.00623 0.64945 −3.09 0.0058 — 0.2531 0.0540 Patients with full coverage (%) 1 0.01942 0.00798 2.44 0.0244 0.17593 Spanish speakers (%) 1 0.01045 0.00727 1.44 0.1661 0.07714 Intercept 1 1.40769 6.63027 0.21 0.8340 — 0.1838 0.1312 Patients with full coverage (%) 1 −0.01255 0.06759 −0.19 0.8546 0.17593 Patients with no coverage (%) 1 −0.03294 0.07509 −0.44 0.6656 0.00785 Intercept 1 −1.47500 0.55926 −2.64 0.0158 — 0.1511 0.0668 Patients with full coverage (%) 1 0.01166 0.01025 1.14 0.2687 0.17593 Patients <50% of the FPL 1 0.00900 0.01098 0.82 0.4222 0.02677 FPL, Federal poverty level; DF, degrees of freedom; Pr, probability.
- Appendix Table 3. Dependent Variable: Logit Transformed Proportion of Patients With Microalbumin Screening
Variables in Model DF Parameter Estimate Standard Error t Value Pr > t Squared Semipartial Correction Type I Model r2 Model Pr > t Intercept 1 −0.80068 0.85494 −0.94 0.3596 — 0.0002 0.9460 Patients with full coverage (%) 1 −0.000842 0.01229 −0.07 0.9460 0.0002 Intercept 1 −5.55183 6.86835 −0.81 0.4284 — 0.0240 0.7847 Patients with full coverage (%) 1 −0.01179 0.02004 −0.59 0.5627 0.00022384 Mean age 1 0.10208 0.14639 0.70 0.4936 0.02373 Intercept 1 −1.92182 0.62939 −3.05 0.0063 — 0.5508 0.0003 Patients with full coverage (%) 1 0.00134 0.00845 0.16 0.8756 0.00022384 Minority (%) 1 0.04446 0.00898 4.95 <0.0001 0.55054 Intercept 1 −1.08379 1.05981 −1.02 0.3187 — 0.0111 0.8943 Patients with full coverage (%) 1 −0.00159 0.01263 −0.13 0.9011 0.00022384 English speakers (%) 1 0.00614 0.01309 0.47 0.6440 0.01088 Intercept 1 −0.01970 1.00313 −0.02 0.9845 — 0.0903 0.3881 Patients with full coverage (%) 1 −0.00469 0.01232 −0.38 0.7076 0.00022384 Spanish speakers (%) 1 −0.01581 0.01123 −1.41 0.1747 0.09009 Intercept 1 4.83163 10.19224 0.47 0.6406 — 0.0154 0.8565. Patients with full coverage (%) 1 −0.05805 0.10391 −0.56 0.5826 0.00022384 Patients with no coverage (%) 1 −0.06402 0.11543 −0.55 0.5853 0.01514 Intercept 1 −0.82151 0.86467 −0.95 0.3534 0.0271 0.7601 Patients with full coverage (%) 1 0.00647 0.01585 0.41 0.6875 0.00022384 Patients at <50% of the FPL 1 −0.01261 0.01698 −0.74 0.4663 0.02684 FPL, Federal poverty level; DF, degrees of freedom; Pr, probability.
- Appendix Table 4. Dependent Variable: Logit Transformed Proportion Patients with hemoglobin A1c (HbA1c) Screening
Variables in Model DF Parameter Estimate Standard Error t Value Pr > t Squared Semipartial Correction Type I Model r2 Model Pr > t Intercept 1 −1.02384 0.82457 −1.24 0.2280 — 0.3142 0.0054 Patients with full coverage (%) 1 0.03677 0.01185 3.10 0.0054 0.3142 Intercept 1 −1.24385 6.70415 −0.19 0.8547 — 0.3142 0.0230 Patients with full coverage (%) 1 0.03626 0.01956 1.85 0.0786 0.31415 Mean age 1 0.00473 0.14289 0.03 0.9739 0.00003752 Intercept 1 −1.58413 0.83595 −1.90 0.0726 — 0.4156 0.0046 Patients with full coverage (%) 1 0.03786 0.01123 3.37 0.0030 0.31415 Minority (%) 1 0.02222 0.01193 1.86 0.0772 0.10140 Intercept 1 −1.17650 1.02601 −1.15 0.2650 — 0.3165 0.0223 Patients with full coverage (%) 1 0.03636 0.01222 2.97 0.0075 0.31415 English speakers (%) 1 0.00331 0.01267 0.26 0.7965 0.00233 Intercept 1 −1.35043 1.00564 −1.34 0.1944 — 0.3258 0.0194 Patients with full coverage (%) 1 0.03837 0.01235 3.11 0.0056 0.31415 Spanish speakers (%) 1 0.00661 0.01126 0.59 0.5637 0.01162 Intercept 1 −8.84931 9.74844 −0.91 0.3748 — 0.3357 0.0167 Patients with full coverage (%) 1 0.11625 0.09938 1.17 0.2558 0.31415 Patients with no coverage (%) 1 0.08895 0.11040 0.81 0.4299 0.02156 Intercept 1 −1.04339 0.83456 −1.25 0.2256 — 0.3316 0.0178 Patients with full coverage (%) 1 0.04363 0.01530 2.85 0.0099 0.31415 Patients at <50% of the FPL (%) 1 −0.01184 0.01639 −0.72 0.4784 0.01744 FPL, Federal poverty level; DF, degrees of freedom; Pr, probability.
In this issue


Jump to section
Related Articles
Cited By...
- The Psychosocial Needs of Patients Participating in Diabetes Shared Medical Appointments
- The Psychosocial Needs of Patients Participating in Diabetes Shared Medical Appointments
- The Impact of Social and Clinical Complexity on Diabetes Control Measures
- The Impact of the Affordable Care Act (ACA) Medicaid Expansion on Visit Rates for Diabetes in Safety Net Health Centers
- Uninsured Primary Care Visit Disparities Under the Affordable Care Act
- Using Geographic Information Systems (GIS) to Identify Communities in Need of Health Insurance Outreach: An OCHIN Practice-based Research Network (PBRN) Report
- Family Physicians Improve Patient Health Care Quality and Outcomes