
Article Figures & Data
Figures
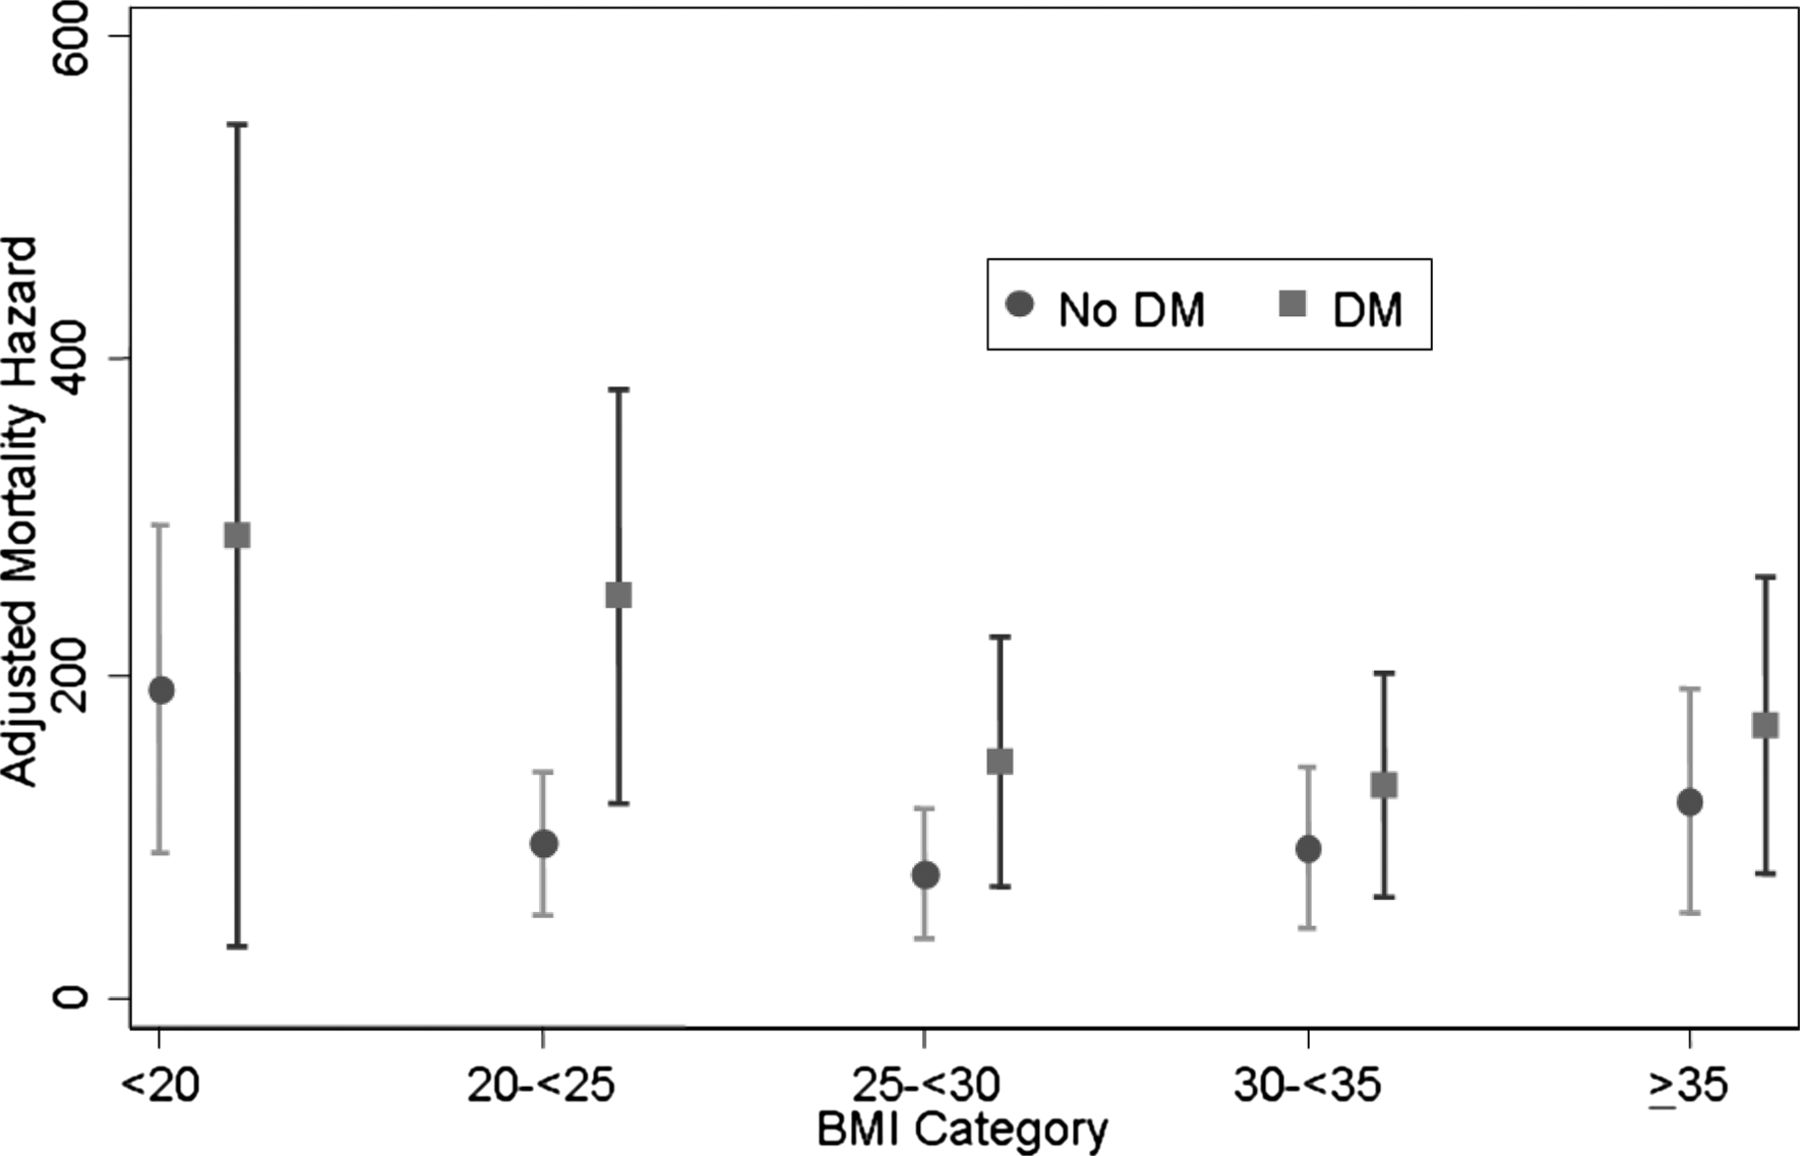
- Figure 1.
Adjusted mortality hazard among individuals without and with diabetes, by body mass index category. Bars around point estimates indicate 95% confidence interval. Analyses have been adjusted for sociodemographic characteristics (age, sex, race/ethnicity, education, household income, health insurance status, urban versus rural residence, and Census region) and Medical Expenditure Panel Survey response year. BMI, body mass index (kg/m2); DM, diabetes mellitus.
Tables
Characteristic Body Mass Index Category Total (N = 50,994) <20 kg/m2 (n = 2673; 5.6%) 20–<25 kg/m2 (n = 15,612; 32.5%) 25–<30 kg/m2 (n = 18,299; 35.9%) 30–<35 kg/m2 (n = 9,098; 16.6%) ≥35 kg/m2 (n = 5312; 9.4%) Age (years) 18–29 32.1 (1.1) 22.5 (0.5) 15.6 (0.4) 13.9 (0.4) 13.9 (0.6) 18.3 (0.3) 30–39 19.4 (0.9) 20.5 (0.4) 19.3 (0.4) 19.7 (0.5) 21.3 (0.7) 19.9 (0.2) 40–49 15.7 (0.8) 19.7 (0.4) 22.2 (0.4) 23.4 (0.5) 24.7 (0.7) 21.4 (0.3) 50–59 9.9 (0.6) 14.8 (0.4) 18.0 (0.3) 19.8 (0.5) 21.1 (0.7) 17.1 (0.2) 60–69 7.0 (0.5) 9.2 (0.3) 11.9 (0.3) 12.3 (0.4) 11.4 (0.5) 10.8 (0.2) ≥70 15.9 (0.9) 13.3 (0.4) 12.9(0.4) 11.0 (0.4) 7.6 (0.5) 12.4 (0.3) Female 74.6 (1.1) 59.2 (0.4) 42.0 (0.4) 48.9 (0.6) 60.8 (0.8) 52.3 (0.2) Race/ethnicity White 75.1 (1.0) 74.5 (0.7) 72.8 (0.8) 69.5 (0.9) 67.2 (1.2) 72.4 (0.7) Hispanic 7.5 (0.6) 9.3 (0.4) 12.2 (0.6) 13.2 (0.8) 11.7 (0.9) 11.1 (0.5) Black 6.9 (0.6) 8.0 (0.4) 9.8 (0.4) 13.1 (0.6) 17.7 (1.0) 10.4 (0.4) Other 10.5 (0.8) 8.2 (0.4) 5.2 (0.3) 4.1 (0.3) 3.4 (0.4) 6.1 (0.3) Education Less than HS 6.2 (0.5) 5.5 (0.2) 7.3 (0.3) 7.3 (0.3) 6.6 (0.4) 6.6 (0.2) Some HS 11.0 (0.6) 9.5 (0.3) 10.5 (0.3) 12.9 (0.4) 14.4 (0.6) 10.9 (0.2) HS graduate 31.5 (1.2) 30.4 (0.5) 33.6 (0.5) 36.3 (0.7) 37.0 (1.0) 33.2 (0.4) Some college 23.0 (1.1) 23.7 (0.4) 21.8 (0.4) 23.5 (0.5) 25.8 (0.9) 23.2 (0.3) College graduate 27.9 (1.3) 30.9 (0.7) 26.8 (0.6) 20.0 (0.6) 16.2 (0.8) 26.1 (0.5) Income (% FPL) <100 13.3 (0.8) 9.9 (0.3) 8.9 (0.3) 10.7 (0.4) 14.0 (0.6) 10.3 (0.2) 100-<125 4.8 (0.5) 3.6 (0.2) 4.0 (0.2) 4.1 (0.3) 4.8 (0.3) 4.0 (0.1) 125-<200 15.0 (0.8) 12.8 (0.3) 13.1 (0.3) 13.3 (0.4) 15.2 (0.6) 13.3 (0.3) 200-<400 30.2 (1.0) 30.3 (0.6) 30.5 (0.4) 32.4 (0.6) 34.5 (0.9) 31.1 (0.3) ≥400 36.7 (1.3) 43.3 (0.7) 43.5 (0.6) 39.4 (0.8) 31.5 (1.0) 41.2 (0.6) Health insurance Private 69.9 (1.1) 75.1 (0.5) 74.7 (0.5) 73.9 (0.7) 68.6 (0.9) 73.9 (0.5) Public 16.1 (0.8) 12.3 (0.4) 12.9 (0.4) 14.1 (0.5) 17.8 (0.7) 13.6 (0.3) None 14.0 (0.8) 12.6 (0.4) 12.3 (0.4) 12.0 (0.5) 13.6 (0.6) 12.6 (0.3) Urban residence 81.8 (1.2) 82.8 (0.9) 81.2 (0.9) 79.4 (1.0) 77.9 (1.3) 81.2 (0.9) Census region Northeast 17.9 (1.2) 19.7 (1.0) 19.7 (1.0) 19.1 (1.0) 17.6 (1.0) 16.2 (1.1) Midwest 23.1 (1.2) 22.5 (1.0) 23.3 (1.0) 23.2 (1.1) 24.9 (1.2) 23.2 (0.9) South 36.1 (1.7) 34.8 (1.4) 36.0 (1.3) 38.9 (1.5) 41.5 (1.5) 36.6 (1.3) West 22.9 (1.7) 23.0 (1.4) 21.6 (1.4) 20.3 (1.3) 17.4 (1.6) 21.5 (1.3) Smoker 29.8 (1.0) 24.0 (0.4) 21.6 (0.4) 20.5 (0.5) 19.5 (0.7) 22.5 (0.3) Diabetes 1.9 (0.3) 3.5 (0.2) 6.4 (0.2) 11.2 (0.3) 18.2 (0.6) 7.1 (0.2) Hypertension 12.3 (0.7) 17.0 (0.4) 26.9 (0.5) 36.7 (0.6) 44.4 (0.9) 26.1 (0.3) Values provided are population-weighted percentages (standard errors in parentheses).
FPL, Federal Poverty Level; HS, high school.
- Table 2. Adjusted* Mortality by Body Mass Index Category, without and with Adjustment for Diabetes and Hypertension
Model Variables Model without Diabetes or Hypertension Model with Diabetes or Hypertension HR (95% CI) P HR (95% CI) P Age 1.09 (1.08–1.10) <.001 1.09 (1.08–1.09) <.001 Female 0.54 (0.47–0.62) <.001 0.54 (0.47–0.62) <.001 Race/ethnicity (reference = white) Hispanic 0.65 (0.54–0.78) <.001 0.62 (0.52–0.75) <.001 Black 1.26 (1.04–1.52) .02 1.18 (0.98–1.42) .09 Other 1.05 (0.80–1.39) .72 1.04 (0.79–1.37) .77 Education (reference = <high school) Some high school 0.99 (0.83–1.18) .91 0.98 (0.82–1.17) .85 High school graduate 0.83 (0.71–0.97) .02 0.85 (0.73–0.99) .03 Some college 0.76 (0.61–0.93) .009 0.78 (0.63–0.96) .02 College graduate 0.64 (0.52–0.80) <.001 0.67 (0.54–0.83) <.001 Income, % FPL (reference = <100% FPL) 100-<125 1.02 (0.76–1.37) .87 1.03 (0.77–1.37) .84 125-<200 0.98 (0.80–1.20) .84 0.97 (0.80–1.19) .79 200-<400 0.88 (0.74–1.05) .16 0.89 (0.74–1.06) .19 ≥400 0.77 (0.62–0.96) .02 0.78 (0.63–0.97) .02 Health insurance (reference = private) Public 1.30 (1.12–1.51) .001 1.26 (1.08–1.46) .003 None 1.08 (0.77–1.49) .66 1.13 (0.81–1.58) .46 Urban residence 0.89 (0.78–1.01) .07 0.89 (0.78–1.02) .09 Census region (reference = Northeast) Midwest 0.98 (0.82–1.17) .80 0.99 (0.83–1.18) .88 South 1.20 (1.02–1.40) .02 1.18 (1.01–1.36) .03 West 1.14 (0.96–1.35) .15 1.13 (0.95–1.34) .16 Smoker 1.71 (1.49–1.96) <.001 1.75 (1.52–2.00) <.001 Diabetes — — 1.80 (1.56–2.08) <.001 Hypertension — — 1.22 (1.07–1.38) .003 BMI category, kg/m2 (reference = 20–<25 kg/m2) <20 1.78 (1.44–2.20) <.001 1.90 (1.54–2.34) <.001 25-<30 0.80 (0.69–0.92) .002 0.75 (0.65–0.87) <.001 30-<35 0.93 (0.78–1.11) .44 0.81 (0.68–0.97) .02 ≥35 1.26 (1.00–1.59) .05 1.02 (0.80–1.30) .89 ↵* Analyses also adjusted for Medical Expenditure Panel Survey response year.
BMI, body mass index; CI, confidence interval; FPL, Federal Poverty Level; HR, hazard ratio.
- Table 3. Adjusted* Relationship Between Body Mass Index Category and Mortality, Including Interaction Between Body Mass Index and Diabetes
Model Variables HR (95% CI) P Age 1.09 (1.08–1.09) <.001 Female 0.54 (0.48–0.62) <.001 Race/ethnicity (reference = white) Hispanic 0.61 (0.50–0.74) <.001 Black 1.19 (0.98–1.43) .07 Other 1.04 (0.79–1.37) .78 Education (reference = <high school) Some high school 0.98 (0.83–1.17) .86 High school graduate 0.85 (0.73–0.98) .03 Some college 0.77 (0.63–0.95) .01 College graduate 0.66 (0.54–0.82) <.001 Income, % FPL (reference = <100% FPL) 100-<125 1.02 (0.76–1.36) .89 125-<200 0.98 (0.80–1.20) .82 200-<400 0.89 (0.74–1.06) .19 ≥400 0.78 (0.63–0.96) .02 Health insurance (reference = private) Public 1.27 (1.09–1.47) .002 None 1.12 (0.80–1.56) .51 Urban residence 0.89 (0.78–1.02) .09 Census region (reference = Northeast) Midwest 0.99 (0.83–1.18) .90 South 1.18 (1.02–1.38) .03 West 1.13 (0.95–1.34) .16 Smoker 1.74 (1.51–1.99) <.001 Diabetes 2.60 (2.00–3.38) <.001 BMI category, kg/m2 (reference = 20-<25 kg/m2) <20 2.00 (1.59–2.50) <.001 25-<30 0.80 (0.68–0.95) .01 30-<35 0.97 (0.78–1.19) .76 ≥35 1.27 (0.96–1.69) .10 Diabetes (present)*BMI interaction, kg/m2 <20 0.58 (0.24–1.40) .22 25-<30 0.73 (0.50–1.08) .11 30-<35 0.54 (0.36–0.81) .003 ≥35 0.53 (0.34–0.83) .006 ↵* Analyses also adjusted for Medical Expenditure Panel Survey response year.
BMI, body mass index; CI, confidence interval; FPL, Federal Poverty Level; HR, hazard ratio.
In this issue


Jump to section
Related Articles
Cited By...
- BMI and All-Cause Mortality in Normoglycemia, Impaired Fasting Glucose, Newly Diagnosed Diabetes, and Prevalent Diabetes: A Cohort Study
- BMI and all cause mortality: systematic review and non-linear dose-response meta-analysis of 230 cohort studies with 3.74 million deaths among 30.3 million participants
- J-shapedness: an often missed, often miscalculated relation: the example of weight and mortality
- Content Usage and the Most Frequently Read Articles by Issue in 2012
- Cardiovascular Diseases and Other Evidence for Primary Care Clinical Practice