
Article Figures & Data
Figures
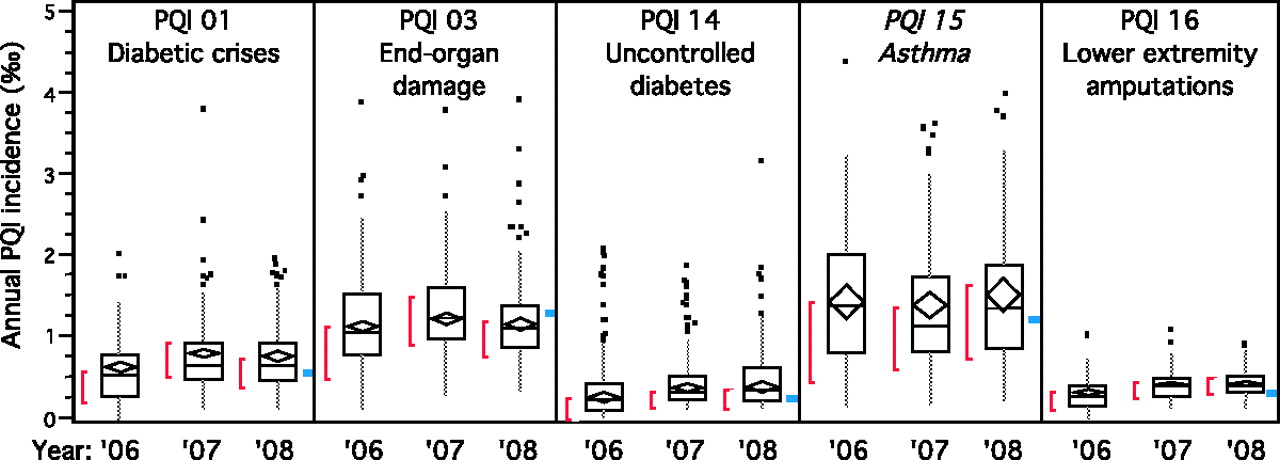
- Figure 1.
Annual incidence of five prevention quality indicators (PQIs) in Kentucky counties. Each box plot represents the distribution of 120 counties' PQI rates in a given year, from 2006 to 2008. Outlier points are dots. Tenth and 90th percentiles are endpoints of the gray line. The 25th to 75th percentile range is enclosed by the box. The median is the dividing line in the box. The mean and standard error of the mean are indicated by the diamond within the box. The red external bracket ([) indicates the most densely located half of data points. The blue mark indicates the national average in 2004.
- Figure 2.
Kentucky counties having prevention quality indicator (PQI) rates significantly different from the national average. High rate lines indicate the number of counties where the lower limit of the 95% CI for the local prevention quality indicator rate was higher than the 2004 national average. The low rate lines indicate the number of counties where the upper limit of the 95% CI was lower than the 2004 national average.
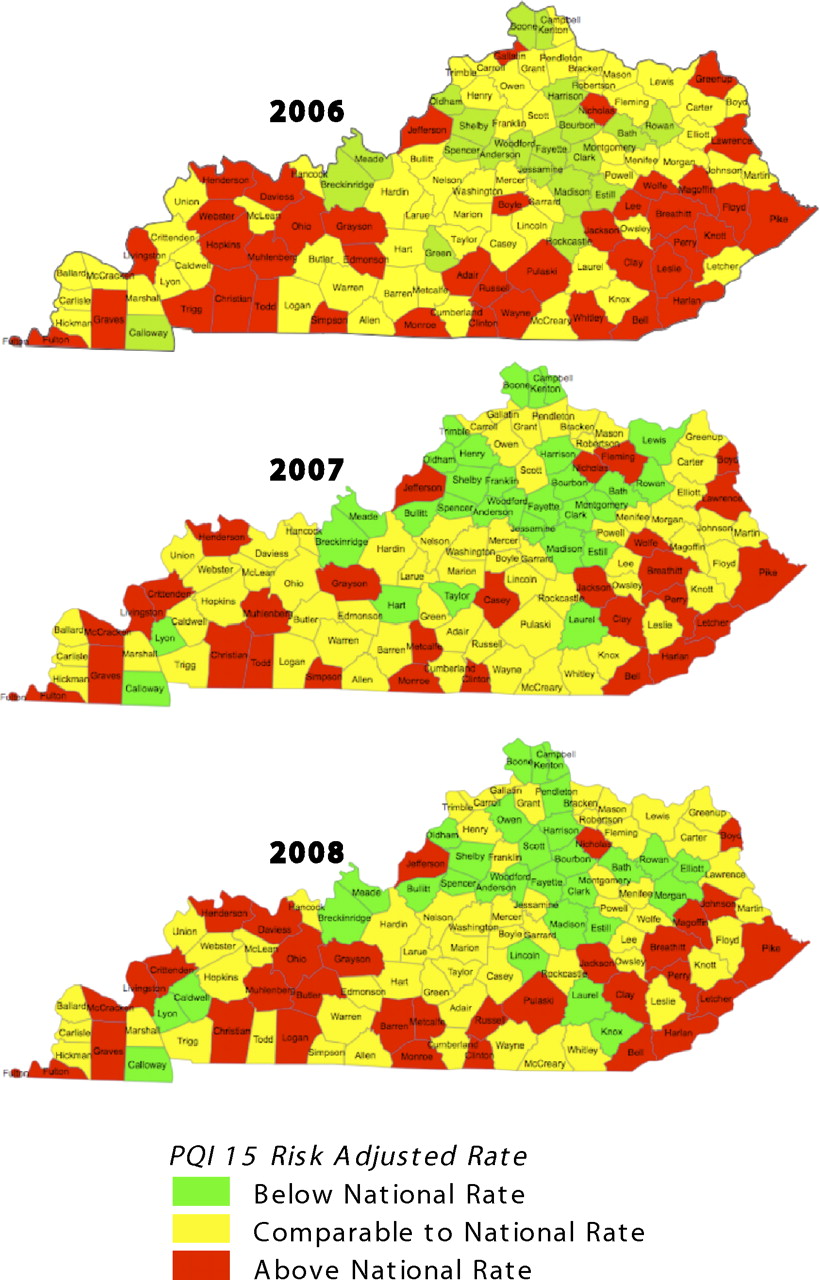
- Figure 3.
Serial prevention quality indicator (PQI) 15 (asthma) heat maps for Kentucky.


Tables
PQI Description Specification and Codes 1 Diabetes, short-term complications: admissions for diabetic short-term complications per 100,000 adults. All nonmaternal/nonneonatal discharges of patients aged ≥18 years with ICD-9-CM principal diagnosis codes for diabetes short-term complications (ketoacidosis, hyperosmolarity, coma) (250.10–250.33). Exclude cases: •Transferring from another institution •MDC 14 (pregnancy, childbirth, and puerperium) •MDC 15 (newborn and other neonates) 3 Diabetes, long-term complications: admissions for diabetic long-term complications per 100,000 adults. Discharges of patients aged ≥18 years with ICD-9-CM principal diagnosis codes for long-term complications of diabetes (renal, eye, neurological, circulatory, or complications not otherwise specified) (250.40–250.93). Exclude cases: •Transferring from another institution •MDC 14 (pregnancy, childbirth, and puerperium) •MDC 15 (newborn and other neonates) 14 Uncontrolled diabetes: admissions for uncontrolled diabetes per 100,000 adults. All nonmaternal discharges of patients aged ≥18 years with ICD-9-CM principal diagnosis codes for uncontrolled diabetes without mention of a short-term or long-term complication (250.02, 250.03). Exclude cases: •Transferring from another institution •MDC 14 (pregnancy, childbirth, and puerperium) •MDC 15 (newborn and other neonates) 15 Adult asthma: admissions for adult asthma per 100,000 adults. All nonmaternal discharges of patients aged ≥18 years with ICD-9-CM principal diagnosis codes for asthma (493.00–493.22, 493.80–493.92). Exclude cases: •Transferring from another institution •MDC 14 (pregnancy, childbirth, and puerperium) •MDC15 (newborn and other neonates) •With any diagnosis code of cystic fibrosis and anomalies of the respiratory system 16 Lower extremity amputations among patients with diabetes: admissions for lower-extremity amputation in patients with diabetes per 100,000 adults. All nonmaternal discharges of patients aged ≥18 years with ICD-9-CM procedure codes for lower-extremity amputation in any field (8410–8419) and diagnosis code for diabetes in any field (250.00–250.93). Exclude cases: •Transferring from another institution •MDC 14 (pregnancy, childbirth, and puerperium) •MDC 15 (newborn and other neonates) •With trauma diagnosis code in any field (895.0, 895.1,896.0–896.3, 897.0–897.7) -
ICD-9-CM, International Classification of Diseases, 9th revision, Clinical Modification; MDC, major diagnostic category.
-
- Table 2.
Spearman's Rho Values for County-level Prevention Quality Indicators Rates Between Prevention Quality Indicator Measures and Across Time
PQI 2006 2007 2008 1 3 14 15 16 1 3 14 15 16 1 3 14 15 3 0.30 2006 14 0.22 0.53* 15 0.19 0.49** 0.63*** 16 0.16 0.36* 0.14 0.15 1 0.54*** 0.22 0.17 0.19 0.17 3 0.16 0.55*** 0.46** 0.42* 0.28 0.25 2007 14 0.11 0.46** 0.72*** 0.56*** 0.16 0.12 0.37* 15 0.12 0.41* 0.53*** 0.77*** 0.21 0.24 0.41* 0.51** 16 0.12 0.24 0.15 0.05 0.25 0.07 0.49** 0.04 0.05 1 0.37* 0.26 0.20 0.10 0.17 0.50** 0.16 0.03 0.18 0.16 3 0.14 0.49* 0.38* 0.33 0.18 0.31 0.52** 0.38* 0.27 0.10 0.25 2008 14 0.06 0.43* 0.66*** 0.55*** 0.18 0.14 0.43* 0.65*** 0.49** 0.08 0.21 0.38* 15 0.19 0.40* 0.52** 0.77*** 0.09 0.22 0.46** 0.47** 0.77*** 0.06 0.22 0.37* 0.56*** 16 0.11 −0.05 0.11 0.09 0.23 0.17 0.11 0.15 0.21 0.09 0.13 0.14 0.06 0.10 -
Each cell shows Spearman's rho for the correlation between the prevention quality indicators (PQIs) and years of measurement indicated by the row and column, using each of the 120 Kentucky counties as an observation. Cells with underlines indicate the same PQI correlated with itself in different years. Cells with asterisks indicate a P < .0001. The asterisks (from 1 to 3) indicate tertiles of increasingly strong correlation with increasing darkness.
-


