
Article Figures & Data
Figures
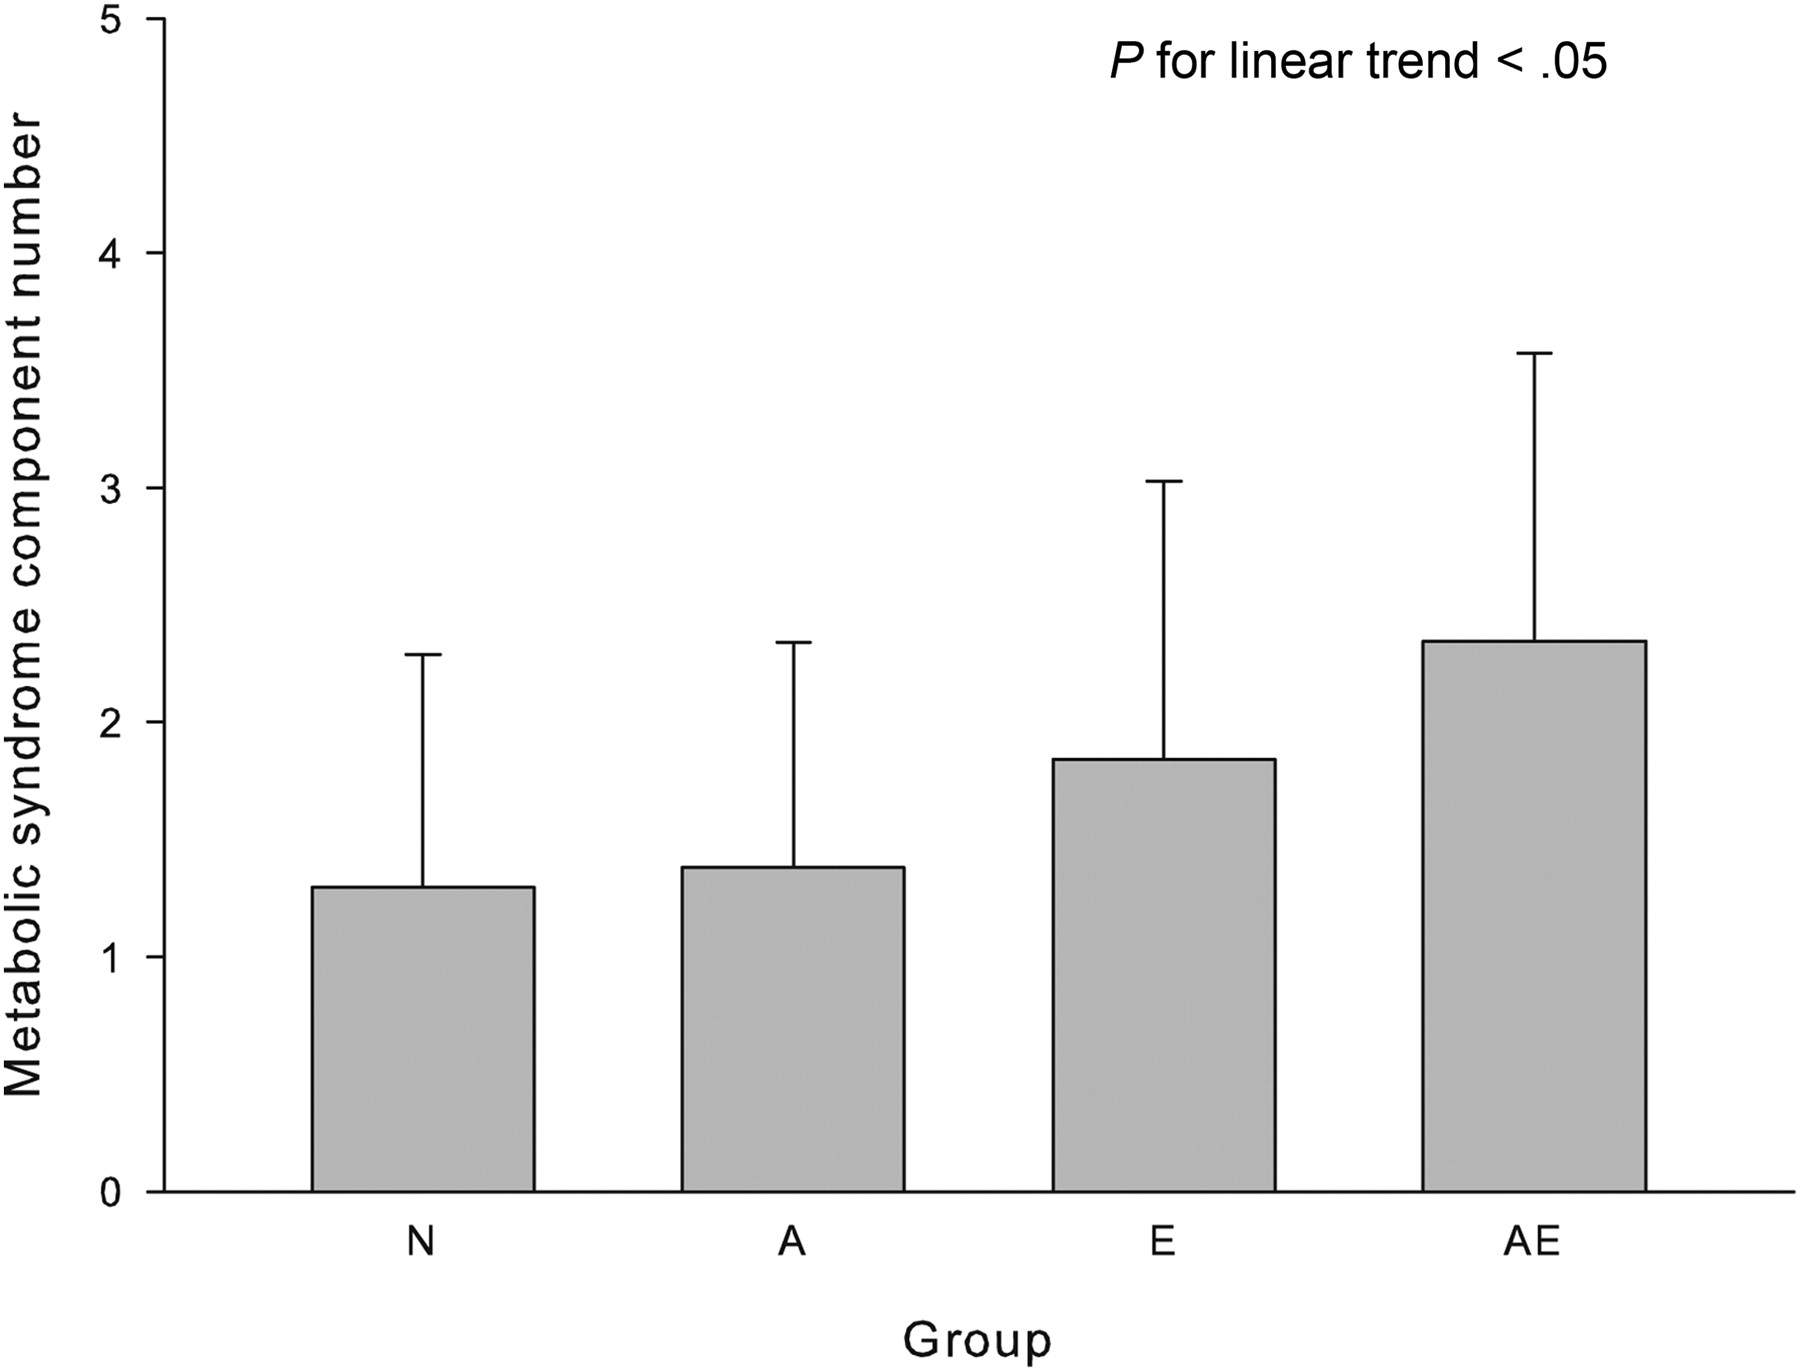
- Figure 1.
This graph shows the mean of the number of metabolic syndrome components among the 4 groups. The Y axis shows the number of the metabolic syndrome components and the X axis shows the 4 different groups. Group N: normal alanine aminotransferase (ALT) and liver echogenicity; group A: elevated ALT and normal liver echogenicity; group E: normal ALT and abnormal liver echogenicity; group AE: elevated ALT and abnormal liver echogenicity.
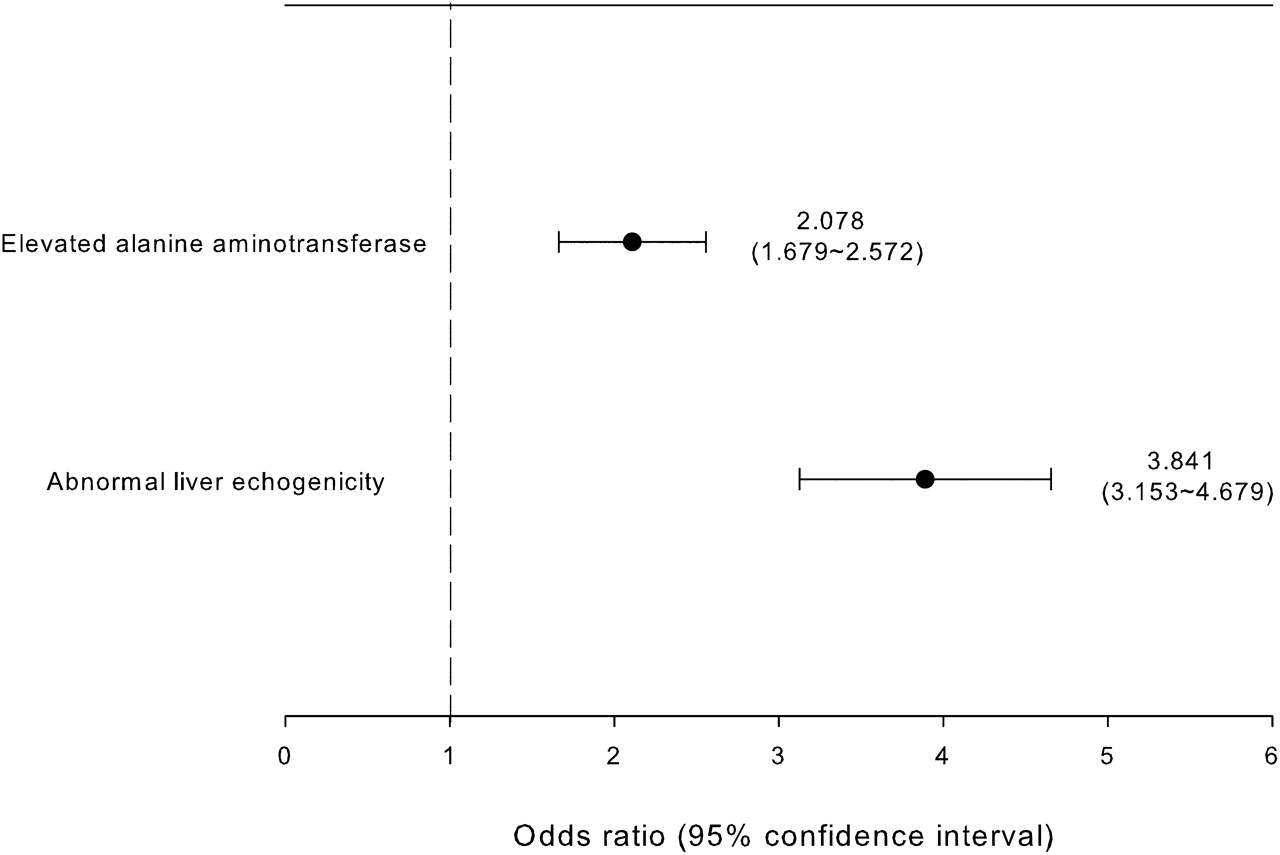
- Figure 2.
This graph shows the odds ratio of having metabolic syndrome among subjects with normal and elevated alanine aminotransferase (e-ALT) (upper line), and among subjects with normal and abnormal liver echogenicity (ab-echo) (lower line). The numbers of patients with normal and e-ALT were 2609 and 456, respectively; patients who had normal and ab-echo were 1338 and 1727, respectively. It should be noted that the comparison between patients with normal and e-ALT (upper line) did not consider whether they had ab-echo. Similarly, the comparison between patients with normal and ab-echo (lower line) did not consider whether they had e-ALT. In other words, only one abnormality was evaluated at a time.
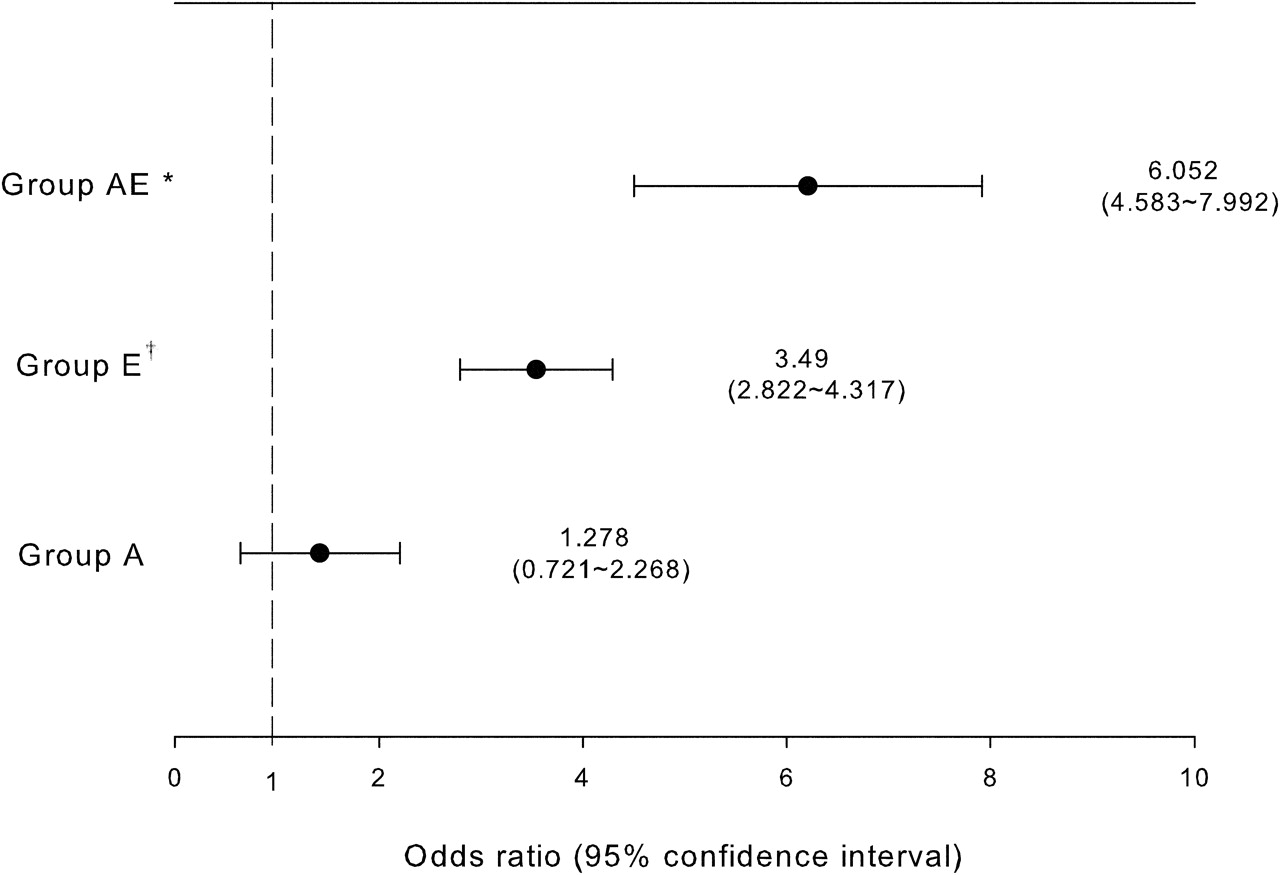
- Figure 3.
Odds ratio for having metabolic syndrome between different groups. The upper line shows group AE compared with group N; the middle line shows group E compared with group N; and the lower line shows group A compared with group N. Group N: normal alanine aminotransferase (ALT) and liver echogenicity; group A: elevated ALT and normal liver echogenicity; group E: normal ALT and abnormal liver echogenicity; group AE: elevated ALT and abnormal liver echogenicity. All have a significance of P < .05. *Odds ratio, 1.734 (95% CI, 1.361–2.209) between groups AE and E; †Odds ratio, 2.73 (95% CI, 1.565–4.763) between groups E and A.


Tables
- Table 1.
The Anthropometric and Metabolic Variables of Patients With or Without Metabolic Syndrome
MetS(−) MetS(+) P Power† n 2351 714 Age (years) 70.2 ± 4.8 70.3 ± 5.0 .577 0.086 Body mass index (kg/m2) 22.7 ± 2.8 25.6 ± 2.7 <.001 1.000 Waist circumference (cm) 81.5 ± 7.9 91.0 ± 7.3 <.001 1.000 Systolic blood pressure (mm Hg) 130.0 ± 19.5 141.1 ± 17.1 <.001 1.000 Diastolic blood pressure (mm Hg) 74.2 ± 11.1 80.3 ± 11.0 <.001 1.000 Fasting plasma glucose (mg/dL) 100.8 ± 16.3 113.0 ± 27.0 <.001 1.000 Total cholesterol (mg/dL) 198.4 ± 33.2 204.3 ± 36.2 <.001 0.981 HDL-C (mg/dL) 54.4 ± 14.0 42.9 ± 10.7 <.001 1.000 LDL-C (mg/dL) 124.0 ± 30.2 127.5 ± 32.5 .009 0.772 Log TG 1.96 ± 0.18 2.19 ± 0.18 <.001 1.000 Liver echogenicity (abdominal sonogram)* 49% 79% <.001 1.000 AST (U/L) 26.1 ± 16.5 26.9 ± 15.2 .241 0.216 ALT (U/L) 24.4 ± 22.4 28.6 ± 18.3 <.001 0.995 Data are shown as mean ± SD.
* χ2 test was used.
† The retrospective power of an independent sample t test was calculated using SPSS general linear model procedures and that of the χ2 test was obtained using G*Power 3.00.10 software (Heinrich Heine, University of Dusseldorf, Germany).
MetS(−), without metabolic syndrome; MetS(+), with metabolic syndrome; HDL-C, high-density lipoprotein cholesterol; LDL-C, low-density lipoprotein cholesterol; Log TG, log transformation of triglyceride; AST, aspartate aminotransferase; ALT, alanine aminotransferase.
- Table 2.
Components of Metabolic Syndrome in Different Groups According to Alanine Aminotransferase Level and Liver Echogenicity
Group N Group A Group E Group AE P Power‖ n 1228 110 1381 346 Age (years) 70.6 ± 5.1‡§ 70.5 ± 5.1 70.0 ± 4.7* 69.5 ± 4.6* .001 0.952 BMI (kg/m2) 22.1 ± 2.6‡§ 22.4 ± 2.8‡§ 24.1 ± 2.9*†§ 25.0 ± 2.9*†‡ <.001 1.000 Waist (cm) 80.0 ± 7.9‡§ 80.5 ± 7.9‡§ 86.0 ± 8.3*†§ 88.6 ± 8.0*†‡ <.001 1.000 SBP (mm Hg) 130.7 ± 20.3‡§ 130.4 ± 19.2 133.7 ± 19.0* 135.4 ± 18.1* <.001 0.992 DBP (mm Hg) 74.1 ± 11.2‡§ 74.1 ± 10.7§ 76.5 ± 11.3* 77.8 ± 11.3*† <.001 1.000 FPG (mg/dL) 100.1 ± 13.8‡§ 103.2 ± 24.4§ 105.3 ± 22.4*§ 109.5 ± 24.2*†‡ <.001 1.000 TC (mg/dL) 197.3 ± 33.6‡§ 193.2 ± 37.3§ 201.3 ± 33.3* 204.6 ± 36.2*† <.001 0.977 HDL-C (mg/dL) 54.9 ± 14.7‡§ 54.6 ± 14.9‡§ 49.8 ± 13.1*†§ 47.3 ± 13.8*†‡ <.001 1.000 LDL-C (mg/dL) 122.9 ± 30.0‡ 117.8 ± 36.0‡§ 126.4 ± 30.3*† 127.6 ± 32.7† .001 0.951 Log TG 1.95 ± 0.18‡§ 1.97 ± 0.20‡§ 2.05 ± 0.20*†§ 2.12 ± 0.21*†‡ <.001 1.000 Data are shown as mean ± SD. Group N: normal ALT and liver echogenicity; group A: elevated ALT and normal liver echogenicity; group E: normal ALT and abnormal liver echogenicity; group AE: elevated ALT and abnormal liver echogenicity.
* P < .05 against group N.
† P < .05 against group A.
‡ P < .05 against group E.
§ P < .05 against group AE.
‖ The retrospective power of one-way analysis of variance was calculated using SPSS general linear model procedures.
BMI: body mass index; SBP: systolic blood pressure; DBP: diastolic blood pressure; FPG: fasting plasma glucose; TC: total cholesterol; HDL-C: high-density lipoprotein cholesterol; LDL-C: low-density lipoprotein cholesterol; Log TG: log transformation of triglyceride.


