
Article Figures & Data
Figures
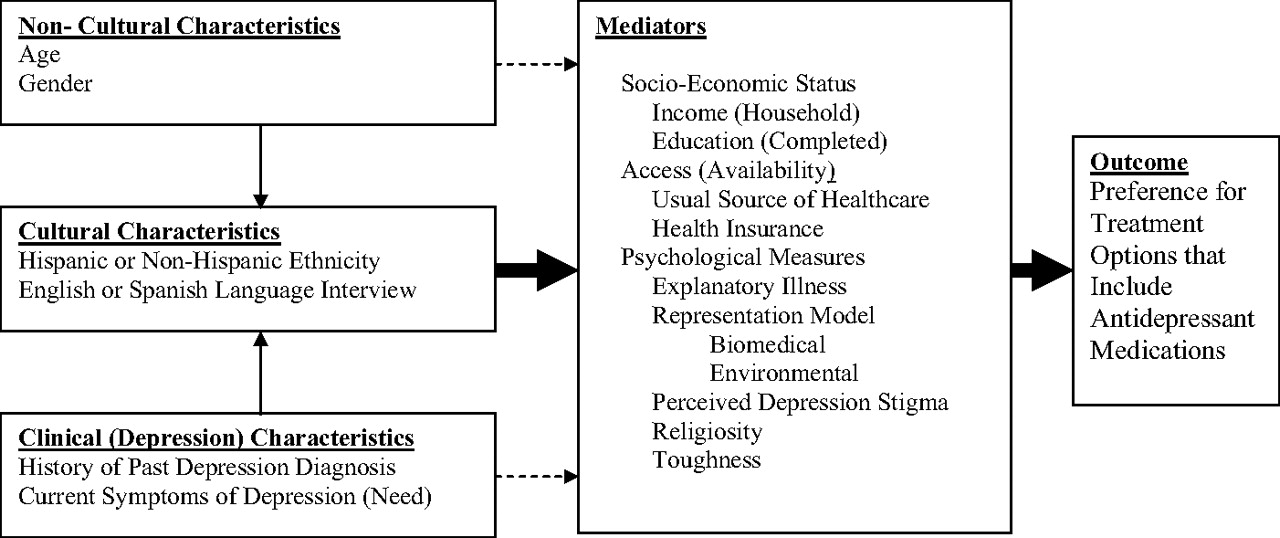
- Figure 1.
Hypothesized relationship of respondent characteristics and mediators of preferences for treatment options that include antidepressant medications.

Tables
Biomedical explanatory illness representation model of depression (α = 0.73) Clinical depression is a real medical illness.
Chemical imbalances in the brain cause depression.
Clinical depression is as serious as other long-lasting medical conditions like diabetes or heart disease.
Depression can contribute to physical symptoms like pain or headaches.
People with depression should be able to pull themselves out of it without professional help.
Most people with depression can fully recover on their own by participating in activities such as exercise, meditation, and socializing with friends and family.
Environmental explanatory illness representation model of depression (α = 0.62) Depression is the result of problems in living, such as job stress, money problems, or conflicts with family.
Clinical depression is caused by bad experiences in a person's past such as abuse, neglect, or trauma.
Perceived depression stigma (α = 0.54) I would be embarrassed if my friends knew I was getting professional help for an emotional problem.
If I had depression, my family would be disappointed with me.
I would not want my employer to know I was getting professional help for an emotional problem.
Religiosity (α = 0.87) How often do you attend religious services? (never, barely, sometimes, often)
When you do have problems or difficulties in your work, family or personal life, how often do you seek spiritual comfort? (never, barely, sometimes, often)
In general how important are religious or spiritual beliefs in your day-to-day life? (not at all, only somewhat important, very important, extremely important)
In general how religious would you say you are? (not at all religious, only somewhat religious, very religious, extremely religious)
Toughness (α = 0.63) A person should always try to project an air of confidence even if they really do not feel confident inside.
A good motto to live by is, When the going gets tough, the tough get going.
When people are feeling a little pain, they should try not to let it show very much.
People must stand on their own 2 feet and never depend on other people to help them do things.
The level of agreement with each item was rated on a 5-point Likert scale (1 = strongly agree, 5 = strongly disagree) for all of the measures except religiosity. Responses were reverse coded if necessary so that higher scale scores indicated greater levels of the given psychological construct.
Characteristic Ethnicity, Interview Language* Non-Hispanic White, English Hispanic, English Hispanic, Spanish P† Totals (n [%]) 839 (73) 92 (15) 47 (11) NA Age (years)§ 50.9 (1) 44.1 (2.5) 42 (3.5) <.01 Male sex‡ 46.5 (2.6) 39.9 (7.9) 21.5 (7.5) .03 History of depression diagnosis‡ 15.4 (1.2) 18.4 (4.1) 11.5 (3.9) .46 PHQ 9 score (range of sums, 0–27)§ 3.3 (0.2) 3.4 (0.4) 6.7 (1) <.01 Biomedical explanatory model (range of means, 1–5)§ 4 (<0.1) 3.8 (<0.1) 3.5 (<0.1) <.01 Environmental explanatory model (range of means, 1–5)§ 4 (<0.1) 4 (<0.1) 4.1 (0.1) .81 Stigma scale (range of sums, 3–15)§ 7.6 (0.1) 8.1 (0.4) 7.9 (0.3) .33 Religiosity scale (range of sums, 4–16)§ 9.4 (0.2) 10.9 (0.5) 11.5 (0.6) <.01 Toughness scale (range of sums, 4–20)§ 12.3 (0.1) 12.7 (0.4) 13.9 (0.6) .02 Education (years completed) <12‡ 2.3 (0.8) 14.2 (7.4) 56.9 (10.2) <.01 12‡ 14.5 (2.1) 26.5 (7.7) 12.0 (4.8) 13 to 15‡ 28.5 (2.3) 27.5 (5.9) 21.4 (10.2) 16‡ 29.8 (2.3) 14.0 (4.4) 1.5 (1.2) >16‡ 24.9 (2.1) 17.8 (5.9) 8.2 (5.1) Income ($) <20,000‡ 8.4 (1.2) 9.7 (2.9) 50.1 (10.2) <.01 20,000–34,999‡ 10.0 (1.6) 15.6 (4.7) 25.1 (7.9) 35,000–49,999‡ 11.4 (1.6) 5.6 (2.5) 7.9 (3.8) 50,000–74,999‡ 18.3 (2.1) 28.5 (7.8) 16.9 (8.4) 75,000–99,999‡ 20.1 (2.1) 25.3 (8.0) 0 (0) >100,000‡ 31.8 (2.5) 15.3 (5.1) 0 (0) Has personal healthcare practitioner 85.3 (2.1) 86.9 (4.1) 41.8 (9.6) <.01 Has health insurance 94.2 (1.6) 91.4 (3.5) 68.4 (9.2) <.01 * Means/sums and percentages are population weighted.
† P values are for χ2 or regression comparisons of all groups to each other.
PHQ, Patient Health Questionnaire.
‡ Characteristics using % (SE).
§ Characteristics using means/sums (SE).
Characteristics Treatment Preferences (% [SE])* Medication Only Medication and Counseling Counseling Only Wait and See Total sample (N = 976) 9.4 (1.4) 39.6 (2.3) 36.5 (2.5) 14.5 (2.1) Ethnicity, interview language Non-Hispanic white (n = 837) 9.1 (1.3) 42.5 (2.5) 34.5 (2.6) 13.7 (1.9) Hispanic, English (n = 92) 11.8 (5.5) 39.9 (7.5) 31.8 (7.8) 16.5 (6.5) Hispanic, Spanish (n = 47) 8.2 (5.2) 20.9 (6.6) 54.5 (10.2) 16.4 (9.7) Dichotomized Treatment Preferences* Options Including Medications† Options Other Than Medications‡ P§ Total sample (N [%]) 588 (49.1) 388 (50.9) NA Ethnicity, interview language Non-Hispanic white¶ 77.2 (3.1) 69.5 (4.2) .05 Hispanic, English¶ 15.9 (2.8) 14.3 (3.2) Hispanic, Spanish¶ 6.9 (1.9) 16.2 (3.4) Age (years)‖ 53.2 (1.1) 44.6 (1.4) <.01 Male sex¶ 42.0 (3.9) 42.4 (3.9) .92 History of depression diagnosis¶ 23.0 (1.6) 8.6 (1.2) <.01 Patient Health Questionnaire-9 Score (range of sums, 0–27)‖ 4.1 (0.3) 3.4 (0.4) .14 Biomedical Explanatory Model (range of means, 1–5)‖ 4.1 (<0.1) 3.7 (<0.1) <.01 Environmental explanatory model (range of means, 1–5)‖ 2.0 (<0.1) 2.0 (<0.1) .92 Stigma scale (range of sums, 3–15)‖ 7.6 (0.2) 7.8 (0.2) .23 Religiosity scale (range of sums, 4–16)‖ 9.8 (0.2) 9.9 (0.3) .83 Toughness scale (range of sums, 4–20)‖ 12.2 (0.2) 12.8 (0.2) .03 Education (years completed) <12¶ 7.4 (1.9) 13.1 (3.4) .20 12¶ 14.9 (2.5) 17.0 (3.3) 13–15¶ 25.9 (2.6) 29.1 (3.4) 16¶ 26.5 (2.6) 21.8 (2.9) >16¶ 25.2 (2.7) 18.9 (2.6) Income ($) <20,0000¶ 10.7 (1.6) 16.2 (3.4) .08 20,000–34,999¶ 14.8 (2.4) 10.6 (2.2) 35,000–49,999¶ 10.1 (1.8) 10.0 (2.0) 50,000–74,999¶ 18.0 (2.6) 21.3 (3.6) 75,000–99,999¶ 15.8 (2.2) 21.1 (3.4) >100,000¶ 30.5 (2.9) 20.7 (2.9) Has personal healthcare practitioner¶ 84.8 (2.6) 76.3 (3.8) .05 Has any health insurance¶ 94.1 (1.7) 87.6 (2.9) .04 Notes:
* Means/sums and percentages are population-weighted
† Medication only taken for at least 6 to 9 months + medication with counseling.
‡ Counseling only weekly for at least 2 months + wait and see.
§ P values are for χ2 or regression comparisons of all groups to each other.
¶ Characteristics using % (SE).
‖ Characteristics using means/sums (SE).
- Table 4.
Adjusted Predictors of Preferring Treatment Options that Include Antidepressant Medications in Non-Hispanic White and Hispanic Survey Respondents*
Variables Referent Group† Model I (Demographics and Depression History) Model II (Model I Plus Illness Representations) Model III (Model II Plus Other Psychological, Socioeconomic, and Health Care Access Variables) Age (per year) 1.03 (1.02–1.04)‡ 1.03 (1.02–1.04)‡ 1.03 (1.02–1.05)‡ Men Women 0.97 (0.65–1.45) 1.25 (0.81–1.92) 1.16 (0.75–1.82) History of depression diagnosis No history 2.78 (1.75–4.35)‡ 2.17 (1.39–3.33)‡ 2.17 (1.37–3.45)‡ Patient Health Questionnaire-9 Score (per unit) 1.04 (0.98–1.10) 1.04 (0.99–1.09) 1.05 (1.00–1.11) Ethnicity/interview language Non-Hispanic white Hispanic/English 1.18 (0.60–2.33) 1.72 (0.77–3.85) 1.82 (0.81–4.00) Hispanic/Spanish 0.41 (0.19–0.90)‡ 0.84 (0.35–2.00) 0.68 (0.28–1.69) Biomedical explanatory model (per unit) 4.76 (3.13–7.14)‡ 4.76 (2.94–7.69)‡ Environmental explanatory model (per unit) 1.12 (0.80–1.56) 1.08 (0.78–1.49) Stigma scale (per unit) 0.95 (0.87–1.04) Religiosity scale (per unit) 0.99 (0.93–1.05) Toughness (per unit) 0.99 (0.92–1.06) Education scale (years completed) <12 years 12 1.72 (0.55–5.56) 13–15 1.30 (0.49–3.45) 16 0.85 (0.45–1.61) >16 1.22 (0.65–2.27) Income ($) <$20,000 20,000–34,999 1.96 (0.85–4.55) 35,000–49,999 1.22 (0.55–2.70) 50,000–74,999 1.59 (0.74–3.45) 75,000–99,999 1.04 (0.47–2.27) >100,000 2.13 (1.00–4.55) Has personal healthcare practitioner No personal practitioner 0.74 (0.38–1.43) Has any health insurance No health insurance 0.85 (0.36–2.04) Comparisons of Parameter Estimates F P Model I versus model II for Spanish-speaking Hispanics (1,972) = 21.41 <.01 Model II versus model III for Spanish-speaking Hispanics (1,971) = 0.43 .51 Model II versus model III for biomedical explanatory bodel (1,971) = 0.01 .93 Values provided as adjusted odds ratio (AOR) (95% CI). For all comparisons of continuous variables, AORs are per unit (year, mean, or sum).
* Includes responses for the whole sample (N = 978).
† For all comparisons of categorical variables, the “referent groups” as specified in the table have an AOR = 1, to which other categories for that variable are compared. For simplicity, these referent groups’ AORs are not shown.
‡ Significant AOR (95% CI does not include 1).


