
Article Figures & Data
Figures
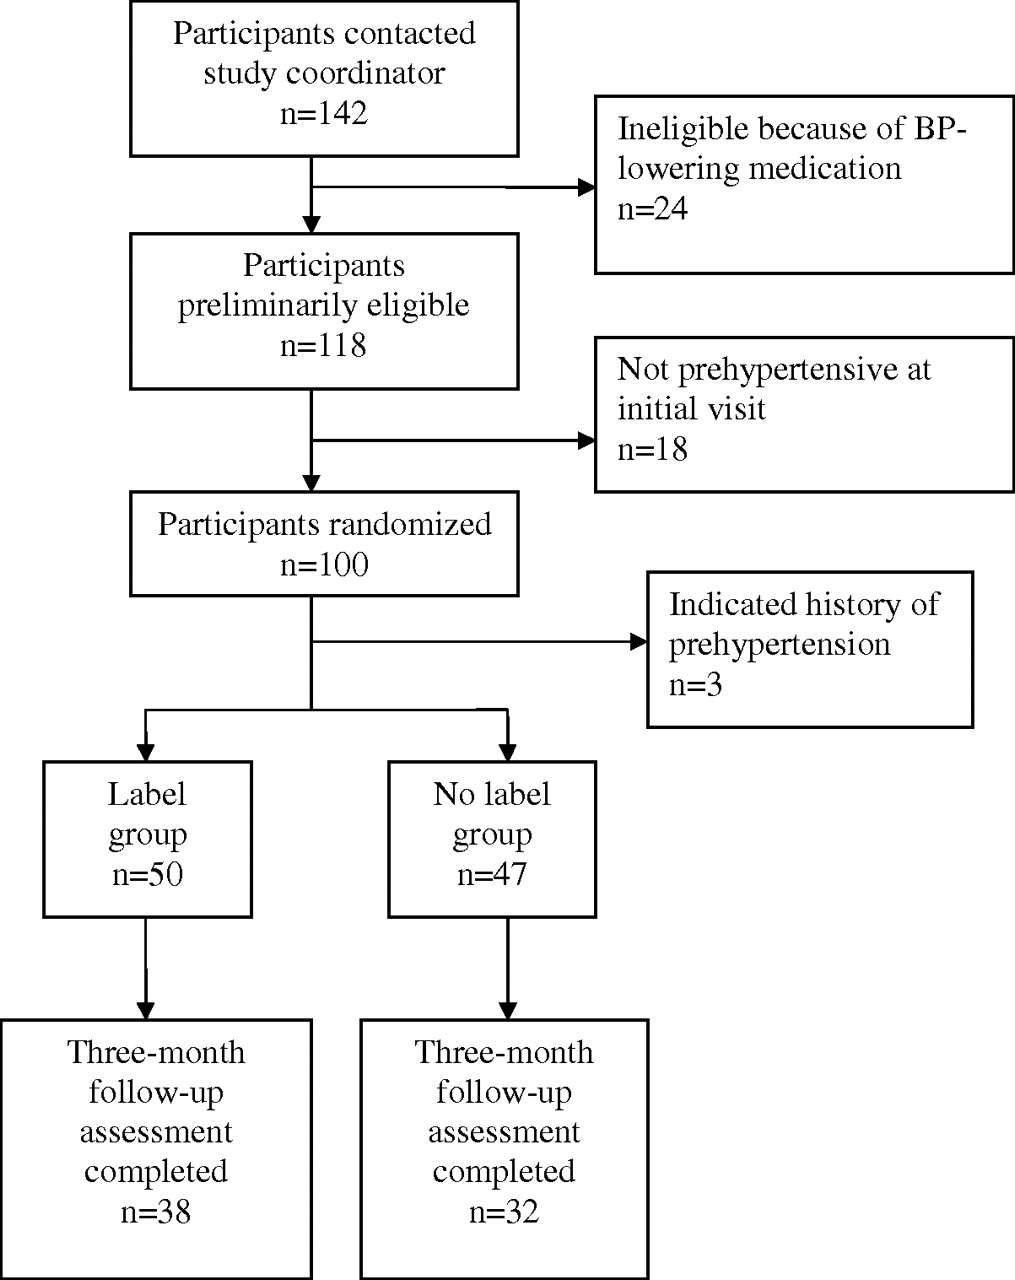
- Figure 1.
Participant flow-through study. BP, blood pressure.

Tables
Overall (n) (n = 97) No Label Group (n [%]) (n = 47) Label Group (n [%]) (n = 50) P Age category (years) .27 24–39 49 21 (45) 28 (56) ≥40 48 26 (55) 22 (44) Female sex 43 20 (43) 23 (46) .73 Race .26 White 36 18 (38) 18 (36) Black 49 22 (47) 27 (54) Other 12 7 (16) 5 (10) Hispanic ethnicity 10 7 (15) 3 (6) .15 Education level .42 <High school 11 7 (15) 4 (8) High school graduate 9 6 (13) 3 (6) Some college 33 15 (32) 18 (36) College graduate 44 19 (40) 25 (50) Self-reported health .19 Excellent 19 5 (11) 14 (28) Very good 41 23 (49) 18 (36) Good 33 17 (36) 16 (32) Fair 4 2 (4) 2 (4) Poor 0 0 0 Married or living with partner 48 24 (51) 24 (48) .84 Current smoker 28 13 (28) 15 (30) .80 Medical problems* Anxiety 9 7 (15) 2 (4) .09 Asthma 8 1 (2) 7 (14) .06 Arthritis or chronic pain 9 5 (11) 4 (8) .74 Cancer 1 1 (2) 0 (0) .49 Depression 16 8 (17) 8 (16) 1.0 Heartburn 7 2 (4) 5 (10) .44 High cholesterol 11 6 (13) 5 (10) .76 Migraines 6 2 (4) 4 (8) .68 Thyroid disorder 3 1 (2) 2 (4) 1.0 None of the above 23 11 (23) 12 (24) 1.0 Average systolic BP (mm Hg) 129.0 128.6 129.4 .57† Average diastolic BP (mm Hg) 81.9 81.7 82.1 .75† BP, blood pressure.
* P for differences in medical problems by Fisher's exact test; all others by χ2 test unless otherwise noted.
† P calculated by t test.
Nonrespondents (n = 27) Respondents (n = 70) P Age category (years) .54 24–39 15 (56) 34 (49) ≥40 12 (44) 36 (51) Female sex 9 (33) 34 (49) .18 Race White 4 (15) 32 (46) .002 Black 16 (59) 33 (47) Other 7 (26) 3 (4) Hispanic ethnicity 7 (26) 3 (4) .002 Education level .03 <High school 7 (26) 4 (6) High school graduate 3 (11) 6 (9) Some college 9 (33) 24 (34) College graduate 8 (30) 36 (51) Self-reported health .46 Excellent 3 (11) 16 (23) Very good 11 (41) 30 (43) Good 12 (44) 21 (30) Fair 1 (4) 3 (4) Poor 0 0 Married or living with partner 11 (41) 37 (53) .25 Current smoker 14 (52) 14 (20) .002 Medical problems* Anxiety 2 (7) 7 (10) 1.0 Asthma 2 (7) 6 (9) 1.0 Arthritis or chronic pain 1 (4) 8 (11) .44 Cancer 0 1 (1) 1.0 Depression 5 (19) 11 (16) .77 Heartburn 2 (7) 5 (7) 1.0 High cholesterol 1 (4) 10 (14) .28 Migraines 0 6 (9) .18 Thyroid disorder 0 3 (4) .56 None of the above 9 (33) 14 (20) .19 Average systolic BP (mm Hg) 129.2 128.9 .84† Average diastolic BP (mm Hg) 82.8 81.6 .36† Values provided as n (%). BP, blood pressure.
* P for differences in medical problems by Fisher's exact test; all others by χ2 test unless otherwise noted.
† P calculated by t test.
All respondents (n = 70) No label group (n = 32) Label group (n = 38) P* Compared to baseline .78 Better 29 (41.4) 13 (40.6) 16 (42.1) Same 40 (57.1) 18 (56.3) 22 (57.9) Worse 1 (1.4) 1 (3.1) 0 Overall self-reported health .30 Excellent 14 (20.0) 4 (12.5) 10 (26.3) Very good 28 (40.0) 14 (43.8) 14 (36.8) Good 22 (31.4) 11 (34.4) 11 (29.0) Fair 6 (8.6) 3 (9.4) 3 (7.9) Poor 0 0 0 All values provided as n (%).
* P calculated by Wilcoxon-Mann-Whitney test.
All Respondents (%) No Label Group (%) Label Group (%) Risk Ratio 95% CI Changing eating habits* 83.8 81.3 86.1 1.06 0.86–1.31 Cutting down on salt 90.0 90.6 89.5 0.99 0.84–1.15 Reducing alcohol intake† 65.9 59.1 72.7 1.23 0.80–1.90 Exercising 78.6 71.9 84.2 1.17 0.91–1.51 * Based on 68 respondents because 2 respondents indicated “not sure.”
† Among the 44 respondents who drank alcohol.
Scenario Group Proportions π* n n1 = n2 Much Worse Somewhat Worse About the Same Somewhat Better Much Better 1 No Label 0 0 0.7 0.25 0.05 0.67 58 29 Label 0.1 0.1 0.7 0.1 0 2 No Label 0 0.05 0.8 0.1 0.05 0.66 56 28 Label 0.1 0.15 0.7 0.05 0 3 No Label 0 0 0.9 0.1 0 0.64 52 26 Label 0.1 0.1 0.8 0 0 * Pr(no label > label) + 0.5 × Pr(no label = label) = competing probability that a nonlabeled individual has a better outcome than a labeled individual.


