
Abstract
Background: The recent implementation of electronic medical record systems allows for the development of systems to track common illness across a defined community. With the threats of bioterrorism and pandemic illness, syndromic surveillance methodologies have become an important area of study. There has been limited study of the application of syndromic surveillance techniques to communities for tracking common illnesses to improve health system resource allocation and inform communities.
Methods: We analyzed visits from 26 primary care sites and one emergency department in a health system during a 13-month period in 2007 to 2008. Visits were coded for common respiratory and gastrointestinal illnesses. Using geographic information systems techniques, we plotted home addresses and developed criteria for census tract inclusion. The spatial distribution of the illnesses patterns was analyzed using Bayesian smoothing, Kriging and SaTScan (SaTScan, Boston, MA) statistical methods.
Results: The study included 857,555 visits, 107,286 of which were in the emergency department and 750,269 in the primary care sites. Patient visits were plotted and then aggregated to census tracts. We determined that at least a median of 10 visits per week was required to provide sufficient volume in defining census tracts included in the study (109 census tracts). Weekly visit rates by census tract were plotted using nearest neighbor empirical Bayesian smoothing and Kriging to produce a continuous surface. To detect statistical clustering of weekly visit rates, we used SaTScan and identified 7 weeks with statistically significant clusters for respiratory illnesses and 8 weeks with statistically significant clusters for gastrointestinal illnesses (out of 56 weeks included in the study). After adjusting for population density, the visit rate remained consistent for respiratory illnesses (analysis of variance P = .937), but the visit rate for gastrointestinal illnesses increased in the fourth population density quartile (statistically different from quartiles 1, 2 and 3; analysis of variance P < .001 with Tukey multiple comparisons test), which included the highest population density areas in the study.
Conclusions: We were able to use geographic information systems to assess visit rates for common illnesses in a defined community and identified spatial variability over time. Additional research is needed to help define parameters for implementation, but we believe this can have benefit for allocation of health resources and communicating with the community.
With the recent increase in the use of electronic medical records (EMRs) in health care, data sources now exist to aid in the study, detection, and prevention of disease within communities. We hypothesize that there could be 2 important benefits to the community by capturing and analyzing common illnesses and diagnoses seen in health care settings. First, health systems could be more prepared for outbreaks. Second, the public could be informed about observed symptoms and given advice on when home management is appropriate, which may ultimately reduce unnecessary visits to primary care and emergency departments, thus decreasing the medicalization of common illnesses.
Acute upper respiratory infections are the second most common diagnosis in physician offices and the most common in emergency rooms.1 Acute gastrointestinal (GI) infections are also commonly seen in family practice or emergency department settings, with viral gastroenteritis being one of the most common of these.2 With the recent emphasis on bioterrorism and worldwide pandemics there has been increased interest in systematic analysis of disease patterning to determine whether there are outbreaks to provide reaction time for public health agencies. Monitoring for these potential threats has been labeled as syndromic surveillance and is made easier by the increased use of electronic health records or EMRs. By using these electronic records to detect abnormal clustering of acute diagnoses and illness, public health officials are able to adjust resources to meet health care demands and quickly identify potential threats.3–6 Similar techniques have also been used after natural disasters like hurricanes (eg, Wilma in Florida and Katrina in Louisiana) to assess occupants needing medical attention, and like the medication demands of evacuees versus supplies in San Antonio, Texas.7,8
Research has also been conducted to identify and validate the appropriate billing codes (International Classification of Diseases, 9 [ICD-9]) for use in a syndromic surveillance study for respiratory and GI-related illnesses.9–11 These syndromes are well defined for use by the Centers for Disease Control and Prevention.12 Although there has been a great deal of research on the temporal analysis of these syndromes, the use of geographic information systems (GIS) to conduct spatial analyses to monitor and trend these in a defined community using data from primary care centers and emergency departments are relatively limited.13,14 Building on the research already conducted, we sought to answer the following question concerning the use of GIS within a health system for monitoring primary care and emergency department visits for common illnesses: Do the diagnoses of respiratory and GI illnesses, as defined by visits to primary care (family practice, pediatrics, or internal medicine) offices and an emergency department setting in a defined geographic community, follow a spatial pattern as the illnesses cycle through the community over time?
Methods
Selection and Description of Participants
Patients for this study included all those visiting one of the following practices from the Lancaster General Health system located in southeastern Pennsylvania: health system-owned primary care practices (19 sites), a family medicine residency (7 sites), and an emergency department (1 site). The study was designed as a retrospective review of existing billing records based on a visit date to one of the study practices during the period from September 1, 2007, through September 30, 2008. This date range was selected to coincide with the installation of electronic billing functions as a part of a comprehensive EMR system in the primary care practices. An additional month was purposefully included to insure that the temporal trends at the start of the school year were included in the study. Patients were excluded if they did not have a geocoding match score of ≥72, which is the default setting in ArcView 9.3 (ESRI, Redlands, CA), and deemed to be sufficient to aggregate patients to appropriate census tracts (the score ranges from 0–100, with 100 being a perfect score and representing the highest probability of a match). This study was approved by the Lancaster General Hospital Institutional Review Board with a waiver of consent.
Definition of Visit Types
Respiratory or GI illnesses visits were coded from the top 3 billing codes for each visit based on ICD-9 codes. ICD-9 codes for the study were selected based on syndromic surveillance definitions provided by the Centers for Disease Control and Prevention for early detection of bioterrorism events and the Electronic Surveillance System for the Early Notification of Community-based Epidemics.12 A visit was coded as a respiratory or GI illness if any of the top 3 ICD-9 codes were matched to the Electronic Surveillance System for the Early Notification of Community-based Epidemics list.
Statistical Methods
The first step was to determine the appropriate geographic boundary of the catchment area included in the study based on weekly visit volume and variability. We assessed the weekly visit volumes and variability by census tracts to determine the cut-points for inclusion in the study. Census tracts are geographic areas delineated by the US Census Bureau, nested within counties and designed to be relatively homogenous (a more detailed definition can be found at www.census.gov). Nearest neighbor Bayesian smoothing was applied to the census tracts included in the study area for each week to provide weighted adjustment to those tracts with few visits in a particular week so that it was weighted toward the composite of its nearest neighbors that share a common boundary.15,16 Continuous surface maps were then created using Kriging based on the smoothed visit rates.16 These maps were then sequenced to be viewed on a media player, which provided a visual connection of the change in visit rates across the study area over time. Statistical clustering of visits (P < .05) was assessed using SaTScan software (version 7.0, SaTScan, Boston, MA) at a weekly time interval.17,18 In SaTScan, a scanning window is moved over the geographic study area and the cases or noncases are tabulated. These are used to calculate an observed and expected value, with a maximum likelihood calculated for each scanning window. The model statistically identifies clusters and compensates for multiple comparisons. For this study, the Bernoulli model was used to calculate the maximum likelihood of cases and noncases for each week. Parameters for SaTScan included the maximum spatial cluster size set at 10% of the population at risk, maximum temporal cluster size of 1 week, and no cluster centroids in other clusters. We performed the analyses for this study using the following software: ArcView (version 9.3, ESRI); Minitab (version 15, Minitab, Inc., State College, PA); Stata (version 10, StataCorp, LP, College Station, TX); SaTScan version 7.0.3; and GeoDA (version 0.9.5-i5, Arizona State University GeoDA Center for Geospatial Analysis and Computation, Tempe).
Results
During the study period there were 857,555 visits, 107,286 of which were to the emergency department and 750,269 of which were to the 26 primary care sites. After geocoding and assigning to census tracts there were a total of 746,738 visits that had a successful geocode to at least a match score of 72 (with 94,707 emergency department visits and 652,031 primary care visits), for an overall match rate of 87%. We assessed the differences between matched and unmatched patients and found no differences across gender or visit types for the syndromes included in this study. There were differences in the geocoding match rate across age ranges among older patients (≥65 years of age) and insurance type (Medicare), both of which had a lower match rate of 82%. Medical assistance patients had a match rate (89%) similar to the overall match rate. There were also differences in match rates across some of the primary care practices, with lower match rates primarily in geriatrics focused practices. We then assessed unmatched addresses that had a valid zip code located within the study area and found there were differences in the match rate across the study area, particularly in areas with post office boxes and rural areas where multiple zip codes may be used.
To define the study area we assessed a number of factors to insure the following goals: (1) sufficient visit volumes, (2) stable variability of visit volumes, and (3) contiguous surface (ie, no spatial “holes” in our mapped outcomes). Census tracts were used as the geographic areal unit of aggregation so that demographic data from census measures and estimates could be applied in subsequent data analyses. Patient home addresses originated from 2821 census tracts in the United States and visits were aggregated by week by census tract to help define the study area. We calculated weekly visit volume descriptive statistics by census tract and compared them with the selected study area descriptive statistics (Table 1).
Comparison of All Weekly Visits and Weekly Visits Within the Study Area Census Tract
We assessed median weekly census tract visits as well as the interquartile range and minimum number of visits. At a median weekly visit level of <10, the ratio of the interquartile range to the median started to consistently exceed 0.5; we also noted that the minimum number of visits was 0 with increasing frequency. Based on this analysis, we used a median of at least 10 weekly visits as our inclusion criteria to provide sufficient visit volumes and a lower ratio of variability to the median number of weekly visits. After mapping census tracts with these volumes, there was only one census tract (a small borough) that was included despite having a median weekly visits of 5, which was below the threshold of at least 10 weekly visits. We felt it was important to include this census tract to provide a contiguous geographic surface because it was surrounded by census tracts that had a median of ≥10 weekly visits.
After defining the study area census tracts, 30,810 visits were excluded because they were in census tracts outside the study area. Within the census tracts in the study area there were a total of 722,701 visits (90,668 emergency department visits and 632,033 primary care visits). Table 2 outlines the descriptive statistics for weekly visits by site. We also graphed the weekly visit rates to help define the peak illness season, which seemed to start around the last week of 2007 and lasted until mid April 2008 (Figure 1). Table 3 highlights the descriptive statistics for weekly visit rates by respiratory and GI illnesses.
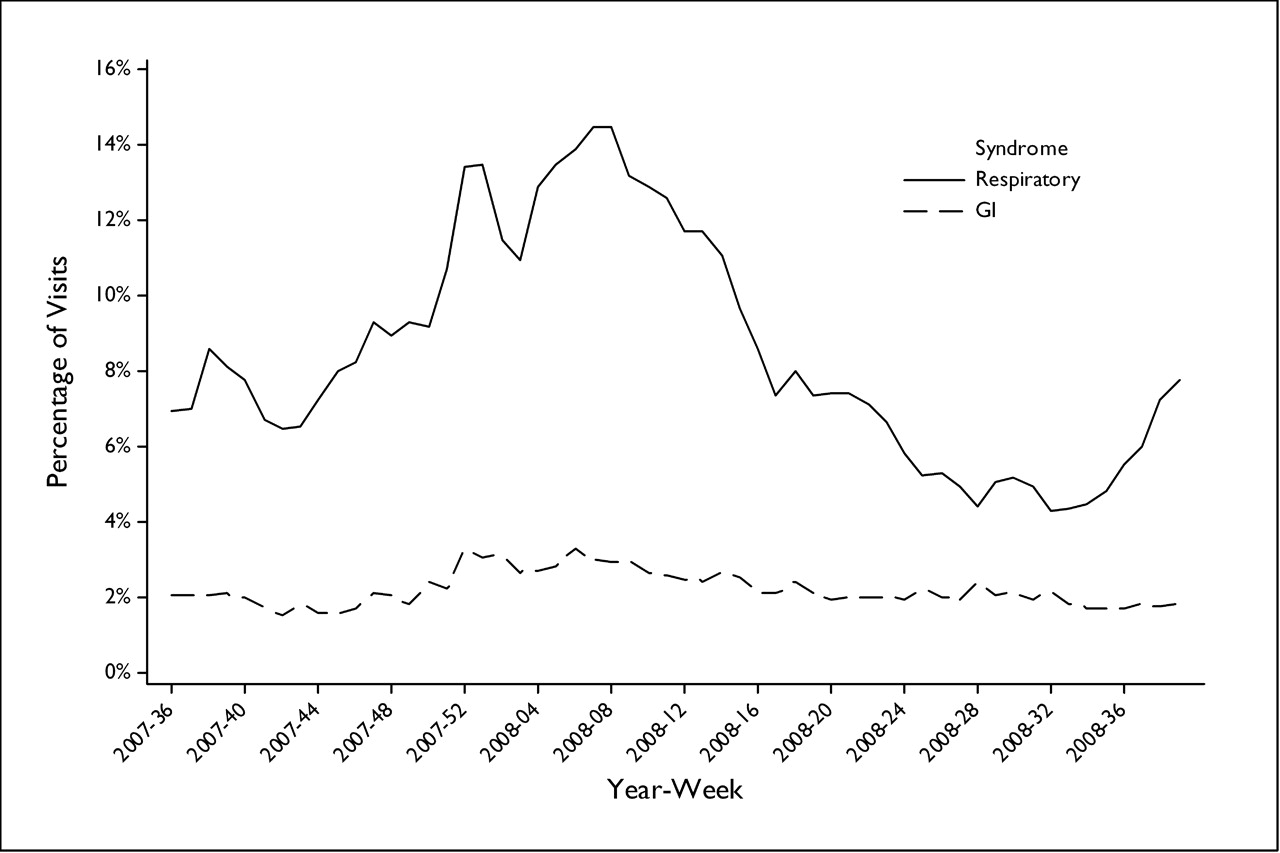
Percentage of visits for respiratory and gastrointestinal illnesses by week.
Descriptive Statistics of Weekly Visits by Site
Descriptive Statistics of Rates of Weekly Visits for Respiratory and GI Illnesses
Weekly visit rates for respiratory and GI illnesses by week for each of the 109 census tracts were plotted in a chloropleth map using nearest neighbor empirical Bayesian smoothing. Weekly continuous surface maps were then produced using Kriging based on the Bayesian smoothed rate for each census tract. As an example, Figure 2 shows the Bayesian smoothed census tract map and Kriging results for week 47 in 2007 for respiratory illnesses. After the continuous surface maps were prepared they were sequenced in a simple animation editor to create an animation that could be viewed with a media player on a computer to show the weekly changes during the time frame of the study.

A: Bayesian smoothed respiratory visit rate by census tract. B: Kringing smoothed surface of Bayesian smoothed respiratory visit rate by census tract.
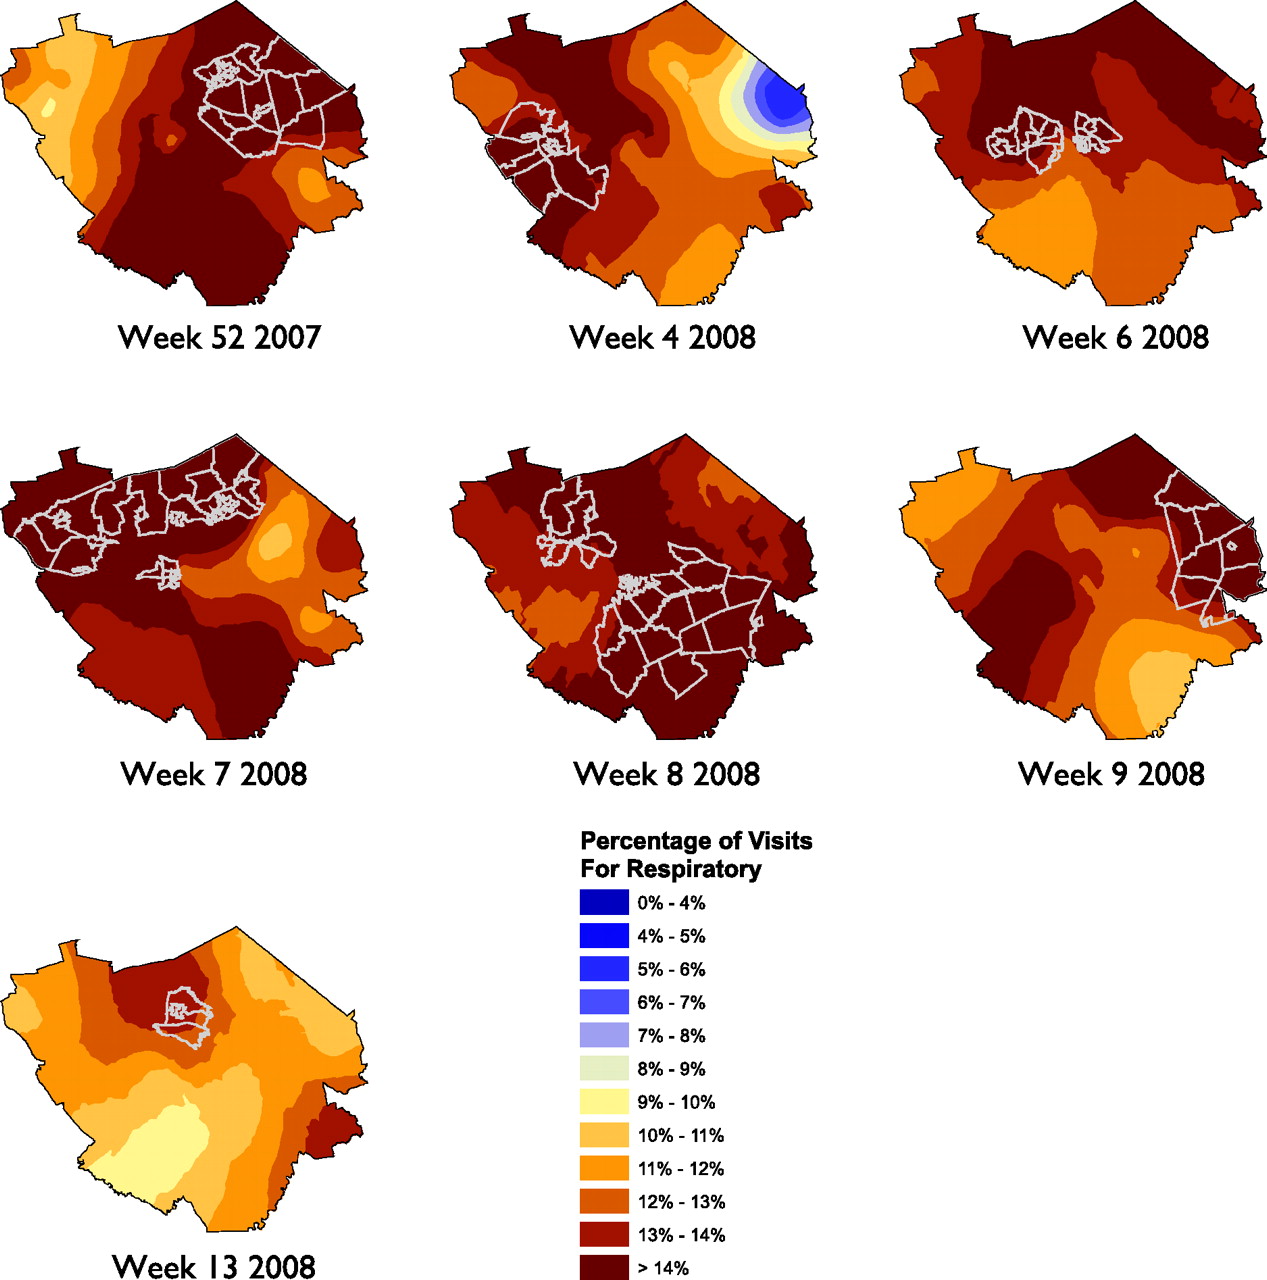
To provide a more systematic inferential analysis to the spatial data we used SaTScan to help identify statistically significant clusters within the census tracts. SaTScan identified 7 weeks with statistically significant clusters for respiratory illnesses and 8 weeks with statistically significant clusters for GI illnesses (out of 56 weeks included in the study). Figures 3 and 4 show the statistical clusters for respiratory and GI illnesses, respectively, for each week along with the Kriging continuous surface map.

SaTScan results, displayed with Kriging continuous surface, showing weeks for which census tracts had statistically significant results for weekly visits for respiratory illnesses.
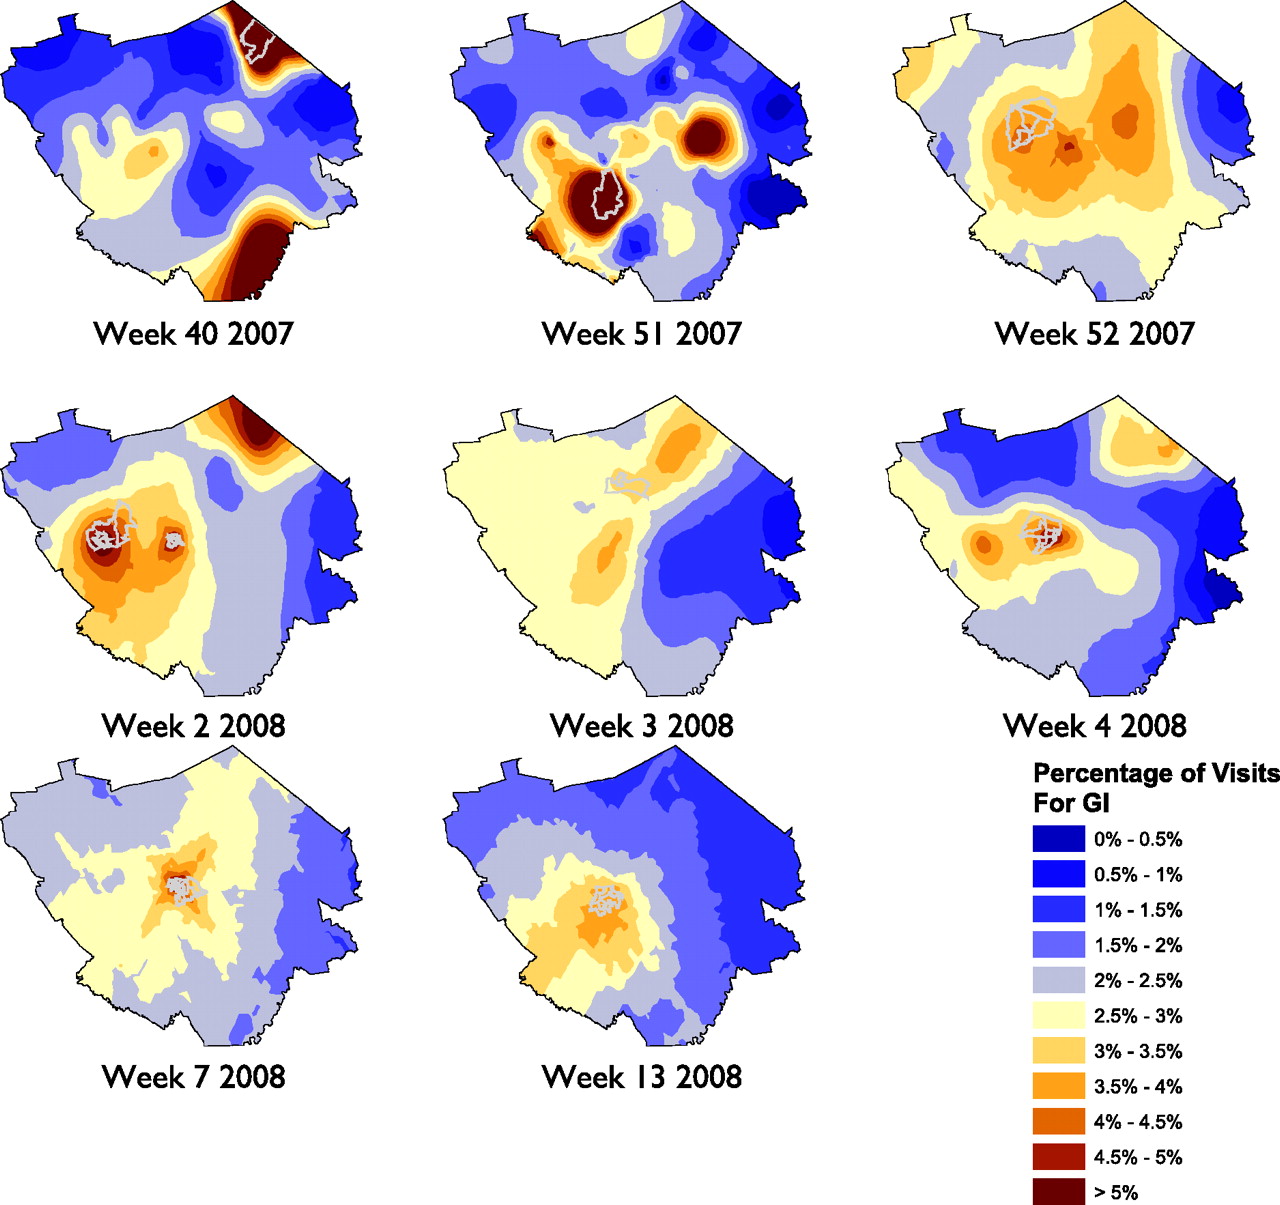
SaTScan results, displayed with Kriging continuous surface, showing weeks for which census tracts had statistically significant results for weekly visits for gastrointestinal illnesses.
Our initial observations from viewing these were that, in a general sense, the respiratory illnesses seemed to impact the entire area during the peak season whereas the GI illnesses seemed to be more spatially focused in certain locations within the study area. In reviewing the data, it seemed as if the GI clusters were over more populated areas; we divided the census tracts into quartiles based on the population density estimates from the ESRI Arc GIS 9 Data and Maps North America 2008 Update.19 After dividing the census tracts into quartiles, the overall visit rates for the 56-week study period were plotted on a box plot to assess differences across the population density quartiles. Although the visit rate remained consistent for respiratory illnesses (mean [SD] % visit rate for population quartiles 1, 2, 3, and 4, respectively: 8.6 [3.2], 8.3 [3.0], 8.6 [3.1], and 8.6 [3.0]; analysis of variance P = .937), the visit rate for GI illnesses increased in the fourth quartile (statistically different from quartiles 1, 2 and 3; mean [SD] % visit rate for population quartiles 1, 2, 3, and 4, respectively: 1.8 [0.4], 2.0 [0.5], 2.1 [0.6], and 3.0 [0.7]; analysis of variance P < .001 with Tukey multiple comparisons test), which included the highest population density areas in the study.
Discussion
The primary purpose of this study was to assess whether the diagnoses of respiratory and GI illnesses as defined by visits to primary care (family practice, pediatrics, or internal medicine) offices and an emergency department setting in a defined geographic community followed a spatial pattern as the illnesses cycle through the community over time. Based on the ability to monitor these events, we could better detect disease events, provide continual notification to the community of the types of diseases impacting residents, alert the community about when seeking medical attention is appropriate, and use the data to insure health system resources are applied appropriately. Using a website, a similar project in Canada reports and maps respiratory and GI illnesses from 9 hospital emergency departments in real-time, stratified by age groups.20 France also uses a network of general practitioners to provide sentinel data about several syndrome types and produces weekly maps.21,22 We believe that our enhancements of including primary care visits, using a continuous surface mapping model, and using enhanced mechanisms to statistically evaluate the clustering of illnesses in the community would improve the robustness of these types of systems and could be deployed on the Internet for public use. We also believe that in many cases (as with this study), there is not a local public health department that conducts this type of surveillance; a larger health system with a primary care network may be the only source of community surveillance for these and other illnesses.
We needed to use a systematic process for defining a study area and implement a smoothing technique to deal with census tracts that had few visits in certain weeks. Any health system or practices would have varying market share rates and population density across a geographic area and would need to define a specific geographic boundary to adequately study visit rates for respiratory or GI illnesses. Our method was based on the median weekly visits per census tract. Despite a criterion of a median of at least 10 visits, there were census tracts that had weeks during which there were few or no visits. We considered looking at subweekly time intervals but were concerned that, in certain areas in which market share or population density were low, GIS analysis of the data would have limited utility. Smoothing methods provide one mechanism for managing areas with low visit rates caused by market share or population density and would adjust the rate toward rates of adjacent areas. Although this provides a mechanism of statistical adjustment it does not compensate for areas with extremely low visit rates. To implement a spatial component to alert the community and provide real-time data, defining the target area and smoothing would require further study and simulation to determine optimal outcomes and data usability.
There was a very predictable temporal pattern and notable increase in visits for both respiratory and GI illnesses during the winter months. The spatial analysis focused on the creation of series of maps that showed the concentration of the visits across the study area and identified significant clusters. Statistically significant clusters suggest that the volume of visits in some census tracts are higher than in others. We noticed that the statistical clusters for the study area were not static and moved across the study area. This may suggest that there is geographic movement and variability in the visit rates of patients with these illnesses within a defined community and could be studied further.
Although the statistical clustering identifies geographic areas where the visit rate is above what was expected, at this stage it is difficult to determine what practical impact this may have on the local communities where the cluster is identified or on the practices/emergency departments serving the patients. Further research would help to quantify the relationship between visit rates that are above what would be expected and the practical impact on the community and health system resources, in addition to quantifying the precision of a predictive temporal and spatial model.
It was interesting that the overall visit rates for GI illnesses were consistently higher in areas with a high population density whereas there was no difference in the respiratory illness rates across the population density quartiles. This suggests that either there is a higher rate of GI-related illnesses in areas with a higher population density overall or residents in these areas are more likely to seek health care services when they are afflicted with GI-related illnesses.
Limitations
This study was a retrospective study, though, with the volume of visits considered to assess spatial patterns, retrospective analyses will be limited to the sophistication and precision of the electronic systems and the processes used by the staff that are collecting the data in the primary care centers or emergency departments. A real-time system used to provide early warnings, track temporal trends, or map spatial disease patterns would rely on active data feeds from electronic chart or billing records at some interval after services are provided. Another limitation is that the data for this study were based on one health system in a geographic area that would be subjected to market share variability across the region. Lancaster General is the largest health provider in the county which it serves, with an estimated 75% of the market share, so the overall sampling of the community is relatively strong, but there are regions of the study area where the market share is diminished because of other health systems and private primary care offices. Without a neutral party collecting and analyzing the data, competing health systems or practices may not be willing to release billing data that would indicate market share and geographic penetration. Further research would need to be done to determine the impact of the market share on the visit rates; however, we are hypothesizing that, because of the market share in the geographic region and the large sample size of this study, there would be limited impact on our results.
This study represents only those who sought health care services and could be biased in representing the true rate of respiratory or GI illnesses. Additional studies would need to be performed to determine variability and factors influencing the visit rate relative to the actual rate of illness or syndromes in a particular community. The use of billing codes to identify syndrome types is subject to the variability and error in coding within and between practices, although the large sample size helps to mitigate any coding errors. As with many GIS studies, the home address used to plot each patient does not account for mobility. Thus, patients may spend most of their time at work or other locations and the true geographic location of an individual may not be what is represented on the maps. Further study could help to determine whether the use of the home address is a sufficient proxy to identify an individual's geographic location. There were also differences in the geocoding match rate for older patients and those using post office boxes or living in areas where multiple zip codes may be acceptable. During the geocoding process we noticed a number of common clerical errors, including entering descriptive addresses and post office box numbers instead of street addresses and including the names of retirement homes or nursing facilities as a part of the street address. This may provide some bias in certain areas of the analyses, but manually checking and correcting approximately 110,000 addresses for this study would have required significant resources. Further research is warranted to assess the impact of these biases, to develop better geocoding algorithms to compensate for these factors, and to develop automated processes to clean the data and improve the probability of correctly matching these addresses. Common protocols for entering and editing billing data in EMR systems may need to be emphasized to enhance the ability of correctly identifying locations for GIS and health research in the future.
Future Research
There were a number of key areas that could use additional research to further investigate the feasibility of these methods for surveillance in a defined community. Further research could help define and validate methods of determining adequate geographic areas or market share considerations. These would be helpful for other communities or health systems when defining an area; they could study the temporal and spatial variability of respiratory and GI syndromes. This study used spatial smoothing and Kriging to produce a continuous surface. Further investigation could help determine which are the most effective methods of displaying these data for public and professional consumption as well as which methods most reflect the underlying syndrome visit rates. There also seems to be some uncertainty about the appropriate settings for SaTScan, as documented by Chen et al.23 Although this study sought to define parameters for SaTScan settings for studies in a large geographic area (national) using areal units of counties, a similar study could be replicated on a smaller study area with smaller areal units, such as the Lancaster community, to help determine optimal SaTScan settings. Further research could compare spatial visit rates with actual disease status in the community by conducting real-time surveys and matching their results to retrospective spatial visit rate analysis. This would help determine areas within the community where visit rates may be higher for similar incidence of disease. The phenomena that we observed, with higher visit rates overall for GI illnesses in areas with a higher population density, could be further investigated. A study could be conducted to determine whether this is caused by the underlying disease incidence, a difference in propensity to use health services, or population demographics that may be associated with the higher visit rate for GI illnesses. Finally, additional research could be conducted to discover the predictive ability of the temporal and spatial data and to determine its usefulness in defining needs if future health systems relative to these or other syndromes at the primary care and emergency department levels.
Conclusions
This study identified seasonal variability in visit rates for respiratory and GI illnesses as well as variability in spatial patterns. Spatial patterns of respiratory and GI illnesses were presented in varying map formats and animated to show the progression over time. With the use of SaTScan, statistical clustering of respiratory and GI visits was observed in 7 of 56 weeks and 8 of 56 weeks for respiratory and GI illnesses, respectively. Higher overall visits for GI illnesses was observed in the highest quartile of population density, but not for respiratory illnesses. Although there are still some significant research questions that need to be addressed relative to the use of GIS for mapping common illnesses in a community using visits to primary care and emergency departments, our results suggest that it is feasible and identifies variability across a geographically defined community. This additional work will help to further develop the methodologies for practical use of GIS in a community setting to better detect disease events, provide continual notification to the community of the types of diseases impacting residents, and use the data to insure health system resources are applied appropriately.
Acknowledgments
The authors thank Dwight O. Eichelberger, MD, for assisting with extraction of the billing data, and David T. Mauger, PhD, for project advisement.
Notes
This article was externally peer reviewed.
Funding: Funding was provided by the HG Barsumian Memorial Fund.
Conflict of interest: none declared.
- Received for publication June 1, 2009.
- Revision received August 31, 2009.
- Accepted for publication September 8, 2009.


