
Abstract
Introduction: A key element for reducing health care costs and improving community health is increased access to primary care and preventative health services. Geographic information systems (GIS) have the potential to assess patterns of health care utilization and community-level attributes to identify geographic regions most in need of primary care access.
Methods: GIS, analytical hierarchy process, and multiattribute assessment and evaluation techniques were used to examine attributes describing primary care need and identify areas that would benefit from increased access to primary care services. Attributes were identified by a collaborative partnership working within a practice-based research network using tenets of community-based participatory research. Maps were created based on socioeconomic status, population density, insurance status, and emergency department and primary care safety-net utilization.
Results: Individual and composite maps identified areas in our community with the greatest need for increased access to primary care services.
Conclusions: Applying GIS to commonly available community- and patient-level data can rapidly identify areas most in need of increased access to primary care services. We have termed this a Multiple Attribute Primary Care Targeting Strategy. This model can be used to plan health services delivery as well as to target and evaluate interventions designed to improve health care access.
The US health care system is searching for ways to increase health care coverage and reduce costs. One clear strategy is to increase the access to and utilization of primary care and preventative services.1,2 Policy changes that increase access to these services must weigh both the community's primary care needs and the provider workforce.2–5 Having the ability to create models at a community level that illustrate and predict a community's current and future primary care needs can be an invaluable tool for planning and implementing changes to increase access to care. This type of descriptive model would assist with the (1) identification of current and future physician workforce needs; (2) development of interventions that improve access to and utilization of primary care services; (3) provision of data for policy leaders as they make decisions about funding for health-related initiates; and (4) evaluation of the effectiveness of interventions and/or policy changes designed to improve a community's patterns of health care access.
The process of developing this type of model is complex and requires the ability to access and analyze data from multiple sources. Only a handful of studies have applied geographic information systems (GIS) analysis of community and/or patient data to address this.1,6–11 Prior studies have examined issues by applying the geographic retrofitting technique to characterize and define a clinic's service area7; modeling clinic deprivation scores to measure socioeconomic indicators of a clinic service area12; and facilitating access to community health information using health data maps.13
We propose a method that uses both descriptive community-level data and information from the community's primary care safety net and emergency departments (EDs) to clearly identify geographic areas that would benefit the most from improved access to primary care. This technique, which we have coined “Multiattribute Primary Care Targeting Strategy” (MAPCATS), was developed within a regional practice-based research network (PBRN) and uses mapping technology and weighted evaluation techniques. Here we describe the theoretical aspects used in our approach and show how we applied our technique to the population of Charlotte, NC. To determine the factors involved in blending population and health care indicators into informative maps we took a theoretical approach involving the analytic hierarchy process (AHP) and multiple attribute assessment and evaluation (MAAE). This combination of mapping and evaluation provides a unique approach to identifying geographic locations lacking access to health care, particularly for the uninsured and other disadvantaged populations. As such, this article answers the research question: Where in our community would there be the most benefit from increased access to primary care services?
Methods
The Practice-Based Research Network
To develop our model we used the resources of the Mecklenburg Area Partnership for Primary Care Research. This regional PBRN is based at Carolinas Health care System (CHS), the third largest vertically integrated hospital system in the United States. The CHS system provides the majority of care for our underserved community. Based on patient volume and community-wide data we estimate that this system provides more than 85% of emergency care and 80% of primary care services to the community's uninsured patient population. The primary care safetynet for this project was defined using 4 of the system's primary care clinics that provide the majority of services for the community's uninsured patients.
The methods described were developed by Mecklenburg Area Partnership for Primary Care Research as a way of carefully targeting interventions designed to improve access to primary care, with the goal of ameliorating disparities and improving the health of the community. The research network brought together ambulatory providers, community members, and research team members as a community advisory board (CAB) using principles of community-based participatory research.7 The network's CAB consisted of the following members: The Carolinas Medical Center (CMC) Ambulatory Clinic System (CMC Eastland Family Practice Clinic, CMC NorthPark Clinic, and CMC Biddle Point Clinic); Our Lady of Guadalupe Church; The Bethesda Clinic (a local free clinic); The Mecklenburg County Health Department; Department of Family Medicine; University of North Carolina at Charlotte Geography and Earth Sciences Department; and the Latin American Coalition. Advisory board involvement spanned from development of the research question to selection of attributes to oversight of research processes and review of results. Thus, the process involved both partnering with and tailoring to the needs of the community.
Analytic Hierarchy Process
The AHP is a structured technique for making complex decisions.14,15 Rather than giving a “correct” decision, the AHP helps decision makers find the solution that best suits their perception of the research problem. The research question is translated into a hierarchy of more easily comprehended subproblems, each of which can be analyzed independently. Once the hierarchy is built, the decision team systematically evaluates its various elements by comparing them to one another. When making comparisons the decision makers can use data or personal judgments about each elements’ relative importance. These evaluations are converted to numerical values that can then be compared.
The decision makers can assign weights to each factor so they can be combined quantitatively on a map. For example, if we have 5 factors of equal weighting, each factor would be multiplied by 0.2. Then the factors would be added together to give a final score for each census tract. If the weightings were different for each factor, this would enable the CAB to emphasize key factors with greater weightings in the overall map.
For this project, the available community- and patient-level data were reviewed to identify what information was most pertinent to answer a critical question in the process: What are the best indicators of primary care need for our community? The research team and advisory board used an iterative process of reviewing the available data, selecting attributes that were deemed important, and reviewing maps of each data element before selecting 5 key attributes. Identifying these attributes was a key first step in answering the research question of what geographic areas within a defined community would receive the greatest benefit by increasing access to primary care services.
Each variable was reviewed by the team for its ability to describe the community's primary care needs and contribute to the answering of the research question. This iterative process led to multiple assessments and weightings of different variables, including (1) the selection of population density; (2) the identification of uninsured/Medicaid insurance types as risk factors for primary care need; and (3) the choice of percentage of population using a primary care safety-net clinic as a protective variable instead of using the primary care service area alone.
The 5 selected attributes were standardized to values between 0 to 1, and multiple sets of composite maps were created based on several different weighting criteria. After evaluating the different weighting schemes, the team chose equal weighting for all variables, with utilization of the primary care safety-net being given an inverse but equal weight as a protective factor.
Multiple Attribute Assessment and Evaluation
MAAE methods analyze multiple attributes and combine data elements to positively influence decision quality.16 For this project we used MAAE methods to weigh multiple attributes selected through the AHP process (described above) to gain a better understanding of community-wide primary care needs. The members of the research team and CAB ranked each of the selected attributes according to its perceived importance. The attributes were rated on a scale (0 to 1), with 1 being the highest level of importance. The attributes were then combined and maps showing the data were created and reviewed. After reviewing multiple sets of weights for each attribute, the group selected a system of equal weighting. Discussion among the research team and CAB concluded that no single factor deserved differential weighting. As such, all indicators were considered equally reflective of primary care need in the community.
Geographic Information Systems (GIS)
After institutional review board approval for the study was obtained, data for all ED and primary care clinic visits in 2007 was extracted from the shared CHS databases. The initial dataset contained just more than 367,000 records. Data for patients living outside of the county or lacking an address were excluded, which resulted in approximately 187,000 ED visits and 50,000 primary care patients being included in the analysis. Census-based demographic data for Mecklenburg County projected for 2007 was obtained from Claritas (San Diego, CA). All patient address data were geocoded using ArcGIS (ESRI Products, Redlands, CA) greater than a 97% match rate for both clinic and ED data.
To ensure patient privacy, the original addresses and any other information that could identify the patients (other than the geocode) were stripped from the data set before further analysis. In addition, all data were reviewed to identify any census tracts containing fewer than 50 individuals from any one racial or ethnic category. When identified, these data points were either removed or averaged into an adjacent census tract. All maps created from the dataset were at the level of the census tract or higher, and no dot maps were created for this project.
New York University Emergency Department Algorithm
The New York University (NYU) Algorithm was developed by the NYU Center for Health and Public Research to classify ED visits and identify inappropriate utilization of the ED based on the patients’ diagnosis.17 The categories include (1) nonemergent; (2) emergent but treatable through primary care; (3) emergent with ED care needed but preventable or avoidable with access to primary care; (4) emergent with ED care needed and not otherwise preventable; and (5) other categories, including injury, mental health, drug/alcohol related, and unclassifiable. We applied the NYU ED algorithm (version 2.1 for Microsoft Access) applied it to our geocoded ED data. To facilitate this process, our ED data were reduced to only 2 fields (the geocode and International Classification of Diseases version 9 code) before application of the algorithm. The resultant data set provided a geocode linked with a probability (from 0 to 1) for each of the categories described above. For this study we combined the probabilities for categories 1 to 3 because ED visits in each of these groups were considered treatable through primary care or preventable with appropriate access to primary care. These combined categories for issues treatable through primary care or preventable ED visits are also called “ambulatory care sensitive” (ACS).
MAPCATS
A flow diagram for the MAPCATS process can be seen in Figure 1. After the research question was defined, the descriptive community data—including population density, household income, and race/ethnicity—were imported into ArcGIS (ESRI Products), allowing the team to assign weights to each attribute before creating maps. Then the AHP process was used to select and refine attribute selection from the available data fields (see Figure 2). Members of the research team and the CAB reviewed maps of individual attributes to confirm that the data fit their perceptions of the community and that these factors would be valid indicators of primary care needs. Next, combined maps were assembled based on the MAAE process (described above) to determine the appropriate weightings for a final map. Finally, combination maps incorporating the weightings determined by the group process were assembled to show the primary care needs of the community.
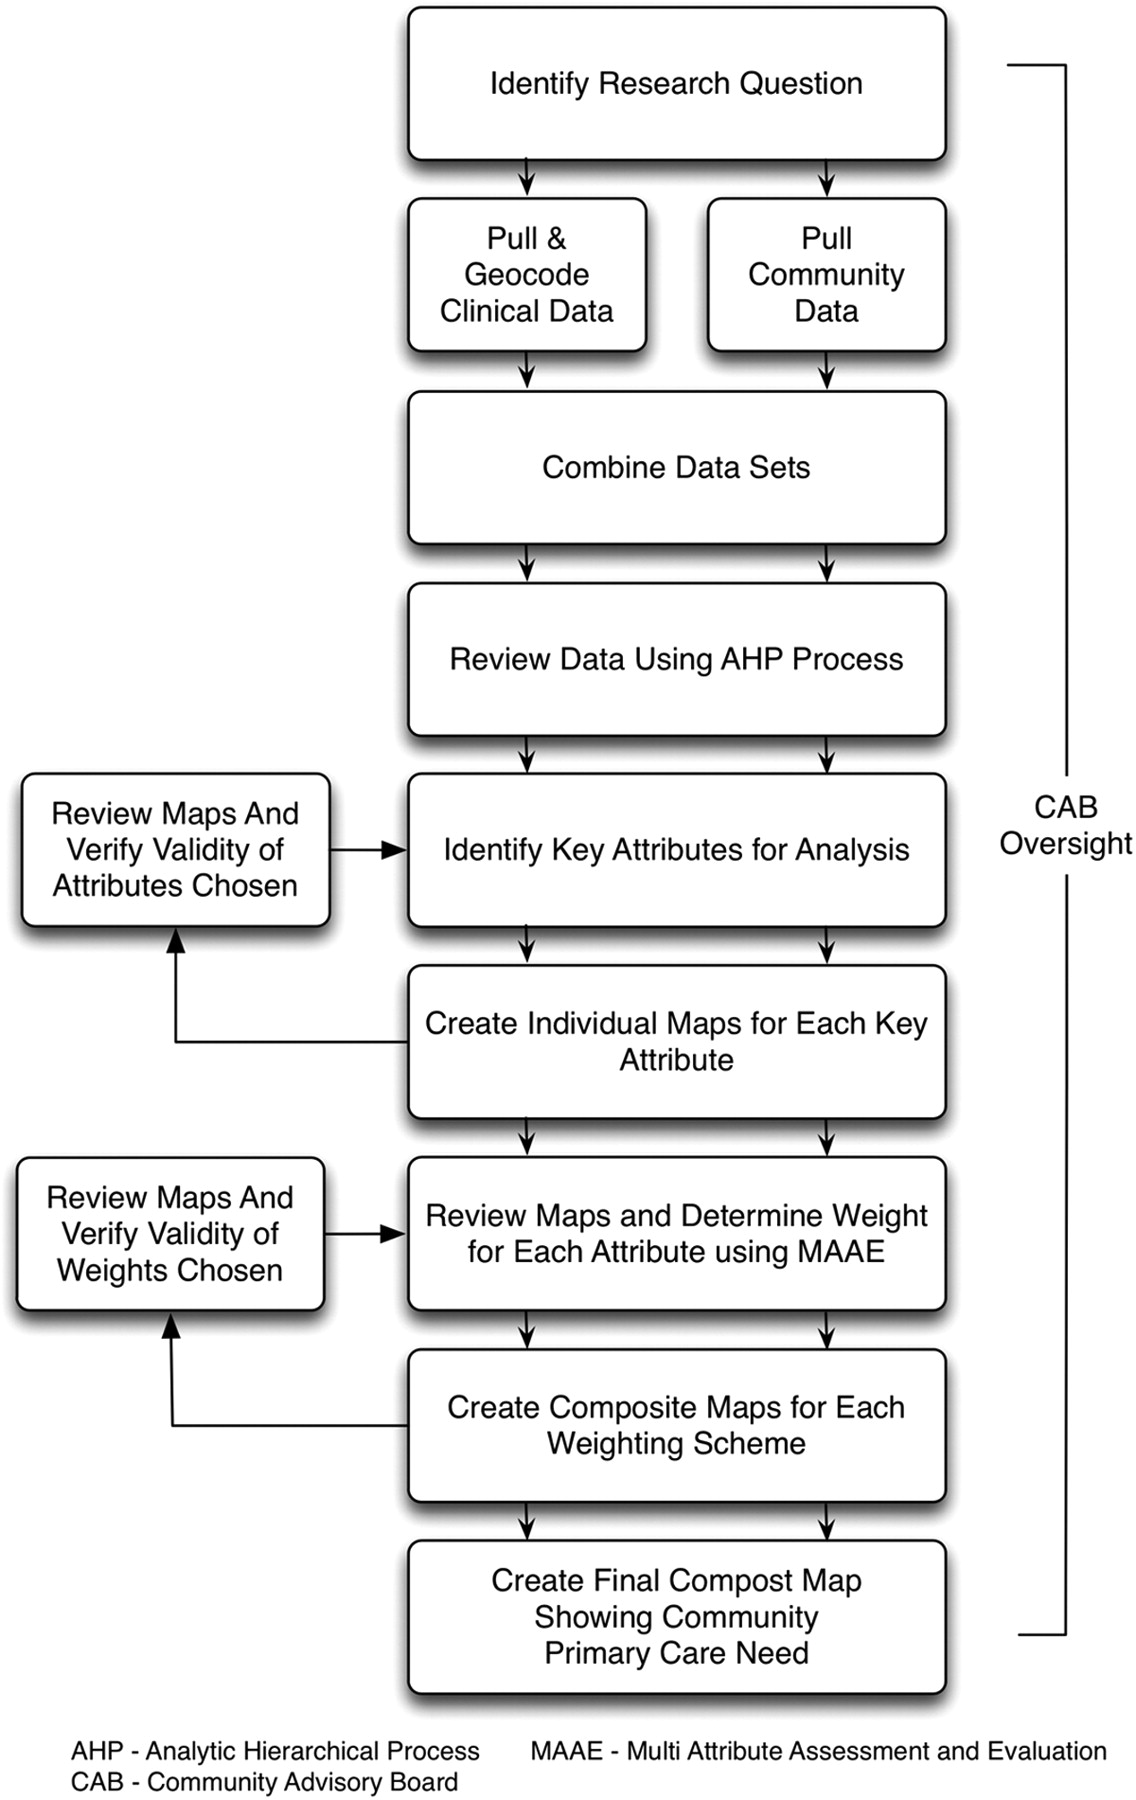
Overview of the Multiattribute Primary Care Targeting Strategy (MAPCATS). This process started with engagement of the community advisory board that guided and oversaw each step of the research process. The team selected the research question of “What geographic areas are in need of increased access to primary care services?”

Overview of the data processing for the Multiattribute Primary Care Targeting Strategy (MAPCATS).
To validate the results of the model, the individual variables selected were combined using factor analysis.11 The final component scores (the result of one or more components combined) were used to create an overall combination map to compare with the final target map.
Results
Map Preparation for Each Attribute
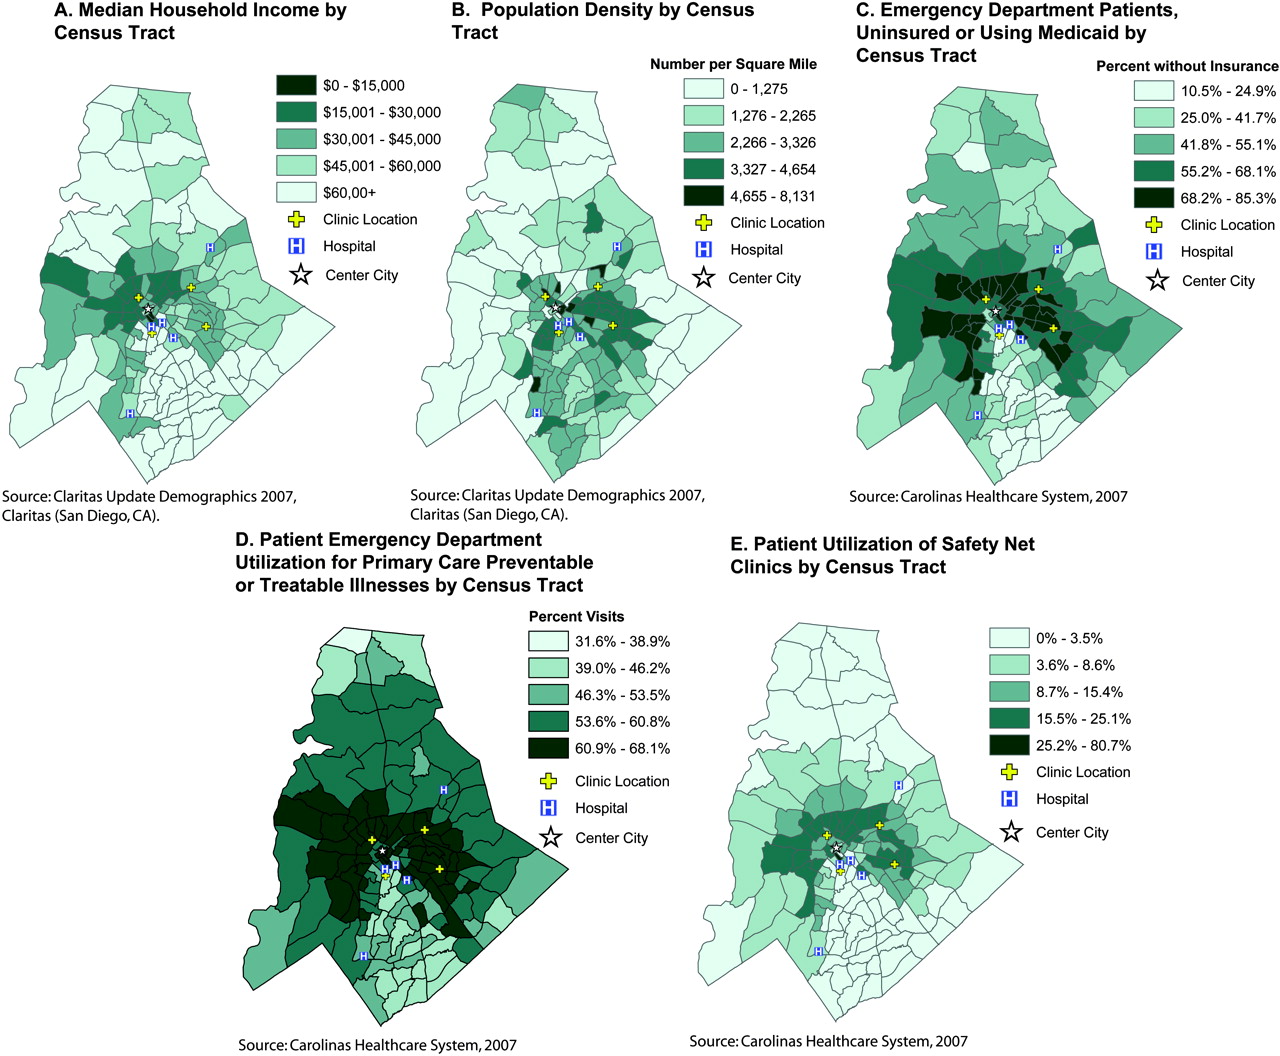
Socioeconomic data were represented by median household income—an easily obtained community indictor available from the census-based Claritas dataset. These data were mapped by census tract, as seen in Figure 3A. Income was considered an important indicator of primary care need, and targeting low-income community members would provide a means of helping to overcome health disparities and improving community health.19,20

Maps showing each attribute used to assess community-wide primary care need. A: Median household income by census tract. B: Population density by census tract. C: Emergency department patients, uninsured or using Medicaid, by census tract. D: Patient emergency department utilization for illness preventable or treatable through primary care, by census tract. E: Patient utilization of safety-net clinics by census tract.
Population density was identified by dividing the total population in each census tract by the census tract area in square miles. Data were then mapped using ArcGIS (ESRI Products) to create Figure 3B. Population density was considered an important attribute because interventions to improve health care access need to be in areas that can impact the largest number of at-risk community members. Population density maps were checked against the hospital's patient data, and rates of patient ED utilization were found to be directly proportional to the overall population density.
Insurance status was drawn from the CHS clinical databases. This data field was sorted based on input from the research team members and primary care providers into 5 categories: uninsured, commercial, Medicaid, Medicare, and other. A separate analysis, comparing each insurance type and ED utilization for ambulatory care-sensitive diagnoses, revealed that lack of insurance and Medicaid insurance coverage were significantly linked to inappropriate ED utilization (unpublished data). From this analysis, the number of patients within either of these 2 insurance categories were combined and divided by the total number of patients for each census tract. This data were mapped using ArcGIS (ESRI Products) to produce Figure 3C.
ED utilization patterns were determined using the NYU ED algorithm to identify ACS ED visits. Our assumption was that these ACS visits could have been treated in a primary care setting or avoided if patients had access to primary care in a more timely fashion. The ACS scores provided a probability between 0 to 1 for each patient visit. These scores were combined at the census-tract level and mapped using ArcGIS (ESRI Products) to provide Figure 3D. To confirm the validity of this data, maps were also created for non-ACS visits. The maps showed patterns that were the direct inverse of the ACS ED maps incorporated into this model.
The final attribute used in the MAPCATS process was patient utilization of the community's primary care safety net. Data from the 4 primary care clinics that provide the majority of care for our community's uninsured patients were analyzed. The percentage of the population using the safety-net clinics was determined by dividing the number of patients in each census tract by the total population of that tract. This information was then mapped and can be seen in Figure 3E. This attribute was added to the model as a protective factor for primary care need, so the areas with a higher percentage of the population accessing services were considered to be less likely to need additional primary care access.
Creation of Composite Map
The numeric values for all the variables in each census tract were added together as a measure for the tract's perceived need for additional primary care services. The cumulative total was then obtained, and the census tracts with values greater than 1 SD above the mean were selected as target areas that would probably benefit the most from additional primary care capacity (Figure 4). The areas that scored highest for primary care need were located to the east of the city center and were near one of the ambulatory care clinics. Further analysis revealed that this clinic's service area did not include many of the census tracts within its geographically located neighborhood as would be predicted by this model. This finding led to a secondary project that sought to determine why this mismatch occurred and how it could be rectified.
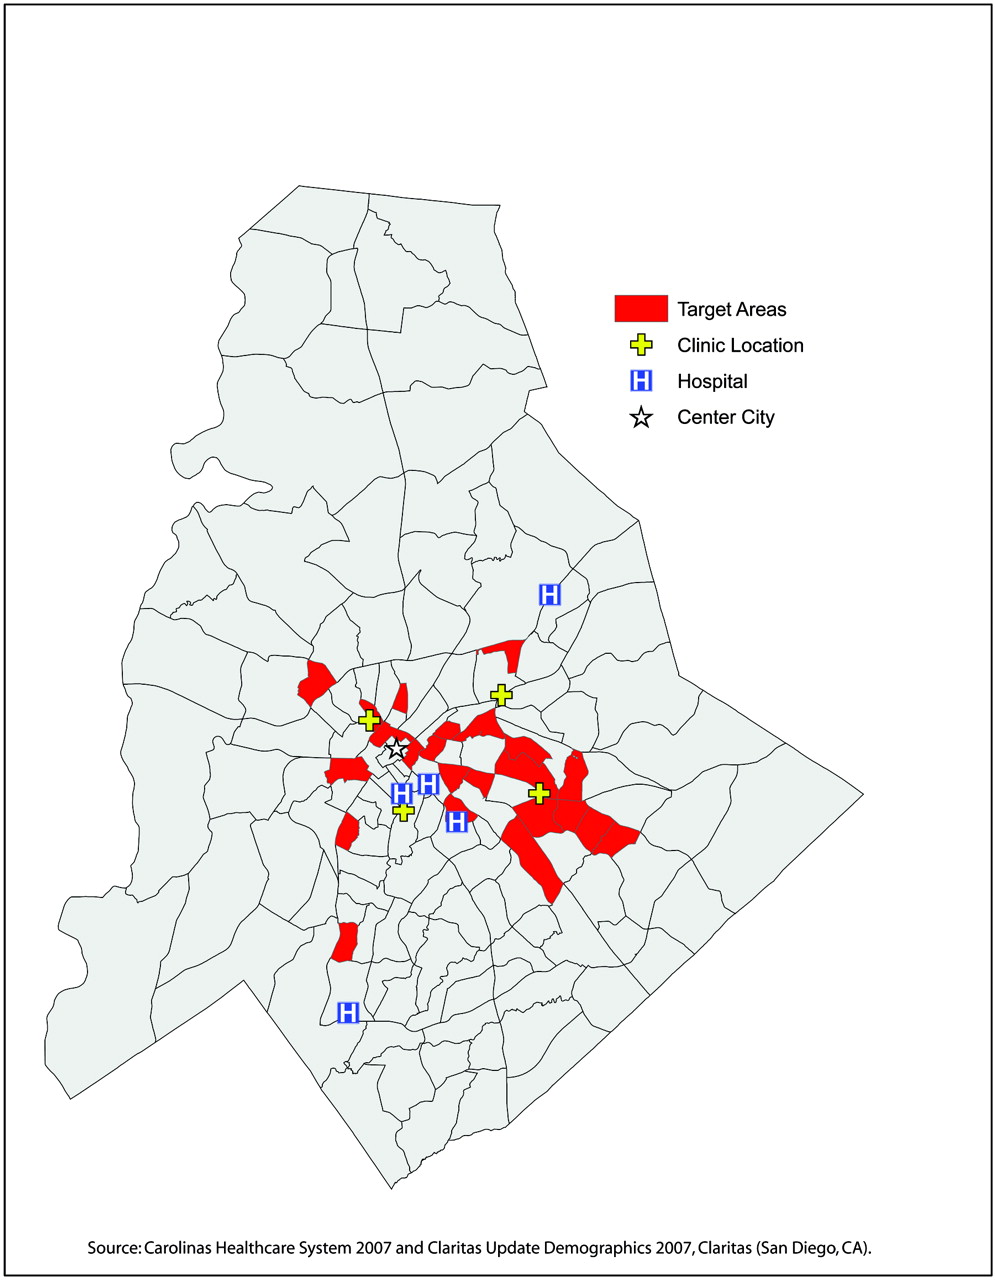
Composite map showing overall community primary care need. A single map shows the final output based on combining the 5 selected attributes describing primary care need in Figure 3.
The 5 individual variables were combined using factor analysis11 to validate the results presented. The analysis resulted in the creation of 2 components that explained 85% of the variance of the variables. The socioeconomic component combined ED utilization, safety-net clinic utilization, percent of uninsured/Medicaid patients, and median household income (Table 1). The density component consisted only of population density. The 2 components were combined together based on the number of variables contributed to each component. The socioeconomic component contained 80% of the variables and the density component contained 20% of the variables. The combined factor scores were then standardized. The results 1 SD above the mean are illustrated in Figure 5 and target more than 85% of the same census tracts, as indicated in Figure 4.
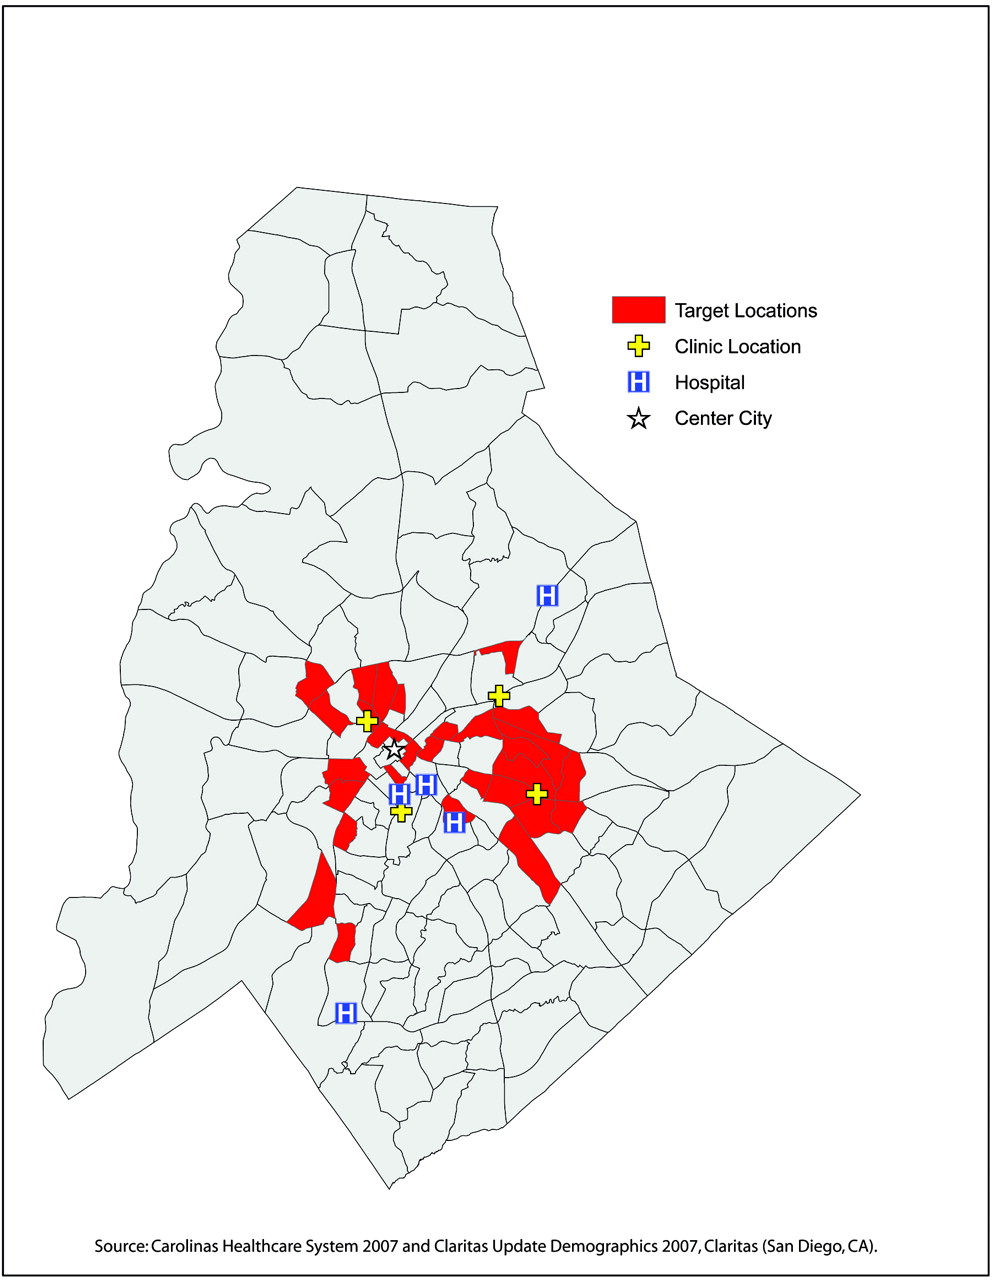
Factor analysis composite map showing overall community primary care need.
Variance and Loading of Variables for Components in Factor Analysis
Discussion
This article describes a novel system that weighs multiple community-level and patient-level attributes to describe the primary care access needs of an entire community. This system uses AHP and MAAE assessment methods to create a composite geospatial model, which is then brought to the community for feedback using the principals of community-based participatory research. We have termed this model MAPCATS, for “Multiattribute Primary Care Targeting Strategy.” We propose that this model can also be used to target interventions designed to improve primary care access.
Strengths of this model include the use of feedback from a CAB; the use of commonly available patient- and community-level data; the application of an open-source algorithm to identify ambulatory care sensitive emergency department visits; and the relative ease with which the composite models can be created. The weighting of the attributes by CABs removes arbitrary assumptions about the impact of one factor over another by a single individual or researcher. In addition, this system allows the users to generate various scenarios that can then be mapped and reviewed by the research team. The data used was extracted from a large clinical database and either downloaded from the US Census Bureau or purchased from Claritas to ensure temporal matching. The NYU algorithm can be downloaded and applied to large data sets within commonly available database software, such as Microsoft Access (Microsoft Corp., Redmond, WA). Once the data are geocoded and imported into ArcGIS (ESRI Products), the composite models with various weights for each attribute can be created within a few hours.
The community where this system was developed (Charlotte in Mecklenburg County, NC) is an ideal location for this type of analysis because of its rapidly growing and diversifying population and the presence of a large, vertically integrated hospital system charged with providing the majority of care to underserved populations.21 We propose that other communities facing similar population changes and/or growing numbers of uninsured patients may consider using this method to identify at-risk geographic areas within their community that would experience the greatest benefit from additional resources. Our approach may be particularly useful for specific subpopulations that are currently underserved by many community health care systems. Indeed, the follow-up article demonstrates the use of the MAPCATS system to develop interventions for Charlotte's Hispanic immigrant population.22 Using the MAPCATS system to target underserved locations and the vulnerable populations residing within them will probably have a rapid and measurable impact on community health and subsequently provide a clear return on investment.
One additional potential use of this system could be to monitor community-wide changes in patterns of health care access that occur as the result of a specific intervention. Preliminary data from our group has shown that changes in access patterns around one of the primary care clinics that may have occurred as a result of a community-based participatory research intervention could be detected with this system. There is an ongoing study that will prospectively test this specific hypothesis.
The primary limitation to this model is the lack of validation at the individual level. Combining patient-level data with descriptive community-level information helps to overcome this limitation and ensures that many community members with limited access to primary care will be identified. However, this data cannot be used to determine the number of individuals that live in the same vicinity who are also at risk. Additional studies, such as selected door-to-door surveying, have previously been used in our community and could be repeated to validate the MAPCATS process.
The methods used in the model can be adopted by other communities to reproduce the output created by MAPCATS. If the data used in the socioeconomic component are not readily available (assuming a community can calculate population density), advisory groups can propose other variables that show similar variability of ED utilization, safety-net clinic utilization, percent uninsured/Medicaid, or median household income at the census-tract level to identify a set of target areas. However, the level of specificity created by MAPCATS would require all 4 variables to be used. Our model is not as broad as the factor analysis validation and therefore produced a more targeted result.
Gaining understanding of the patterns of health care access for a community is a key step in the process of improving primary care access and positively impacting community health. The proposed MAPCATS method provides a means for using information about patients’ patterns of health care utilization and community-level data to identify areas where access to primary care services are limited and can be improved. This method may be particularly well suited for use in urban communities facing population changes related to immigration or loss of health insurance. The maps resulting from this process could be used to target such vulnerable populations and monitor the effectiveness of interventions designed to improve their, and overall community, access to care.
Acknowledgments
The authors would like to acknowledge Travis Haney, Andrea Dulin, the providers, and the community members who participated in the development of the maps.
Notes
This article was externally peer reviewed.
Funding: This study was funded by the Charlotte-Mecklenburg Health Services Foundation and the Agency for Healthcare Research and Quality (AHRQ), grant R03 HS016023-01.
Conflict of interest: none declared.
- Received for publication June 1, 2009.
- Revision received October 2, 2009.
- Accepted for publication October 9, 2009.
References
In this issue


Jump to section
Related Articles
Cited By...
- Novel Models to Identify Census Tracts for Hepatitis C Screening Interventions
- Using Geographic Information Systems (GIS) to Identify Communities in Need of Health Insurance Outreach: An OCHIN Practice-based Research Network (PBRN) Report
- Geographic Information Systems (GIS) Demonstrating Primary Care Needs for a Transitioning Hispanic Community
- Mapping Primary Care: Putting Our Patients in Context