
Abstract
Background: Assessment of patient safety culture has recently expanded in inpatient settings, but the majority of medical encounters occurs in office settings, and less is known about the determinants of perceived quality and safety in ambulatory care. The Medical Office Survey of Patient Safety was developed to assess perceived quality of care and patient safety culture in medical offices, including a domain to assess the quality criteria as defined by the Institute of Medicine: patient-centered, effective, timely, efficient, and equitable.
Methods: We surveyed 6534 clinicians and staff in 306 medical practices from 11 practice based research networks (PBRNs) in 16 states. We collected data on office size, ownership, and use of health information technologies (HIT) and assessed perceived patient safety and quality of care with the Medical Office Survey of Patient Safety's overall quality domain. Using a mixed model that adjusted for the role of respondents, we examined the relationship between perceived safety and quality of care and office size, ownership, and the degree of implementation of HIT.
Results: Small practices (3–15 personnel) reported the highest proportion of positive perceptions of quality and safety. The lowest proportion of positive perceptions of quality and safety occurred in large (41–70 personnel) and very large practices (>70 personnel). After controlling for office size, we found no relationship between perceived quality and safety and practice ownership. The relationship of HIT implementation to perceived quality and safety was not clear. We found the highest proportion of positive perceptions in practices with the least HIT and those with the most HIT and the lowest proportion in practices with intermediate levels of HIT.
Conclusions: Personnel in small practices reported the highest overall quality and safety of care, and perceived quality and safety declined with increasing office size. No clear relationship was found between perceived quality and safety and implementation of HIT.
- Health Information Technology
- Patient Safety
- Practice-based Research
- Practice-based Research Networks
- Primary Health Care
- Quality of Health Care
The Institute of Medicine (IOM) reports on medical errors and safety, Crossing the Quality Chasm1 and To Err is Human,2 propelled the Agency for Healthcare Research and Quality (AHRQ) and others to focus on patient safety and quality in our health system. These reports note that the foundation of quality in health care settings is patient safety.1
As part of its response, AHRQ developed tools for use by hospitals, medical offices, and nursing homes to assess the culture of patient safety in these settings. In 2007, the Hospital Survey on Patient Safety survey comparative database was released so that hospitals could see how well they were doing in establishing a culture of safety compared to similar hospitals.3 More recently, AHRQ has provided such comparative patient safety data on the patient safety culture in US nursing homes.4
Although many patient safety improvement initiatives have been focused on inpatient settings, the majority of medical encounters occur in an office-based setting. Few tools exist that describe the culture of care delivered in primary care medical offices from the perspectives of the people who deliver the care, namely the clinicians and staff. Responding to this need, AHRQ directed its attention and resources for patient safety and health information technology (HIT) to ambulatory patient safety and created a new tool specific to the office-based setting. The Medical Office Survey on Patient Safety (MOSOPS) is a 51-item survey that measures 12 domains of office culture conceptually related to patient safety. One domain, Overall Perceptions of Patient Safety and Quality, consists of 5 items drawn from the IOM's criteria for quality—delivering care that is patient centered, effective, timely, efficient, and equitable—as well as an additional question assessing perceived overall patient safety. The survey is available on the AHRQ website.5 The survey also includes background questions about the medical office, including ownership of the practice, specialty representation, level of implementation of computer-based tools, number of patient visits during a typical week, number of providers by specialty, and number of staff by role. The survey is designed to be administered to the entire office, including clinicians, clinical staff, and administrative staff.
In 2007, MOSOPS was pilot tested in 202 primary care medical offices across the United States. Two years later, AHRQ awarded a practice-based research network (PBRN) master contract task order to a consortium of 11 PBRNs to administer the survey in 300 primary care practices across the United States. The combined survey results from 292 PBRN medical offices and 182 other medical offices from the survey pilot are available on the AHRQ website at http://www.ahrq.gov/qual/mosurvey10/moresults10.htm.
As the lead network in the consortium, the Oregon Rural Practice-based Research Network (ORPRN) has coordinated presentations to family medicine audiences across the nation, reporting on the results found in the PBRN practices. In response to these presentations, strong interest was expressed in possible relationships of office characteristics with the quality and safety. In this article we investigate the relationship between perceived overall safety and quality of care and 2 office characteristics: practice size and degree of HIT implementation.
Methods
Design
This was designed as a cross-sectional survey of clinicians and staff in ambulatory primary care practices.
Setting, Subjects, and Sampling
Our aim was to collect benchmark data that was representative of ambulatory primary care practices across the United States to ensure data that would be generalizable and could be used for comparison by future users of the survey. A goal of 300 small- and medium-sized primary care practices was targeted to include a variety of settings (urban, suburban, rural); patient populations (white, Hispanic, African American, and Native American); specialties; and degrees of HIT implementation (from no HIT to full implementation of electronic health records [EHRs] with robust capabilities). We aimed for a range of sizes, from 2 to 15 clinicians, excluding solo practices for reasons of survey respondent confidentiality.
For the purposes of this study, we defined primary care to include family medicine, general internal medicine, and general pediatrics. We defined a multispecialty practice as having at least one clinician outside the main specialty in the practice. We defined HIT implementation in terms of the stage of implementation of HIT, from none at all to fully implemented, for each of 5 HIT capabilities: electronic appointment scheduling, electronic ordering of medications, electronic ordering of tests and images, electronic access to tests results or images, and EHR.
Subjects for this study were clinicians and staff of ambulatory primary care medical offices. All staff members of the medical offices were asked to complete the MOSOPS survey, including physician and nonphysician clinicians, nursing and medical assistant staff, receptionists, schedulers, billing personnel, managers or administrators, and other office personnel.
Practice recruitment was accomplished through a consortium of 11 PBRNS from across the United States coordinated by the ORPRN. Each participating network committed to recruiting 25 medical offices, aiming for the diverse characteristics described earlier. At the time of recruitment, medical offices were roughly one-third each of rural, urban, and suburban and mirrored the US patient population in ethnicity, Hispanic/Latino composition, and racial distribution. Networks had to meet the sampling strategy of medical offices with a mix of specialty, size, and level of enabled IT. The practices represented considerable geographic diversity and included the Eastern Pennsylvania Inquiry Collaborative (EPICNet); Great Lakes Research into Practice Network (GRIN), Michigan; Guthrie Health Care System; Indiana Family Practice Research Network (INet); Minnesota Academy of Family Physicians Research Network (MAFPRN); National Interdisciplinary Primary Care PBRN, California; Oklahoma Physicians Resource/Research Network (OKPRN); Oregon Rural PBRN (ORPRN); Penn State Ambulatory Research Network (PSARN); South Texas Ambulatory Research Network (STARNet); and Wisconsin Research and Education Network (WREN).
Data Collection and Instruments
Every medical office was assigned a point of contact, a role most often filled by an office manager or lead clinician. Points of contact were responsible for completing the Medical Office Background questionnaire, distribution and collection of MOSOPS to and from their staff, conveying uniform information, assuring confidentiality and maintaining privacy, and completing the follow-up evaluation after receiving their office's data in report format.
Medical Office Background
The office manager (or designee) at each participating medical office filled out a Medical Office Background questionnaire that provided information about the number of personnel working in the office, practice ownership, and the level of implementation for 5 HIT capabilities: (1) electronic appointment scheduling, (2) electronic ordering of medications (with pharmacies capable of processing electronic orders), (3) electronic ordering of tests, imaging, or procedures (with centers capable of processing electronic orders), (4) electronic access to test or imaging results, and (5) EHRs. The degree of implementation of each capability was rated as (1) not implemented and no plans to do so during the next 12 months; (2) not implemented but planned during the next 12 months; (3) implementation in process; or (4) fully implemented.
Medical Office Survey on Patient Safety
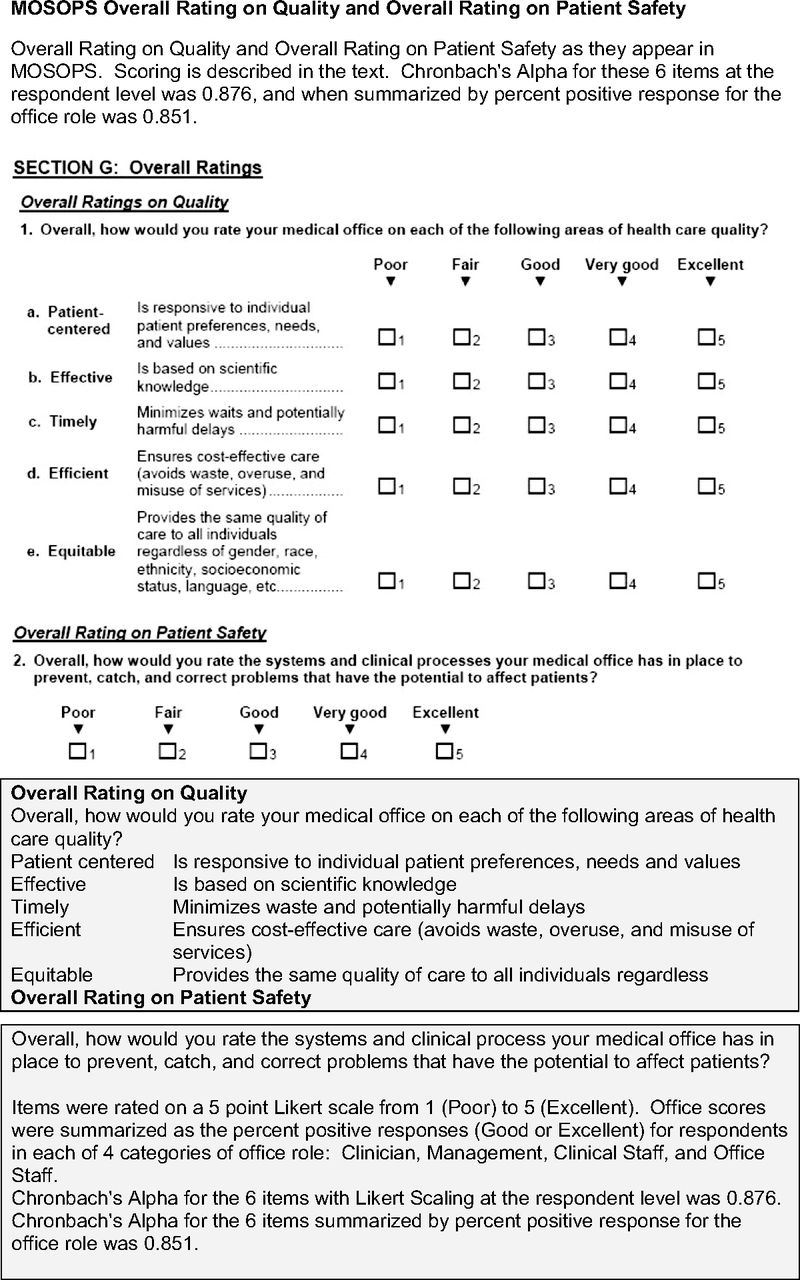
All personnel in each recruited practice, including physicians and other providers, nurses and other clinical staff, and managers and administrative staff, were asked to indicate their role in the practice, length of service at that location, and total workweek hours, and to complete the MOSOPS instrument. MOSOPS was developed to assess key dimensions of medical office safety culture, modeled after the Hospital Survey on Patient Safety.6 The MOSOPS instrument was piloted in 202 medical offices in the United States, where it was found to have good reliability for all 12 dimensions (Cronbach α = 0.75–0.9). The Overall Rating of Quality domain analyzed in this report, which comprised the 5 IOM quality dimensions, also had good reliability (Cronbach α = 0.874).3The predictive validity of similar measurements of safety culture as manifest in the perceptions of personnel has been demonstrated in hundreds of studies across a variety of industries,6⇓–8 and more recently in health care, where an association has been reported with adverse outcomes in an intensive care unit9 as well as with hospital patient safety indicators.10,11
Data Analysis
For this report, we focused our analysis on 2 questions: (1) Is overall quality and safety as perceived by clinicians and staff in PBRN medical practices associated with the size of the practice? and (2) Is overall quality and safety as perceived by clinicians and staff in PBRN medical practices associated with the degree of implementation of HIT in the practice?
The unit of analysis was the medical office. However, preliminary analysis had shown that perceived quality and safety were significantly associated with the subject's role in the practice. Therefore, we chose to employ a mixed model approach, treating the percent positive responses from clinicians, managers, clinical staff, and office staff as repeated measures for the medical office to account for the association of the respondent's perceptions with their role in the office. The models specified an unstructured correlation and included the medical offices' health system affiliations as a random effect. All post hoc comparisons between groups were restricted to statistically significant fixed effects and utilized Tukey adjustment for multiple comparisons.
Analysis was limited to the items in the Overall Rating of Quality (Figure 1). The scoring method was adapted from Sorra et al.12 For each respondent, the response to each item was categorized as positive if the rating was 4 (very good) or 5 (excellent). For a given dimension, the respondent level percent positive was taken as the average of the positive responses (4 or 5) for that dimension by that respondent. For each dimension, the office-level rating for that dimension was then computed as the mean of the respondent averages for that dimension. Because preliminary investigation indicated that ratings differed according to the respondents' role in the office and because each office varied in the ratios of survey respondents in different roles, separate ratings were computed for the average rating by role group—clinicians, managers, clinical staff and office staff—within each office. Respondents who did not indicate a role or whose role did not fit into one of these categories were not included in the analysis.

The Medical Office Survey on Patient Safety (MOSOPS) overall rating on quality and overall rating on patient safety.
Overall HIT implementation stage for each practice was summarized by taking the average reported implementation stage across the 5 HIT capabilities and then categorizing the average as low (average implementation stage ≤2); partial (average implementation stage >2 and ≤3; high (average implementation stage >3 but <4); and full (average implementation stage equal to 4). Offices were grouped by size into 4 categories: small (3–15 total personnel), medium (16–40 total personnel), large (41–70 total personnel), and very large (total personnel >70).
Results
Description of Study Sample
Surveys were collected from 6534 respondents working in 306 medical offices. Of the respondents, 213 were excluded because they did not include information about their role in the office, and 47 were excluded because fewer than 50% of the items in the Overall Rating of Quality domain were completed. The participating clinics were members of 11 PBRNs and were located in 16 states. The number of medical offices per PBRN ranged from 17 to 45. Of the 306 medical offices, 115 were independently operated, whereas 191 were associated with 19 health system organizations, with the number of responding clinics ranging from 2 to 35 offices.
Office Size and Role
The size of offices included in the survey and the proportions of personnel responding to the survey in each role group (clinicians, managers, clinical staff, or office staff) are summarized in Table 1. The median size of the total office staff for the sample was 20, with 50% of the offices having between 11 and 38 people working in the office. The median response rate per office was 84%, with 50% of the offices having response rates between 67% and 100%. The proportion of respondents who were clinicians, managers, clinical staff, or office staff varied widely across offices, as indicated in Table 1. The responses to both the individual items of the Overall Quality domain and the summary domain score were significantly associated with the respondent's role in the office. The clinicians and management had 71% positive overall quality scores, whereas the staff positive scores were 61% (P < .0001). To control for this variation in the proportion of respondents in each office role and the association of perceived quality with office role, all analyses utilized a mixed modeling approach that adjusted for office role as described in Methods.
Ownership and HIT Implementation of PBRN Offices
As shown in Table 2, more than half of the medical offices responding to the survey were owned by either physician or provider (25%) or a hospital or health system (38%). Ownership differed according to size in that more than half of the offices with a total staff of 16 to 70 people were owned by a university, hospital, or health system, and half of the offices with a total staff size of more than 70 were government owned. Stage of HIT implementation was roughly equivalent across the range of practice sizes (Table 2), with a slight trend toward higher stages of HIT implementation in offices of larger size that was not statistically significant.
Perceived Overall Rating of Quality
The Overall Rating on Quality by respondents to the survey is shown in Table 3, broken down by office size, ownership, and stage of HIT implementation. In our initial analysis after adjusting for role-associated effects, we found that perceived quality was significantly associated with office size, practice ownership, and stage of HIT implementation. However, after controlling for office size, the association with practice ownership did not persist in our final mixed model. We tested for a difference in the effect of office size within practices of different ownership types by including an interaction term for size and ownership, but neither the main effect of ownership or the interaction term were statistically significant (P = .84 for the main effect; P = 0.2398 for the interaction term; model not shown in tables).
Overall Quality and Office Size
Overall quality was rated highest in small offices and lowest in very large offices, as seen in Table 3. The proportion of positive responses to items in the Overall Quality domain declined with increasing office size, with 75% (range, 71% to 79%) positive responses about overall quality in small offices, 65% (range, 61% to 69%) in medium sized offices, 60% (range, 56% to 65%) in large offices, and 55% (range, 48% to 61%) in very large offices having more than 70 total personnel (Table 3).
We found that this effect of decreasing perceived quality with increasing office size was consistent across all components of quality as defined by the IOM: patient centeredness, effectiveness, timeliness, efficiency, and equitability were all rated highest in small practices, and ratings declined as practice size increased (Table 4). The same effect was present for perceived safety of office systems, with 71% (range, 68% to 75%) positive responses in small offices, 63% (range, 60% to 67%) in medium offices, 59% (range, 53% to 64%) in large offices, and 54% (range, 47% to 62%) in very large offices (Table 4).
Overall Quality and HIT Implementation
Overall quality varied according to stage of HIT implementation (bottom of Table 3), and this effect remained significant after controlling for office size in our final model. However the relationship of overall quality to stage of HIT implementation was more complex, with the highest quality ratings in the practices with low HIT implementation (76% [range, 67% to 85%] positive responses), the lowest ratings in the partial HIT implementation group (64% [range, 62% to 72%] positive responses), and intermediate ratings of overall quality in the high and full HIT implementation categories.
To explore this relationship between stage of HIT implementation and perceived quality and safety, we examined the relationship of each of the components of quality as defined by the IOM as well as the overall safety of office systems with each of the individual HIT capabilities: electronic appointment scheduling, electronic ordering of medications, electronic ordering of tests and images, electronic access to test and image results, and EHR. The data, shown in Table 5, show no clear relationship between the stage of HIT implementation and ratings of office system safety or the individual components of quality, although statistically significant trends are seen in 3 of the 35 comparisons. We also noted a consistent bimodal trend in the data, with the highest proportion of positive responses in offices with the least HIT (low) and those with the most HIT (high and full) and the lowest proportion of positive responses in clinics with partial implementation.
Discussion
We conducted a survey of primary care practices in PBRNs across the United States and examined the relationship between the perceived quality and safety of care in those practices and their size, ownership, and stage of HIT implementation. We found a consistent inverse relationship between the perceived quality and safety of care and the size of the practice, with the highest ratings of quality and safety in small practices and the lowest perceptions of quality and safety in large and very large practices. After controlling for size, we found no relationship between practice ownership and the perceived quality and safety of care.
We found no clear relationship between the perceived quality and safety of care and the implementation of HIT. There was a statistically significant difference for our composite HIT implementation stage, but no coherent relationship was apparent between individual HIT capabilities such as electronic ordering of medications or laboratory tests and perceived quality and safety.
The association of higher perceived quality of care and patient safety with small practice size may at first seem counterintuitive, and our data do not clarify which aspects of small practices contribute to this effect. On the one hand, large practices may be expected to have more personnel and resources that can be focused on quality improvement and patient safety activities. On the other hand, small practices may have more direct communication among staff with less fragmentation of their processes of care. In any case, the finding was robust in that this pattern was consistent for every one of the individual components of quality as defined by the IOM as well as for the overall rating of office system safety. Although it may be unexpected, notably, a similar association with size has been reported for hospitals, with larger hospitals scoring lower on the AHRQ Hospital Survey on Patient Safety Culture in 2007 through 2010.10
What features of these small practices contributed to the higher perceived safety and quality? It seems plausible that small units within large organizations might perform as well as small independent practices, however, our study did not collect information about organizational subunits and infrastructure. It also stands to reason that practices qualifying as patient-centered medical homes (PCMHs)13 might have higher quality and safety, but our study was conducted before PCMH certification was underway. Future work would be needed to explore any relationship between patient safety and quality of care and certification as a PCMH or organizational substructures within large practices.
Given the widespread impetus to implement HIT systems with advanced features throughout health care settings, our finding of no clear relationship between overall ratings of quality and patient safety with the degree of HIT implementation may also seem counterintuitive on the basis of the expectation that these systems will improve the quality and safety of care. Without further study, we can not be certain why the highest ratings of quality and safety were found in practices with the least HIT and in practices with the most HIT but lower ratings were found in practices with intermediate levels. However, even viewing the relationship between perceived quality and safety and the individual capabilities provided by HIT systems, we found no clear relationship but a similar, and intriguing, bimodal distribution of responses (Table 5).
We do know that both positive and negative effects of HIT have been reported previously. An overview of 154 studies published between 2007 and 2010 found overall positive impacts, particularly on the efficiency and effectiveness of care.14 In contrast, a systematic overview that examined 108 separate systematic reviews of HIT interventions published between 1997 and 2007 found that evidence was “weak and inconsistent” for claims of benefit of EHRs and related technologies such as order entry and decision support, with a notable lack of evidence of cost-effectiveness.15 More recently, an overview of 30 studies of the impact of HIT in primary care also reported mixed effects, with no clear relationship between the use of HIT and the outcomes of primary care.16
These findings may be less surprising if practices are viewed as complex adaptive systems. Our results underscore the findings summarized by Crabtree et al17 regarding the difficulties of practice transformation, in that small practices are best understood as complex adaptive systems in which relationships among people and components of the practice are more important than the individual components themselves. A consequence of this view of practices as complex adaptive systems is that quality and safety will be emergent properties of the practice that cannot be predicted reliably from changes to individual components. Introduction of new systems or processes will have ramifications—sometimes unexpected and sometimes undesirable—throughout the system, and more attention must be paid to relationships among the components than to the components themselves. Perhaps the apparent advantage of smaller practices found in our survey has to do with the relationships, rather than the resources, within the practices.
Limitations
Several potential limitations of our study deserve mention. First, as with any survey, there is the question of external validity because of potential sampling bias, so it is conceivable that our findings may not generalize to the broader universe of primary care practice. As described earlier in Methods, we sought a large and broadly representative sample of practices, including a variety of geographic regions, settings, patient populations, specialty mixes, and degrees of HIT implementation, to ensure external validity. It has been reported previously that PBRNS are representative of primary care in general.18
Sampling bias within practices also could threaten the validity of our findings, if only selected individuals within the practices, such as practice leadership or quality and safety personnel, completed the survey. However, the median within-practice response rate was 84%, and we further addressed this issue by controlling for role within the practice in our analysis.
Conclusions
We found that clinicians and staff in small PBRN practices reported the highest overall quality and safety of care and that perceived quality and safety declined with increasing office size. No clear relationship was found between perceived quality and safety and implementation of HIT. This may be a concern as small practices increasingly aggregate into or are brought into larger organizations, and further study is needed to better understand this relationship.
Acknowledgments
The authors express their appreciation to Nancy Rollins, Oregon Rural Practice-based Research Network, Project Coordinator; James B. Battles, PhD, Task Order Officer, Center of Quality Improvement and Patient Safety (CQuIPS), Agency for Health care Research and Quality; Paula Darby Lipman, PhD, Joann Sorra, PhD, and Naomi Dyer, PhD, from Westat; the principal investigators and research coordinators of the 11 PBRNs, and the clinicians and staff at the participating medical offices.
Notes
This article was externally peer reviewed.
Funding: This project was supported by contract no. HHSA290 2007 10016 from the Agency for Healthcare Research and Quality (AHRQ). Additional support from a Clinical and Translational Science Award to Oregon Health & Science University, NIH/NCRR 1UL1 RR02414-01.
Conflict of interest: none declared.
- Received for publication March 2, 2012.
- Revision received June 4, 2012.
- Accepted for publication June 19, 2012.


