
Article Figures & Data
Figures
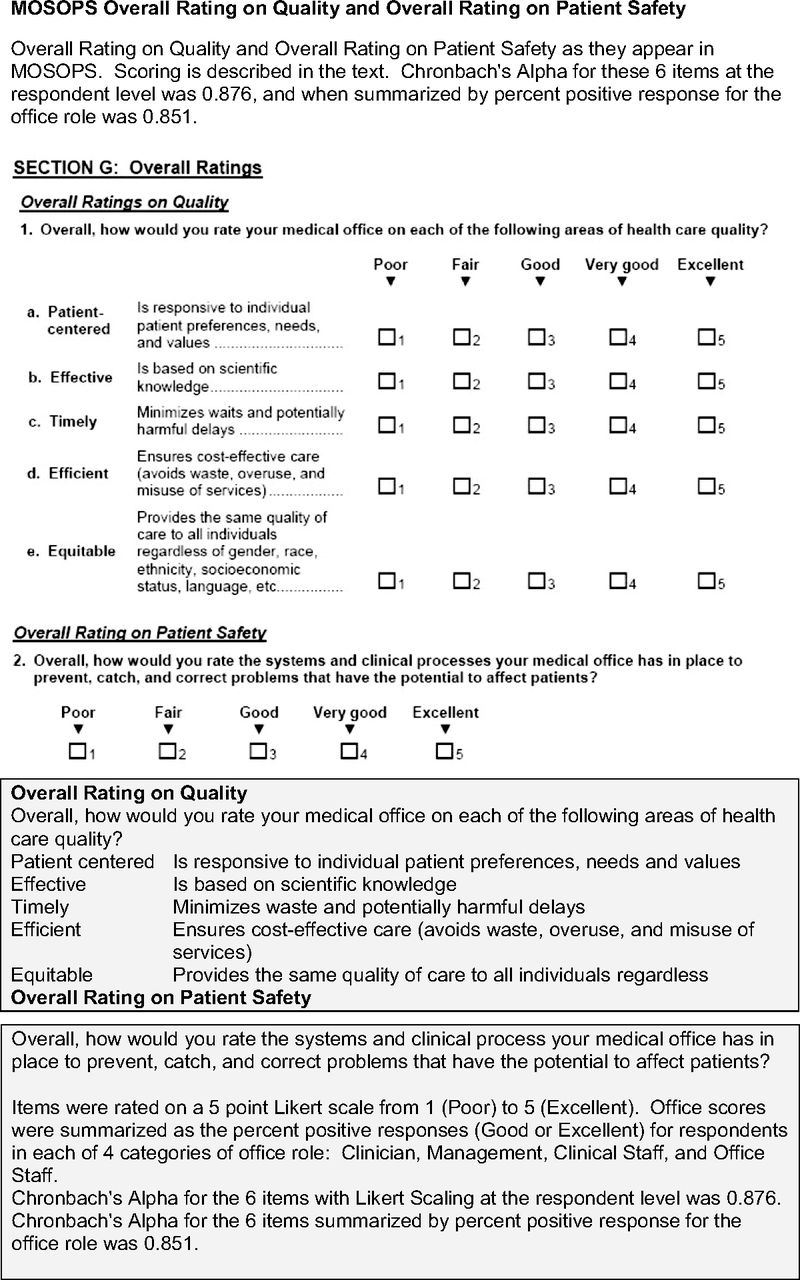
- Figure 1.
The Medical Office Survey on Patient Safety (MOSOPS) overall rating on quality and overall rating on patient safety.

Tables
- Table 1. Distribution of Staff Roles in Medical Offices in This Sample and among Respondents
Staff in Office, n Proportion in Role, % Office-Wide Response Rate, % All roles 20 (11–38), 3–280 100 84 (67–100), 16–100 Office roles Clinicians 5 (3–10), 1–90 27 (20–33), 5–100 23 (15–30), 0–72 Management 1 (1–2), 0–40 6 (4–11), 0–57 7 (3–11), 0–50 Clinical staff 7 (4–12), 0–90 35 (26–47), 0–90 36 (29–46), 0–100 Office staff 5 (3–11), 0–125 29 (20–36), 0–90 27 (20–36), 0–83 Data provided as median (interquartile range), range.
- Table 2. Size, Ownership, and Stage of Health Information Technology (HIT) in Medical Offices in Sample
Total Sample Small (3–15) Medium (16–40) Large (41–70) Very Large (> 70) P (vs Provider Owned) Owner* Provider/physician 78 (25) 38 (32) 30 (26) 7 (15) 3 (14) Hospital or health system 133 (38) 70 (58) 42 (36) 16 (34) 5 (23) .9012 University or academic 61 (20) 7 (6) 35 (30) 17 (36) 2 (9) .9480 Government 25 (8) 2 (2) 7 (6) 5 (11) 11 (50) <.0001 Other 9 (3) 3 (3) 3 (3) 2 (4) 1 (5) .8959 HIT implementation stage† P (vs Full Implementation) Low 16 (5) 9 (8) 6 (5) 1 (2) 0 (0) .9988 Partial 86 (28) 38 (32) 32 (27) 11 (23) 5 (23) .9220 High 109 (36) 41 (34) 36 (31) 14 (45) 11 (50) .1970 Full 95 (31) 32 (27) 43 (37) 14 (30) 6 (27) Totals 306 120 (39) 117 (38) 47 (15) 22 (7) Data provided as n (%).
↵* Differences in size associated with category were assessed through ordinal regression of office size category (from Table 1) on ownership type or HIT stage. Reported P values are adjusted for multiple comparisons (Tukey).
↵† Implementation stages were averaged for 5 capabilities as described in the text.
- Table 3. Overall Rating on Quality by Office Size, Ownership, and Health Information Technology (HIT) Implementation
Fixed Effect and Categories No. in Category Effects Modeled Separately Combined Model Role-Adjusted % Positive Ratings* Global P Adjusted % Positive Ratings† Global P Office size Small (3–15 staff) 120 75 (71–79) <.0001 75 (72–79) <.0001 Medium (16–40 staff) 117 65 (61–69)‡§ 65 (61–69)‡§ Large (41–70 staff) 47 60 (56–65)‡ 60 (56–65)‡ Very large (>70 staff) 22 55 (48–61)‡§ 55 (48–61)‡§ Ownership Provider owned 78 72 (67–78)§ .0077 Not included¶ Government owned 25 60 (52–67)§ University/academic 61 62 (56–69) Hospital/health system 133 69 (64–74) Other 9 68 (64–74) HIT implementation level Low 16 76 (67–85)§ .0268 74 (67–82)§ .0102 Partial 86 64 (59–70)§ 64 (60–68)§ High 109 69 (64–74) 70 (66–73)§ Full 95 67 (62–72) 68 (64–72) Data provided as mean (95% confidence interval).
↵* Estimated through mixed models that included respondent role and the specified office characteristic as fixed effects. Models treated the 4 scores due-role as repeated measures for the office and included health system group membership as a random effect. The main effect of role was significant at P < .0001 in all models.
↵† Estimated from the combined model with role, office size, and HIT implementation level as fixed effects.
↵‡ Post hoc pair-wise comparison with small (3–15 staff) significant at P < .0001 after Tukey adjustment.
↵§ Post hoc pair-wise comparison significant at P < .05 after Tukey adjustment.
↵¶ If ownership is added-the combined model P = .4610.
Average % Positive Rating Overall Quality Item Patient Centered Effective, Based on Scientific Knowledge Timely Efficient (Cost-Effective) Equitable Overall Safety Rating of Office Systems Office Size* Small (3–15 staff) 78 (73–82) 78 (74–83) 64 (60–68) 69 (64–74) 89 (86–92) 71 (68–75) Medium (16–40 staff) 69 (64–73) 72 (67–76) 46 (42–50) 54 (50–59) 85 (82–89) 63 (60–67) Large (41–70 staff) 64 (58–70) 68 (63–74) 42 (36–48) 46 (40–52) 81 (77–85) 59 (53–64) Very Large (≥71 staff) 55 (46–64) 63 (55–70) 38 (29–47) 42 (34–50) 76 (71–82) 54 (47–62) Global P (overall effect of size) <.0001 <.0001 <.0001 <.0001 <.0001 <.0001 Pair-wise comparisons† Small vs medium .0013 .0087 <.0001 <.0001 .1128 .0065 Small vs large .0002 .0028 <.0001 <.0001 .0005 .0007 Small vs very large <.0001 .0006 <.0001 <.0001 .0001 .0006 Medium vs large .4724 .6551 .6833 .0625 .0837 .4838 Medium vs very large .0166 .1161 .2864 .0182 .0097 .1627 Large vs very large .2652 .5544 .8267 .7584 .4874 .7941 - Table 5. Overall Rating of Quality and Individual Health Information Technology (HIT) Capabilities
HIT Implementation Stage Average % Positive Rating N (%) Patient Centered Effective (Scientific) Timely Efficient (Cost-Effective) Equitable Overall Safety of Systems Averagef Quality Score Electronic appointment scheduling Not implemented 6 (2) 76 (60–92) 78 (64–91) 55 (36–73) 62 (46–78) 89 (79–99) 57 (42–73) 71 (59–83) Planned within 12 months 3 (1) 56 (34–78) 67 (47–86) 35 (9–60) 42 (20–64) 84 (71–97) 45 (22–67) 54 (37–71) Implementation in process 5 (2) 64 (47–80) 72 (57–86) 47 (28–66) 49 (32–65) 78 (68–88) 62 (46–78) 62 (50–75) Fully implemented 289 (95) 66 (62–71) 70 (67–74) 48 (44–51) 54 (49–59) 83 (80–86) 62 (59–66) 64 (60–68) P .4518 .7115 .6602 .4404 .4415 .4218 .3743 Electronic medication ordering Not implemented 32 (10) 71 (64–79) 73 (67–80) 47 (39–55) 56 (48–64) 84 (79–89) 63 (56–69) 66 (60–71) Planned within 12 months 51 (17) 66 (60–73) 69 (63–74) 46 (40–53) 50 (43–57) 82 (78–86) 58 (53–64) 62 (57–67) Implementation in process 62 (20) 63 (57–69) 69 (64–74) 47 (41–52) 53 (46–59) 81 (77–85) 60 (55–65) 62 (58–66) Fully implemented 160 (52) 67 (62–71) 70 (67–74) 48 (44–52) 55 (48–61) 83 (80–86) 64 (60–67) 65 (61–68) P .2144 .5742 .9255 .3900 .4929 .3017 .3738 Electronic procedure and image ordering Not implemented 52 (17) 70 (63–76) 70 (65–76) 47 (41–53) 53 (47–58) 84 (80–88) 61 (56–67) 64 (60–69) Planned within 12 months 62 (21) 61 (55–67) 65 (60–70) 41 (35–47) 47 (42–52)* 80 (76–84) 57 (52–63) 59 (54–63)* Implementation in process 49 (16) 67 (61–73) 73 (67–78) 50 (43–56) 58 (53–64)* 85 (81–89) 66 (60–71) 66 (62–71)* Fully implemented 139 (46) 67 (62–71) 71 (67–74) 49 (45–53) 54 (50–57) 83 (80–86) 63 (59–66) 64 (61–68) P .0688 .1044 .0953 .0189 .0630 .1230 .0274 Electronic results access Not implemented 12 (4) 77 (65–88) 71 (61–81) 53 (40–66) 55 (44–67) 90 (82–97)* 71 (59–82) 71 (62–79) Planned within 12 months 16 (5) 62 (52–72) 63 (55–72) 37 (26–48) 49 (39–59) 76 (70–82)* 55 (46–65) 58 (50–65) Implementation in process 69 (23) 65 (59–71) 69 (64–74) 45 (39–51) 52 (45–58) 83 (79–87) 60 (55–66) 62 (58–67) Fully implemented 207 (68) 67 (62–71) 71 (67–74) 49 (46–53) 54 (49–60) 83 (80–86) 63 (60–67) 65 (61–68) P .1678 .3139 .0954 .5264 .0189 .1429 .0777 Electronic health/medical records Not implemented 35 (12) 66 (59–73) 70 (64–76) 47 (39–54) 53 (46–59) 83 (78–87) 59 (53–66) 64 (58–69) Planned within 12 months 48 (16) 60 (53–66) 65 (60–71) 41 (34–48) 46 (41–52) 80 (76–84) 57 (52–63) 58 (53–63) Implementation in process 35 (12) 68 (61–75) 70 (64–76) 49 (42–57) 55 (49–62) 84 (80–89) 61 (54–67) 64 (59–70) Fully implemented 186 (61) 67 (63–71) 71 (67–75) 49 (45–52) 54 (51–57) 83 (80–86) 64 (60–67) 65 (61–68) P .1291 .2695 .1816 .0798 .4566 .1723 .0643 Data presented as means adjusted for role and office size (95% confidence intervals) unless otherwise indicated. Note that HIT elements were added individually for models that each included office size and role.
↵* Post hoc pair-wise difference statistically significant at P < .05 after Tukey's adjustment for multiple comparisons.


