
Abstract
Introduction: Health care reimbursement is increasingly based on quality. Little is known about how clinic-level patient characteristics affect quality, particularly in community health centers (CHCs).
Methods: Using data from electronic health records for 4019 diabetic patients from 23 primary care CHCs in the OCHIN practice-based research network, we calculated correlations between a clinic's patient panel characteristics and rates of delivery of diabetes preventive services in 2007. Using regression models, we estimated the proportion of variability in clinics' preventive services rates associated with the variability in the clinics' patient panel characteristics. We also explored whether clinics' performance rates were affected by how patient panel denominators were defined.
Results: Clinic rates of hemoglobin testing, influenza immunizations, and lipid screening were positively associated with the percentage of patients with continuous health insurance coverage and negatively associated with the percentage of uninsured patients. Microalbumin screening rates were positively associated with the percentage of racial minorities in a clinic's panel. Associations remained consistent with different panel denominators.
Conclusions: Clinic variability in delivery rates of preventive services correlates with differences in clinics' patient panel characteristics, particularly the percentage of patients with continuous insurance coverage. Quality scores that do not account for these differences could create disincentives to clinics providing diabetes care for vulnerable patients.
Health care service reimbursements to providers are increasingly based on value;1⇓⇓⇓–5 for example, “pay for performance” is a payment mechanism proposed to incentivize the consistent delivery of high-quality services.6,7 The premise underlying most such programs is to reward health care providers for delivering high-quality care and to provide regular feedback on adherence to performance standards.8,9
The metrics currently used to measure quality of care rarely account for patient characteristics that might affect the quality of clinics' performance.10⇓–12 This is concerning because a growing literature shows an association between the characteristics of clinics' and providers' patient panels and the quality of care provided to these panels.11,13⇓⇓⇓⇓⇓⇓–20 Much of the focus of this literature has been on the relationship between quality of care and the characteristics of patients' comorbidities and disease severity, rather than their sociodemographic factors (e.g., race/ethnicity, income, insurance coverage status), despite the known relationship between such characteristics and quality of care at the individual patient level.21,22 Furthermore, little is known about which clinic-level patient panel characteristics are most strongly associated with variation in clinics' rates of delivery of primary care services–information that may be especially pertinent for community health centers (CHCs) and others providing care to underserved populations (e.g., the uninsured and racial/ethnic minorities). While CHCs provide health care comparable in quality to that provided by private practices,23⇓⇓–26 quality of care and patient demographics may vary between individual CHCs.27,28
Practice-based research networks (PBRNs), which comprise multiple clinics, provide a unique opportunity to further our understanding of which patient panel characteristics are most associated with a clinic's performance profile. This is especially true if the clinics within a PBRN network share a common electronic health record (EHR). Linked EHR data also make it possible to examine the extent to which a clinic's quality measurements are affected when only patients seen primarily at that clinic are included in its “panel” denominator compared to when all patients seen at the clinic are in the denominator. This question will become increasingly important as methods for measuring quality shift from manual chart reviews to the assessment of EHR data, which will make it possible to determine which patients are being seen at multiple primary care clinics versus those using only one clinic.
We hypothesized that, within our study CHCs, performance variation would be correlated with differences in the characteristics of the clinics' patient populations and that a significant proportion of the clinic-level variability in rates of delivery of preventive services could be explained by the clinic-level summaries of their patients' sociodemographic characteristics. To test this hypothesis, we examined variability in rates of delivery of diabetes preventive services among the CHC primary care clinics that are members of the OCHIN PBRN and share a linked EHR. We assessed the degree to which certain clinic-level patient panel characteristics (e.g., the percentages of patients in various income and insurance coverage status categories) were correlated with clinic performance. Our objectives were to (1) describe differences in patient panels and rates of delivery of recommended diabetes care among 23 CHC primary care clinics in the OCHIN network and (2) assess associations between clinic-level patient characteristics and variability in clinic rates of providing recommended diabetes preventive care services. Last, we sought to (3) assess the effect of using different methods to quantify the patient panel denominators by adjusting panel denominators to assign a patient to only one clinic (the clinic which the patient visited most often) or to all clinics used by that patient.
Methods
Data Sources: EHR and Medicaid Insurance Enrollment Data
In 2001, a group of safety net organizations in Oregon collectively purchased the Epic EHR system and created the Oregon Community Health Information Network (OCHIN). This network has grown beyond Oregon, with members from 14 states, and is now referred to as simply “OCHIN.” This network provides health information technology support to member CHCs, including a centrally hosted and maintained EHR. OCHIN′s shared EHR and fully integrated electronic health information exchange allow each patient to have a single medical record shared across every clinic in the network.29 Because most of the OCHIN PBRN′s member clinics are federally qualified health centers (FQHCs), they are required to collect comprehensive information on patient demographics and insurance coverage, in addition to the clinical information commonly found in EHRs, such as patients' medical history and receipt of services and procedures.
FQHCs care for many of the nation's most vulnerable populations, including uninsured patients. In this study, the OCHIN clinics' shared EHR facilitated the examination of quality metrics at the patient, clinic, and population levels.29 Because most of the study CHCs are in Oregon, we also linked patient-level data on Medicaid insurance enrollment in Oregon to supplement the EHR records on patients' Medicaid coverage in 2007.
Study Population
The study population included adults (at least 19 years of age as of December 31, 2004) with diabetes mellitus who were seen at a CHC primary care clinic that had implemented OCHIN′s EHR by 2005. Within this population, we required patients to have at least 2 visits associated with an International Classification of Diseases, Ninth Revision, code for diabetes mellitus (type 1 or 2) in 2004 to 2005 and at least one primary care visit at a given clinic in both 2006 and 2007 to be considered part of a clinic's “continuity panel.” In the 48 CHC clinics with OCHIN EHR data available for the study period, 4188 patients met these requirements. To enable clinic-level evaluations and avoid unstable estimates of preventive services rates, we further limited the analyses to primary care clinics with at least 50 diabetic patients meeting our continuity criteria (n = 23 clinics in 2 states, with 4019 patients). We found that 417 of these 4019 patients (11% of the population) met the continuity criteria for 2 clinics, and an additional 8 patients met the criteria for 3 clinics. Thus, we used 2 approaches to define clinic patient panels: (1) “restricted” panels limited each patient to a single clinic's panel, and (2) “full” panels allowed the 425 patients who had multiple visits at ≥2 clinics to be included in the panel denominator for all clinics for which they met continuity criteria.
Clinic Patient Panel Characteristics
We described clinic panels according to several sociodemographic characteristics of their patients, including patient age, race, primary language, mean percentage of federal poverty level (FPL) in 2007, percentage of patients with continuous insurance coverage in 2007, and percentage of patients with no insurance coverage in 2007. Because most clinics in the OCHIN PBRN are FQHCs, information on patients' income as a percentage of the FPL is reported at each visit. If more than one income level was reported for a patient in 2007, we used this information to estimate the mean percentage of the FPL for 2007 based by a weighted average of each patient's reported percentage of FPL, accounting for the amount of time between the reported FPLs. The percentage of time that the patient had insurance coverage in 2007 was determined by start and end dates of insurance coverage, as recorded in the EHR and supplemented by Oregon's Medicaid insurance enrollment data for Oregon patients with public coverage in 2007.
Clinic Rate of Delivery of Diabetes Preventive Care Services
We assessed 4 evidence-based diabetes preventive care services: lipid (low-density lipoprotein [LDL]) screening, influenza vaccination, nephropathy screening (urine microalbumin), and hemoglobin (HbA1c) monitoring. It is generally recommended that patients with diabetes mellitus receive each of these services at least annually.30 We used OCHIN EHR data to identify procedure codes that confirmed delivery of each service at least once in 2007 (See Appendix Part A, available online).
Statistical Analyses
We described differences in clinic-level patient panels and in rates of delivery of the 4 diabetes preventive services. We then calculated Spearman rank correlations to examine the strength of associations between clinic-level patient panel characteristics and the percentage of patients at each clinic who were provided the recommended services. Linear regressions of quality metrics, modeled as continuous variables, were used to determine the proportions of variability in clinic performance metrics that were associated with variability in the patient panels' sociodemographic characteristics. The increase in the proportion of variability accounted for by the models was determined by the change in the model r2 with stepwise additions of patient characteristics. The order of addition of patient characteristics was determined using a maximum r2 criteria. Because rates of service delivery must fall between 0% and 100%, quality metrics were logit transformed before linear regression analysis. Logit transformations—the log of the proportion of patients with delivered services/ (1 − the proportion of patients who received services), which is the link function used in logistic regressions—were used to keep the predicted values from the regressions bounded between 0 and 1 and to improve the fit of the model residuals to a normal distribution (See Tables in Appendix Part B, available online).
To explore whether clinic performance was affected by how we defined the patient denominator, we compared the association between patient characteristics and service delivery in both full clinic panels (including in the panel denominators patients attending multiple clinics, if they met continuity criteria at each of those clinics) and in restricted clinic panels (limiting patients to the panel of the clinic that they attend most often; if attending 2 clinics equally often, we assigned them to the clinic they attended most recently).
This study was approved by the institutional review board at our academic health center.
Results
Clinic and Patient Panel Characteristics
There were 19 CHC primary care clinics geographically spread throughout the state of Oregon, in both urban and rural settings, and 4 clinics in California. All but 3 of the study clinics were FQHCs. Among the 4019 patients who met the study inclusion criteria in 2007, a mean of 188 diabetic patients (range, 59–379) were included in the full panel for each clinic. In the restricted panels (limiting each patient to one clinic resulted in <50 patients per clinic in some of the restricted panels), a mean of 173 diabetic patients (range, 30–378) attended each clinic. The clinics' patient panel characteristics varied considerably (Table 1). For example, the percentage of clinic patients whose primary language was Spanish ranged from 0% to 87.4% in both the full panels (median, 28.3%) and restricted patient panels (median, 27.6%). The percentage of clinic patients who were continuously uninsured in 2007 ranged from 1% to >50% (full panel: range, 1.0% to 57.0%, median, 30.0%; restricted panel: range, 2.0% to 56.0%, median, 30.0%). The percentage of clinic patients who were continuously insured ranged from 34.0% to 99.0% in the full panels and 34.0% to 98.0% in the restricted panels.
Variability in Patient Panels
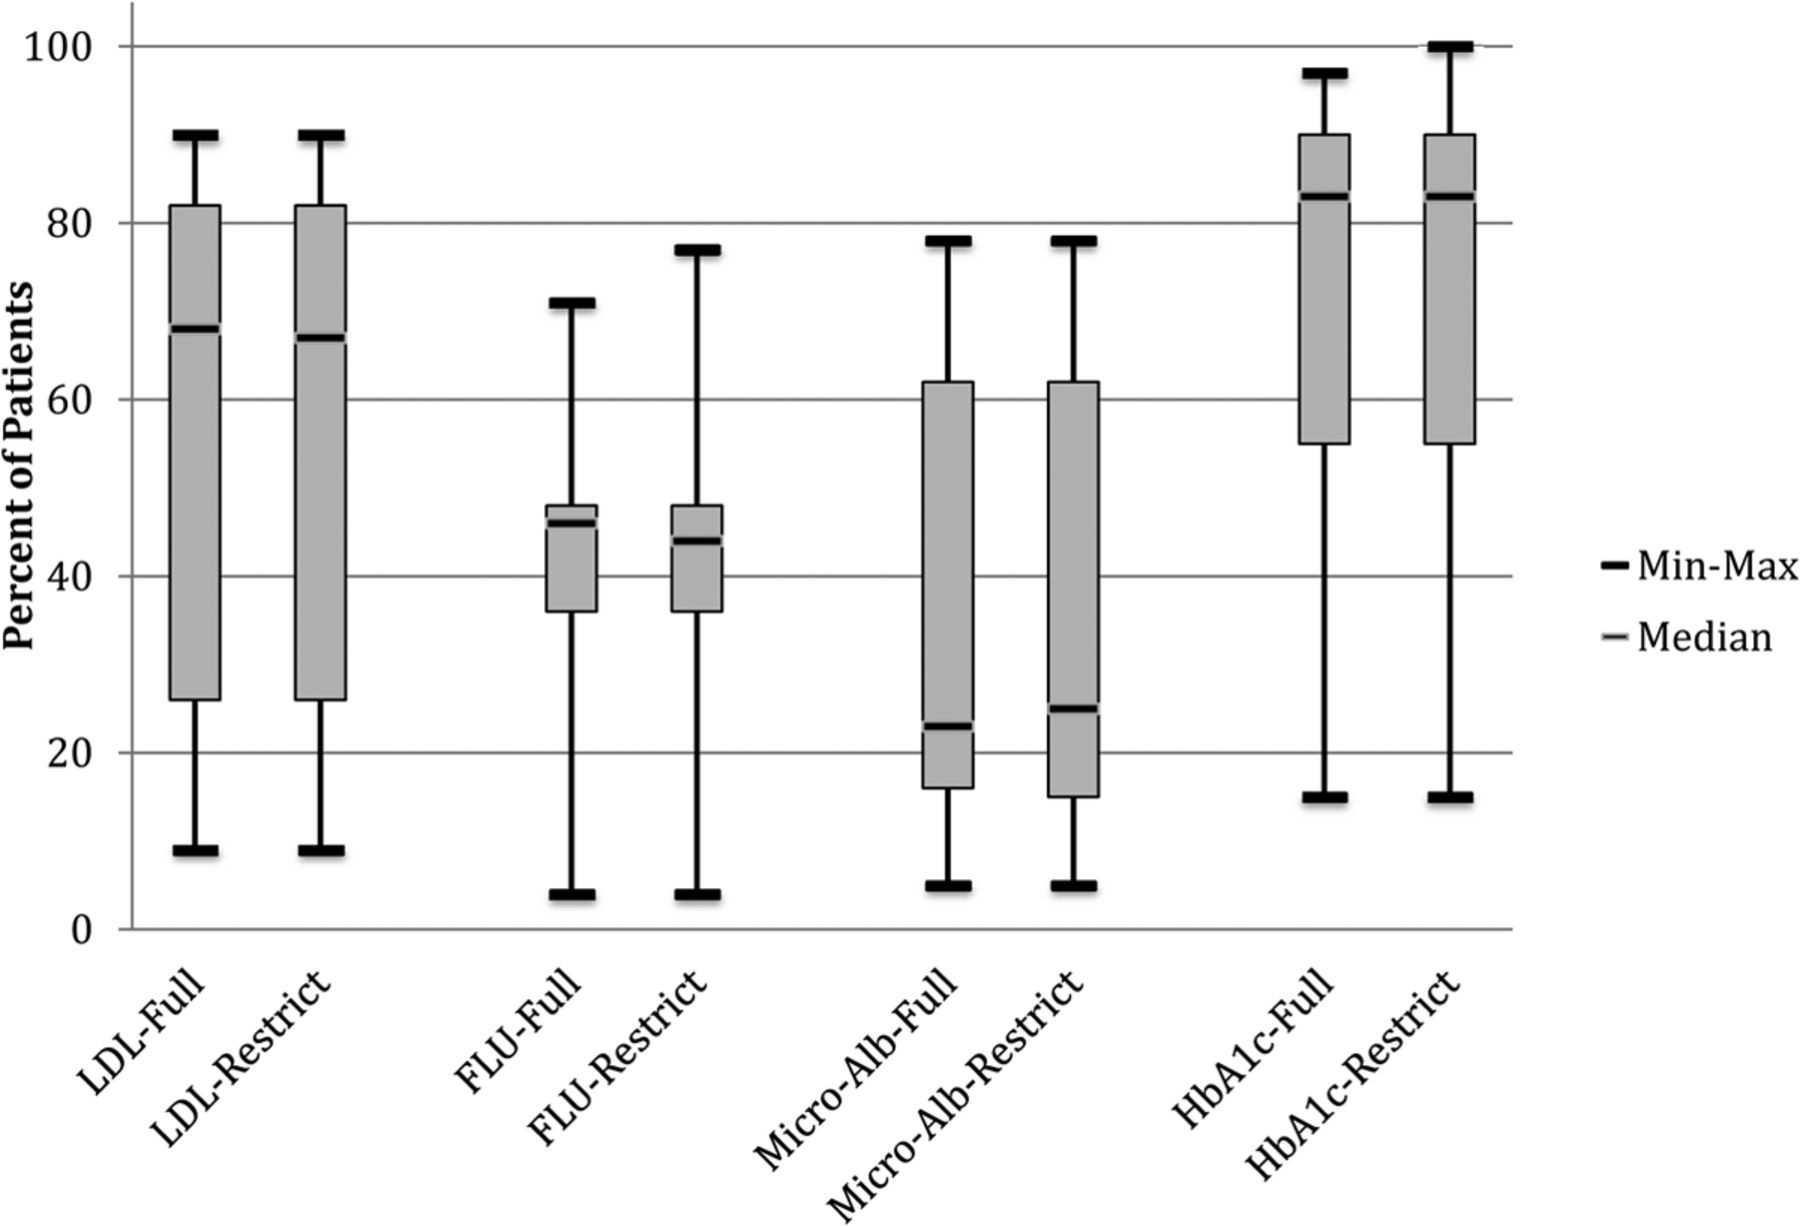
Rates of delivery of diabetic preventive services also varied by clinic (Figure 1). In the full patient panels, the median rate of delivery of LDL testing was 68.0% (mean, 57.3%; standard deviation [SD], 29.7%), 46.0% for influenza vaccination (mean, 42.8%; SD, 15.6%), 23.0% for microalbumin testing (mean, 33.6%; SD, 23.6%), and 83.0% for HbA1c screening (mean, 74.5%; SD, 23.6%). The width of the interquartile range of rates of delivery of preventive services varied by service, with a fairly narrow range for delivery of influenza vaccination and HbA1c and a much wider range for delivery of LDL and nephropathy screening. Little difference was seen in the evaluation of clinics' performance by restricted versus full panels.

Variability in the percentage of patients provided diabetes-related preventive services in the full versus restricted patient panels at the clinic level. FLU, influenza vaccination; HbA1c, hemoglobin A1c monitoring; LDL, low-density lipoprotein cholesterol screening; Micro-Alb, urine microalbumin screening.
Clinic Patient Panel Characteristics and Rates of Diabetes Preventive Services
Table 2 displays the Spearman rank correlations between clinics' patient panel characteristics and rates of diabetes preventive services. In both the full and restricted patient panel models, several panel characteristics correlated significantly with performance rates. The mean age of clinic patients was positively correlated with the percentage of patients who received influenza vaccinations and HbA1c testing; the percentage of patients with no insurance in 2007 was negatively correlated with rates of HbA1c testing, LDL screening, and influenza vaccination. Conversely, clinic delivery of the latter 3 services was positively correlated with the percentage of clinic patients who were continuously insured in 2007. The percentage of clinic patients with income <50% of the FPL was positively correlated with rates of influenza vaccination. The primary language spoken by clinic patients was not correlated with delivery rates of any of the services. Rates of microalbumin screening were positively correlated with the percentage of minority (nonwhite) patients, which could be due to the higher prevalence of diabetic nephropathy among nonwhites,31,32 and were not correlated with the other clinic-level patient characteristics measured. The patterns of correlations were similar in the restricted model; only the correlation between rates of HbA1c testing and average patient age lost significance in the restricted models.
The proportions of clinic variability in delivery of diabetic services associated with variation in clinics' patient panel characteristics are shown in Table 3 and illustrated in Figure 2. Of the patient panel characteristics included in this analysis, the percentage of clinic patients with continuous insurance coverage accounted for the largest proportion of clinic variance in LDL screening, HbA1c assessment, and influenza immunization rates: it accounted for >25% of the clinic variance in both LDL screening and HbA1c assessment rates in the full patient panels and for 18% of the variance in rates of influenza immunizations. Although the percentage of patients with no insurance coverage and mean patient age also accounted for a significant proportion of clinic variance in service rates, both were highly correlated with the percentage of patients with full insurance coverage (r = 0.82 for mean age and −0.99 for patients with no insurance coverage in the full panels). Neither variable significantly increased the model fit if included in a regression with the percentage of patients with full insurance coverage.

Proportion of variability in the percentage of patients provided diabetes-related preventive services accounted for by clinic-level patient panel characteristics. Note that the percentage variability associated with clinic patient panel characteristics was determined from the change in r2 when the variable was added to a model already containing the variables with stronger associations with delivery of the service. The variable order was determined through stepwise selection based on the addition of variables, resulting in the maximum change in r2. The proportion of clinic variability in the delivery of a service that is not explained by a model including all patient characteristics in this study is shown in gray. *P < .05. HbA1c, hemoglobin A1c monitoring; LDL, low-density lipoprotein cholesterol screening; Micro-Albumin, urine microalbumin screening.
Neither the percentage of the clinic patient panels who spoke English or Spanish, nor the percentage with an average income level <50% of the FPL, accounted for a significant proportion of variability in clinic delivery of diabetic services. Minority status did not account for a significant portion of the variability in the rates of LDL screening, HbA1c assessments, or influenza immunization, but it accounted for 55% of the variability in microalbumin assessment rates. The positive association between the percentage of racial minorities and rates of LDL and microalbumin assessments were the only associations with significant semipartial correlations when we also adjusted for the percentage of patients with continuous insurance coverage.
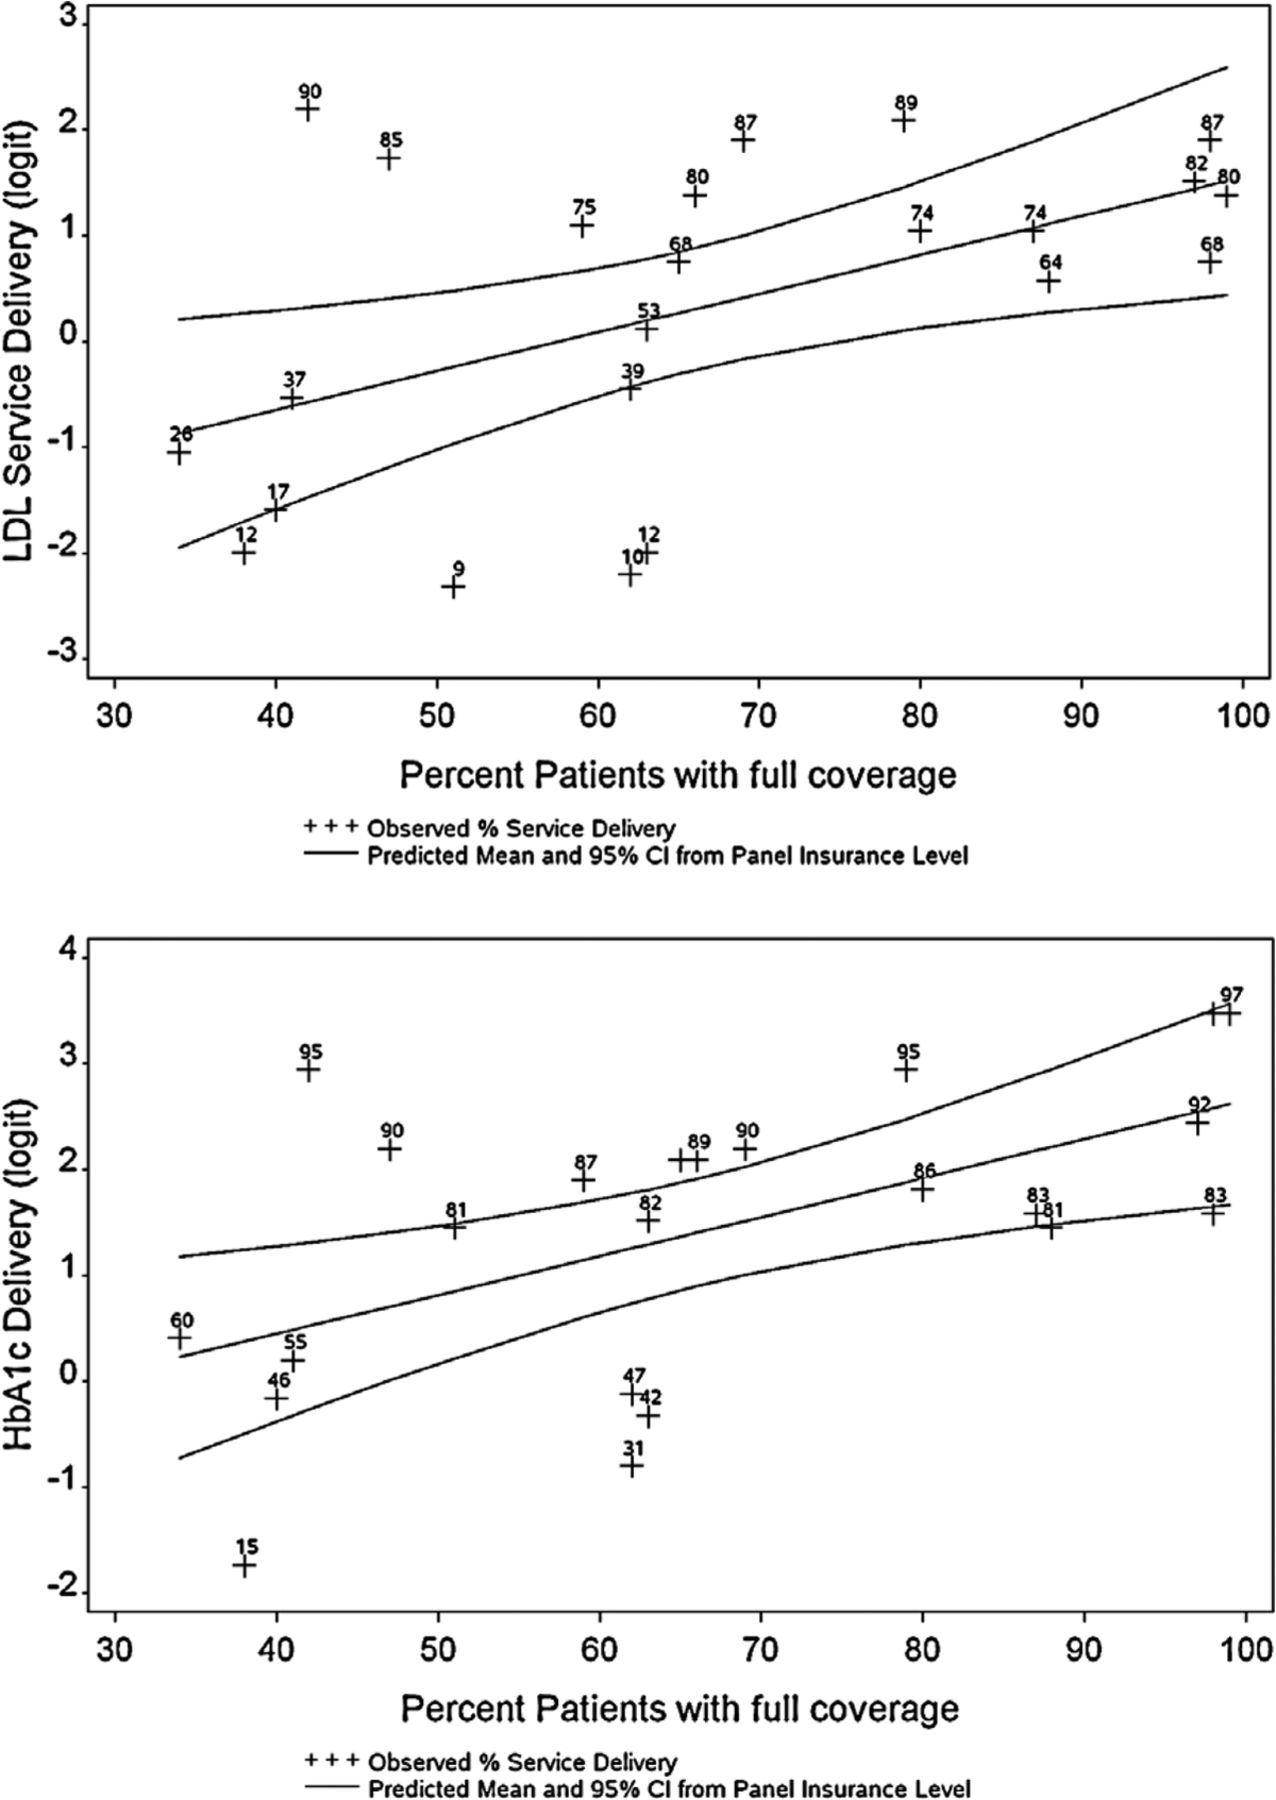
To present the associations described in Table 3 in a different modality, Figure 3 shows the observed clinic rates of LDL and HbA1c tests superimposed on the rates of preventive services predicted from linear regression on the percentage of continuously insured patients in the clinic's patient panel. As shown, a cluster of clinics falls within the 95% confidence interval predicted by the percentage of patients with full insurance coverage in their panels. Many other clinics fall close to these predicted preventive service rates; there are few outliers.

Observed rates of diabetes preventive services by clinic compared with rates predicted by the percentage of each clinic's patient panel with full insurance coverage. Note that predicted values and 95% confidence intervals (CIs) were estimated from regression models of the delivery of preventive service rates on the percentage of patient panel with full insurance coverage. The model used logit-transformed rates to keep the predicted rates bounded between 0% and 100%. Graphed values are the logit transformed values (y-axis) of observed values labeled with the actual rates (percentages) to facilitate interpretation. HbA1c, hemoglobin A1c; LDL, low-density lipoprotein cholesterol.
Discussion
Variability in clinics' rates of delivery of diabetes preventive services across the 23 study clinics was highly correlated with certain clinic-level patient panel characteristics. The strongest association was between rates of insurance coverage (or lack of coverage) in a clinic's patient panel and the clinic's rates of delivering recommended care: the higher the percentage of a clinic's patient panel continuously insured, the higher the clinic's performance. This confirms and expands on previous findings of an association between insurance coverage and rates of diabetes care at the individual patient level by demonstrating this association at the clinic level.21,33,34
One possible explanation for this finding may be that even if services are ordered or recommended by clinicians, uninsured patients are more likely to forego or delay the service because of cost.35,36 If this is true, a clinic's quality score may be less reflective of how consistently services are recommended and more reflective of how likely it is that their patients can afford to access the recommended services. Although our PBRN clinicians anecdotally reported this phenomenon on several occasions, qualitatively confirming this was beyond the scope of this article. Another possible explanation may be that clinicians were less likely to order recommended tests that would cost uninsured patients money out of pocket compared with recommending care for insured patients. Previous studies have shown that clinicians do consider a patient's insurance status when recommending care.37
Notably, we found few differences in clinic performance rates when a patient was assigned to only one clinic (restricted panel) compared with when a patient was included in more than one clinic's denominator (full panel). This finding is relevant to discussions about how to define a clinic's patient panel denominator for quality assessments and payment based on population health indicators. For example, a recent study reported the complexity of defining clinic patient panels to enable them to generate quality reports based on an accurate denominator within a medical home setting.38
Implications for Practice and Policy
Our findings caution against the common practice of comparing clinics' quality of care without accounting for differences in their patient panel characteristics. The significant correlation between quality of care and clinic patients' insurance coverage suggests that insurance disparities may explain, at least in part, differences in quality between clinics, especially those measured using some of the current quality metrics. These findings further suggest that CHCs and other safety net providers may be constrained in their ability to improve the quality of performance until meaningful insurance coverage expansions are achieved and sustained in the United States. At the very least it will be important that patients maintain continuous coverage.34,39,40 There is movement in this direction at the policy level as many states are expanding insurance coverage options through the implementation of the Affordable Care Act; however, it is too soon to know whether these efforts will translate into meaningful reform.
Our results also indicate the potential for unintended consequences of policies that incentivize clinics to improve quality without accounting for vulnerabilities in their patient panels. Many primary care practices already limit the number of uninsured patients on their panels because of financial constraints; unadjusted quality measurement policies could lead to further limitations of this kind, thus exacerbating the access problems already faced by vulnerable populations. As cautioned by others, clinic payment models that incentivize quality improvements must not dissuade providers from caring for vulnerable patients or penalize clinics if services were not offered or performed because of a lack of insurance or a patient's inability to pay.41,42 As demonstrated in Figure 3, several of the study clinics' performance assessments would be markedly improved by adequately adjusting for their patient panel characteristics. Although this is a simple model based on a single characteristic and a small number of clinics, adjusting for the level of insurance coverage among a clinic's patient panel shifted the quality ranking of 4 of the clinics to a higher quartile. This illustrates the potential impact of unadjusted quality indicators on the assessment of clinic performance.
Future Research Needs
Research is needed to further investigate the observed variability in clinics' performance measures to better understand its underlying causes. Nevertheless, these results indicate the need for caution when comparing quality across diverse clinic sites without accounting for differences in patient panel characteristics. If reimbursement levels are based on such unadjusted metrics, it may damage an already fragile safety net and reduce vulnerable populations' access to health care. There is an urgent need to develop and validate an evidence-based formula enabling “vulnerability adjustment” of clinic quality scores. As shown in Figure 2, continuous insurance coverage accounted for 18% to 31% of the variance in delivery rates for 3 of the 4 diabetes preventive services assessed; full adjustment likely would need to account for factors that influence patient care beyond insurance coverage and the other factors assessed here.
Another phenomenon that deserves further study is that of patients using services in multiple clinics. More than 10% of the patients in our study made repeat visits to more than one clinic during the study period. Although our 2 methods of assigning patients to clinic panels (restricted vs. full) did not affect the clinics' quality measures, further investigation would inform the development of prospective payment mechanisms and quality metrics based on accurately defined clinic populations. For example, if a patient goes to multiple clinics, which clinic should get a prospective global payment for the care of that patient? Should multiple clinics be able to claim a patient in their panel? How can the primary clinic capture information on patient services provided at other sites to more accurately report and not duplicate services?
PBRNs are ideally suited to address these research and practice-based needs because they can generate information about the provision of services across clinics. Furthermore, research involving multiple practices with diverse patient populations could be conducted in a network of PBRNs, such as those recently funded by the Agency for Health Care Research and Quality through the P30 Research Center in Primary Care Practice–Based Research and Learning mechanism. This research will provide an unprecedented opportunity to assess the factors associated with service delivery in primary care settings across the United States.
Limitations
We used the most common codes for identifying diabetes preventive services and may have missed some services; however, our analyses from other studies in this population suggest a low rate of missed services.43 We also might have missed services received outside of the OCHIN member clinics; however, our inclusion criteria ensured a minimum level of continuity of care at these clinics. To avoid incorrectly identifying patients as diabetic based on a single visit, patients were identified as having diabetes if they had at least 2 visits associated with a diabetes diagnostic code. This likely resulted in missing some patients who had only one visit associated with a diabetes diagnosis during the study period. Thus, our results provide conservative estimates of study clinics' diabetic populations and delivery of preventive care.
Similarly, we had insurance continuity data available for all patients in the EHR, supplemented by Medicaid enrollment data for most patients, which may have resulted in conservative estimates of insurance coverage for some of the patients. In addition, we included only 23 primary care CHCs, limiting the generalizability of the observed association. Medicare and Medicaid are the primary insurance sources for the patients at these clinics; insurance coverage may have a different association in patient populations with higher coverage by private insurance carriers. We assessed only those patient factors available in the EHR data; these do not represent all factors that contribute to a patient's health or a clinic's ability to deliver high-quality care. We recommend the development of policies that move toward the systematic collection of a more comprehensive set of patient factors in EHRs, including additional characteristics related to social determinants of health. Finally, we were unable to assess whether variation in rates of diabetes care services by clinic was a result of clinic providers not offering the services or because of patients' refusal.
Conclusion
Significant variability in quality rates may be associated with differences in clinics' patient panels. Quality measures need to acknowledge these differences and put mechanisms in place to account for them or risk creating disincentives for clinics to care for vulnerable patients.
Acknowledgments
The authors gratefully acknowledge OCHIN and the OCHIN PBRN health centers.
Appendix
Part A: Codes Used to Determine Receipt of Services
Because procedures ordered through some of the OCHIN laboratories use internal codes rather than Current Procedural Terminology codes, Current Procedural Terminology procedure codes were supplemented with the appropriate internal codes. We searched names associated with procedure codes and supplemented service data with data from the procedure titles to ensure complete capture of codes pertaining to a given service.
HbA1C codes: 83036, 83037 plus internal OCHIN codes.
LDL codes: 83721, 83718, 83719, 83721, 82465 plus internal OCHIN codes.
Microalbumin codes: 82043, 82044 plus internal OCHIN codes.
Influenza immunizations codes: 90658, 90660, 90657, 90656, 90655 plus internal OCHIN codes.
Part B: Regression Models
Linear regressions of quality metrics modeled as continuous variables were used to determine the proportions of variability in clinic performance metrics that were associated with variability in the sociodemographic characteristics of the patient panels. Because preventive service delivery rates must fall between 0% and 100%, quality metrics were logit transformed before analysis. Logit transformations (the log of proportion of services delivered/[1 − the proportion of services delivered], the link function used in logistic regressions) were used to keep the predicted values from the regressions bounded between 0 and 1 and to improve the fit of the model residuals to a normal distribution.
The regression models supporting Table 3 and Figure 3 are given in the tables below. The models illustrated in Figure 3 are listed in bold for the entire line. In all models, r2 significant at p < 0.05 are in bold. Regression results are limited to the models in the full panels and further limited to the unadjusted models for the percentage of patients with full insurance coverage; the models for the other independent variables are adjusted for the percentage of patients with full insurance.
Notes
This article was externally peer reviewed.
Funding: This study was supported by grant no. R01HL107647 from the National Heart, Lung, and Blood Institute.
Conflict of interest: none declared.
- Received for publication January 11, 2013.
- Revision received June 6, 2013.
- Accepted for publication June 10, 2013.
References
In this issue


Jump to section
Related Articles
Cited By...
- The Psychosocial Needs of Patients Participating in Diabetes Shared Medical Appointments
- The Psychosocial Needs of Patients Participating in Diabetes Shared Medical Appointments
- The Impact of Social and Clinical Complexity on Diabetes Control Measures
- The Impact of the Affordable Care Act (ACA) Medicaid Expansion on Visit Rates for Diabetes in Safety Net Health Centers
- Uninsured Primary Care Visit Disparities Under the Affordable Care Act
- Using Geographic Information Systems (GIS) to Identify Communities in Need of Health Insurance Outreach: An OCHIN Practice-based Research Network (PBRN) Report
- Family Physicians Improve Patient Health Care Quality and Outcomes