
Abstract
Purpose: The purpose of this study was to identify data available at the time of hospital admission that predict readmission risk.
Methods: We performed a retrospective multiple regression analysis of 958 adult, nonpregnant patients admitted to the Family Medicine Service between June 2012 and October 2013. Data were abstracted from hospital administrative sources and electronic medical records. The outcome was 30-day hospital readmission. Candidate readmission predictors included polypharmacy (≥6 medicines), Charlson comorbidity index, age, sex, insurance status, emergency department use, smoking, nursing report of cognitive issues, patient report of social support or financial issues, and a history of heart failure, pneumonia, or chronic obstructive pulmonary disease.
Results: Patients at the Family Medicine Service had a 14% readmission risk. Bivariate analysis showed that high Charlson scores (≥5), polypharmacy, heart failure, pneumonia, or chronic obstructive pulmonary disease each increased readmission risk (P < .05). A logistic model showed an estimated odds ratio for readmission for high Charlson scores of 1.7 (95% confidence interval, 1.1–2.6) and of 2.1 for polypharmacy (95% confidence interval, 1.3–3.7). The model yielded a readmission risk estimate of 6% if neither a high Charlson score nor polypharmacy was present, 9% if only the Charlson score was high, 12% if only polypharmacy was present, and 19% if both were present. The receiver operating characteristics curve for the 2-factor model yielded an estimated area under the curve of 85%. Cross-validation supported this result.
Conclusions: Polypharmacy and higher Charlson score at admission predict readmission risk as well as or better than published risk prediction models. The model could help to conserve limited resources and to target interventions for reducing readmission among the highest-risk patients.
Reducing hospital admissions is a priority for patients, physicians, insurers, and hospital systems, and it aligns with evolving payment reforms.1,2 Much of the attention for readmission reduction has focused on Medicare patients with specific high-cost conditions and has encouraged adherence to disease-specific guidelines.3 For example, while adherence to heart failure guidelines has clinical benefits, it has not produced consistent reductions in readmission rates.4,5 One explanation for this result is that readmissions for patients with heart failure often occur because of ≥1 comorbid condition(s) not specifically covered by the heart failure guideline.6,7 The experience with heart failure suggests that a more holistic strategy to “take care of the patient, not just the disease” may better serve patients with multiple comorbidities.8
Family physicians provide hospital care to patients of all ages with a broad range of conditions and comorbidities that may lack evidence-based practice guidelines. Only 3 interventions successfully reduced readmissions among general medical inpatients with a variety of admission diagnoses.9⇓–11 Common elements of these readmission reduction interventions included (1) facilitating patient self-care, (2) educating patients about medications and conditions, (3) assessing social issues, (4) coordinating follow-up care, and (5) providing follow-up after discharge.9⇓–11
Competing demands for resources in some health systems may rule out comprehensive readmission reduction interventions for all hospitalized patients. All the interventions that reduced readmission had expensive, dedicated personnel to make the model effective. Until payment strategies change to support this important work, it may be necessary to focus on patients with the highest risk for readmission. Since the ideal discharge process begins soon after hospital admission, it would be helpful if patients could be stratified by risk soon after admission.2 There exist only 4 readmission risk prediction models that used primary data collected in real time, but they did not predict readmission risk with great accuracy (area under the receiver operating characteristic [ROC] curve [AUC] >0.90).12⇓⇓⇓⇓⇓⇓–19 Prior analyses of readmission risks among our hospitalized patients suggested that function, comorbidities, and social determinants of health might be more predictive than administrative data such as demographics and diagnostic categories.20⇓–22 However, our review of the current literature suggests that we are still early in the process of identifying a risk model that is broadly applicable, and most factors do not seem stable across settings.
Purpose
The purpose of this study was to identify data elements that are both available at admission and associated with higher 30-day readmission risk. Two hypotheses directed our research: (1) There are individual data elements available at the time of admission that predict the 30-day readmission risk. (2) There are composite indices of individual factors that are stronger predictors of risk than the individual factors themselves. Few articles address these issues among a family medicine inpatient service population.12⇓⇓⇓⇓–17 The translational issue is finding a few strong, available readmission predictors that focus attention and resources on specific higher-risk patients at admission—several days before they are discharged. Example early predictors might be complex comorbidity, low socioeconomic status, frailty, or dementia.
Methods
The study sample was community-dwelling adult patients of the Family Medicine Center of Akron (FMC) admitted to the Family Medicine Service (FMS) at Summa Health System's Akron City Hospital from June 2012 to October 2013. We excluded FMC patients initially admitted and discharged from services such as the intensive care unit, critical care unit, or surgery, and patients admitted from or discharged to extended care facilities. Decedents were excluded from further risk on their discharge date.
The FMS is the inpatient service for patients from the FMC, a residency-based practice in an academic urban safety net hospital. A team of faculty and resident physicians provides inpatient care and hospital follow-up visits via month-long rotations. Hospital administrative data identified 958 admissions among 568 patients, with 1 to 22 admissions per patient.
The dependent variable in the analysis was a readmission within 30 days of discharge. The process of looking within each discharge-to-admission interval for a <30-day readmission was consistent with the standard (intuitive) method of counting readmissions described in a working article from America's Health Insurance Plans.23 A 30-day hospital readmission was defined as any all-cause admission to Summa Health System's Akron City Hospital within 30 days after a previous discharge. Clinical experience suggests that patient losses to other area hospitals are infrequent. Independent variables evaluated were patient age, sex, insurance status, Charlson comorbidity score,24,25 current smoking, polypharmacy (≥6 medications), self-reported social or financial issues, emergency department use in the previous 6 months, nurse-identified cognitive issues, and a previous diagnosis of heart failure, pneumonia, or chronic obstructive pulmonary disease (COPD). Psychosocial data were derived from patients' responses to closed-ended questions from the admitting nurse about housing arrangements, agency usage, medical equipment in the home, financial issues, functional status, and readmission status. Nursing assessments of cognition and depression were subjective.
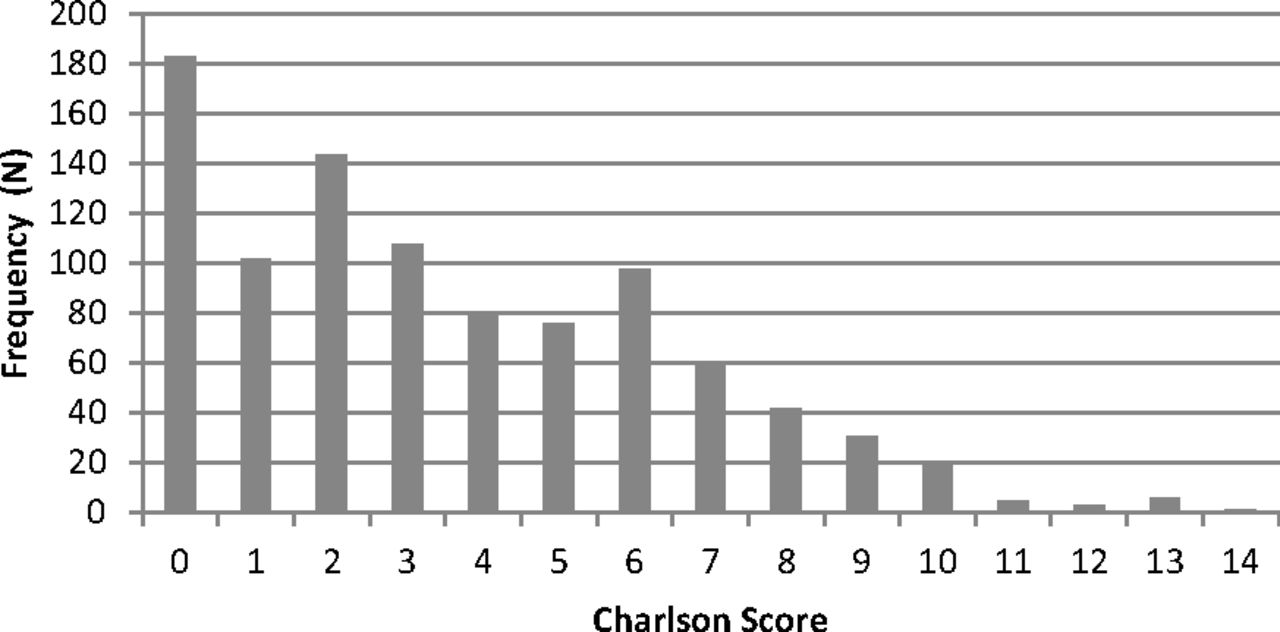
The Charlson score was calculated by the admitting physician at the time of admission. We examined Charlson score quartiles per the original article and used a high/low score (≥5/0-4) dichotomy because of its clinical appeal.24,25 The Charlson score was used because of its validity and widespread use in the health services research literature.26 There is also a mobile phone application that calculates a Charlson score (the MediMath Medical Calculator). The Charlson cut point was based on the univariate distribution of responses (Figure 1) and Charlson's use of the index.

Charlson score distribution at admission.
Before examining the readmission data, polypharmacy was defined as ≥6 home medications at the time of admission based on prior clinical experience. Eight medications was the 52nd percentile, seven medications was the 45th percentile, and six medications was the 38th percentile. A lower cut point increases the sensitivity of the “polypharmacy test,” while increasing false positives, which was acceptable since other candidate predictors were available.
The decision about the age coding was also made a priori. Exact age was recoded to 3 clinically meaningful age bands that approximated tertiles of the age distribution (19–49, 50–64, and ≥65 years). The age tertiles were treated as an ordinal variable (1, 2, or 3) in the logistic model.
Statistics included descriptive proportions, risks, odds ratios, and the AUC for the best model. Information was abstracted from hospital and primary care electronic medical records (Plato and eClinicalWorks systems) by trained quality-improvement assistants. The study was approved by the Summa Health System Institutional Review Board.
Data analysis included (1) 2-variable contingency tables to look for dominant associations; (2) random effects logistic regression modeling to reveal independent predictors while controlling for admission clustering within patients; (3) checks for statistical interaction to exclude (or include) these phenomena; (4) estimating the AUC to quantify prediction accuracy; and (5) a cross-validation analysis to assess regression model robustness given other institutional settings, admission cohorts, or time periods.
Our general analytic strategy was to look at 2-variable contingency tables (eg, “age × risk or “gender × risk” in Table 1 and “Charlson quartiles × risk” in Figure 2) for evidence of an association. We then assessed the 2-variable associations with a statistical (regression) model that considered clustering. Multiple admissions from the same patient are likely to be statistically dependent events because of persistent biopsychosocial characteristics. Clustering of admissions within patients may distort variances and bias statistical tests and confidence limits. Clustering can occur within patients, individual physicians, physician groups, or interventions. The effects can be small or large, but the implementation of adjustments for clustering increases confidence in the methods. We used generalized estimating equations and a mixed (random and fixed) effects logistic model (Proc Glimmix in SAS software version 9.2; SAS Institute, Inc., Cary, NC) to account for admission clustering within patients. Each patient was treated as a random variable, a flexible unstructured covariance matrix was assumed, and we looked at models with 1, 2, or 3 candidate predictors from the data pool (Table 1, Figure 2). We were not interested in complex explanatory models (eg, those with multiple marginal predictors and higher-order fixed- effect cross-product terms) that fit the sample's likelihood surface too closely and reduced external validity. Two independent predictors were identified. A third predictor was not. A validation analysis considered model robustness. Familiar adjusted odds ratios and risks are reported (Tables 2 and 3). Possible interaction in “odds” or synergy in “risks” was considered by adding a “polypharmacy × comorbidity” cross-product term to the model and by adding risk estimate differences in sequence (Table 3).

Readmission risk by Charlson score.
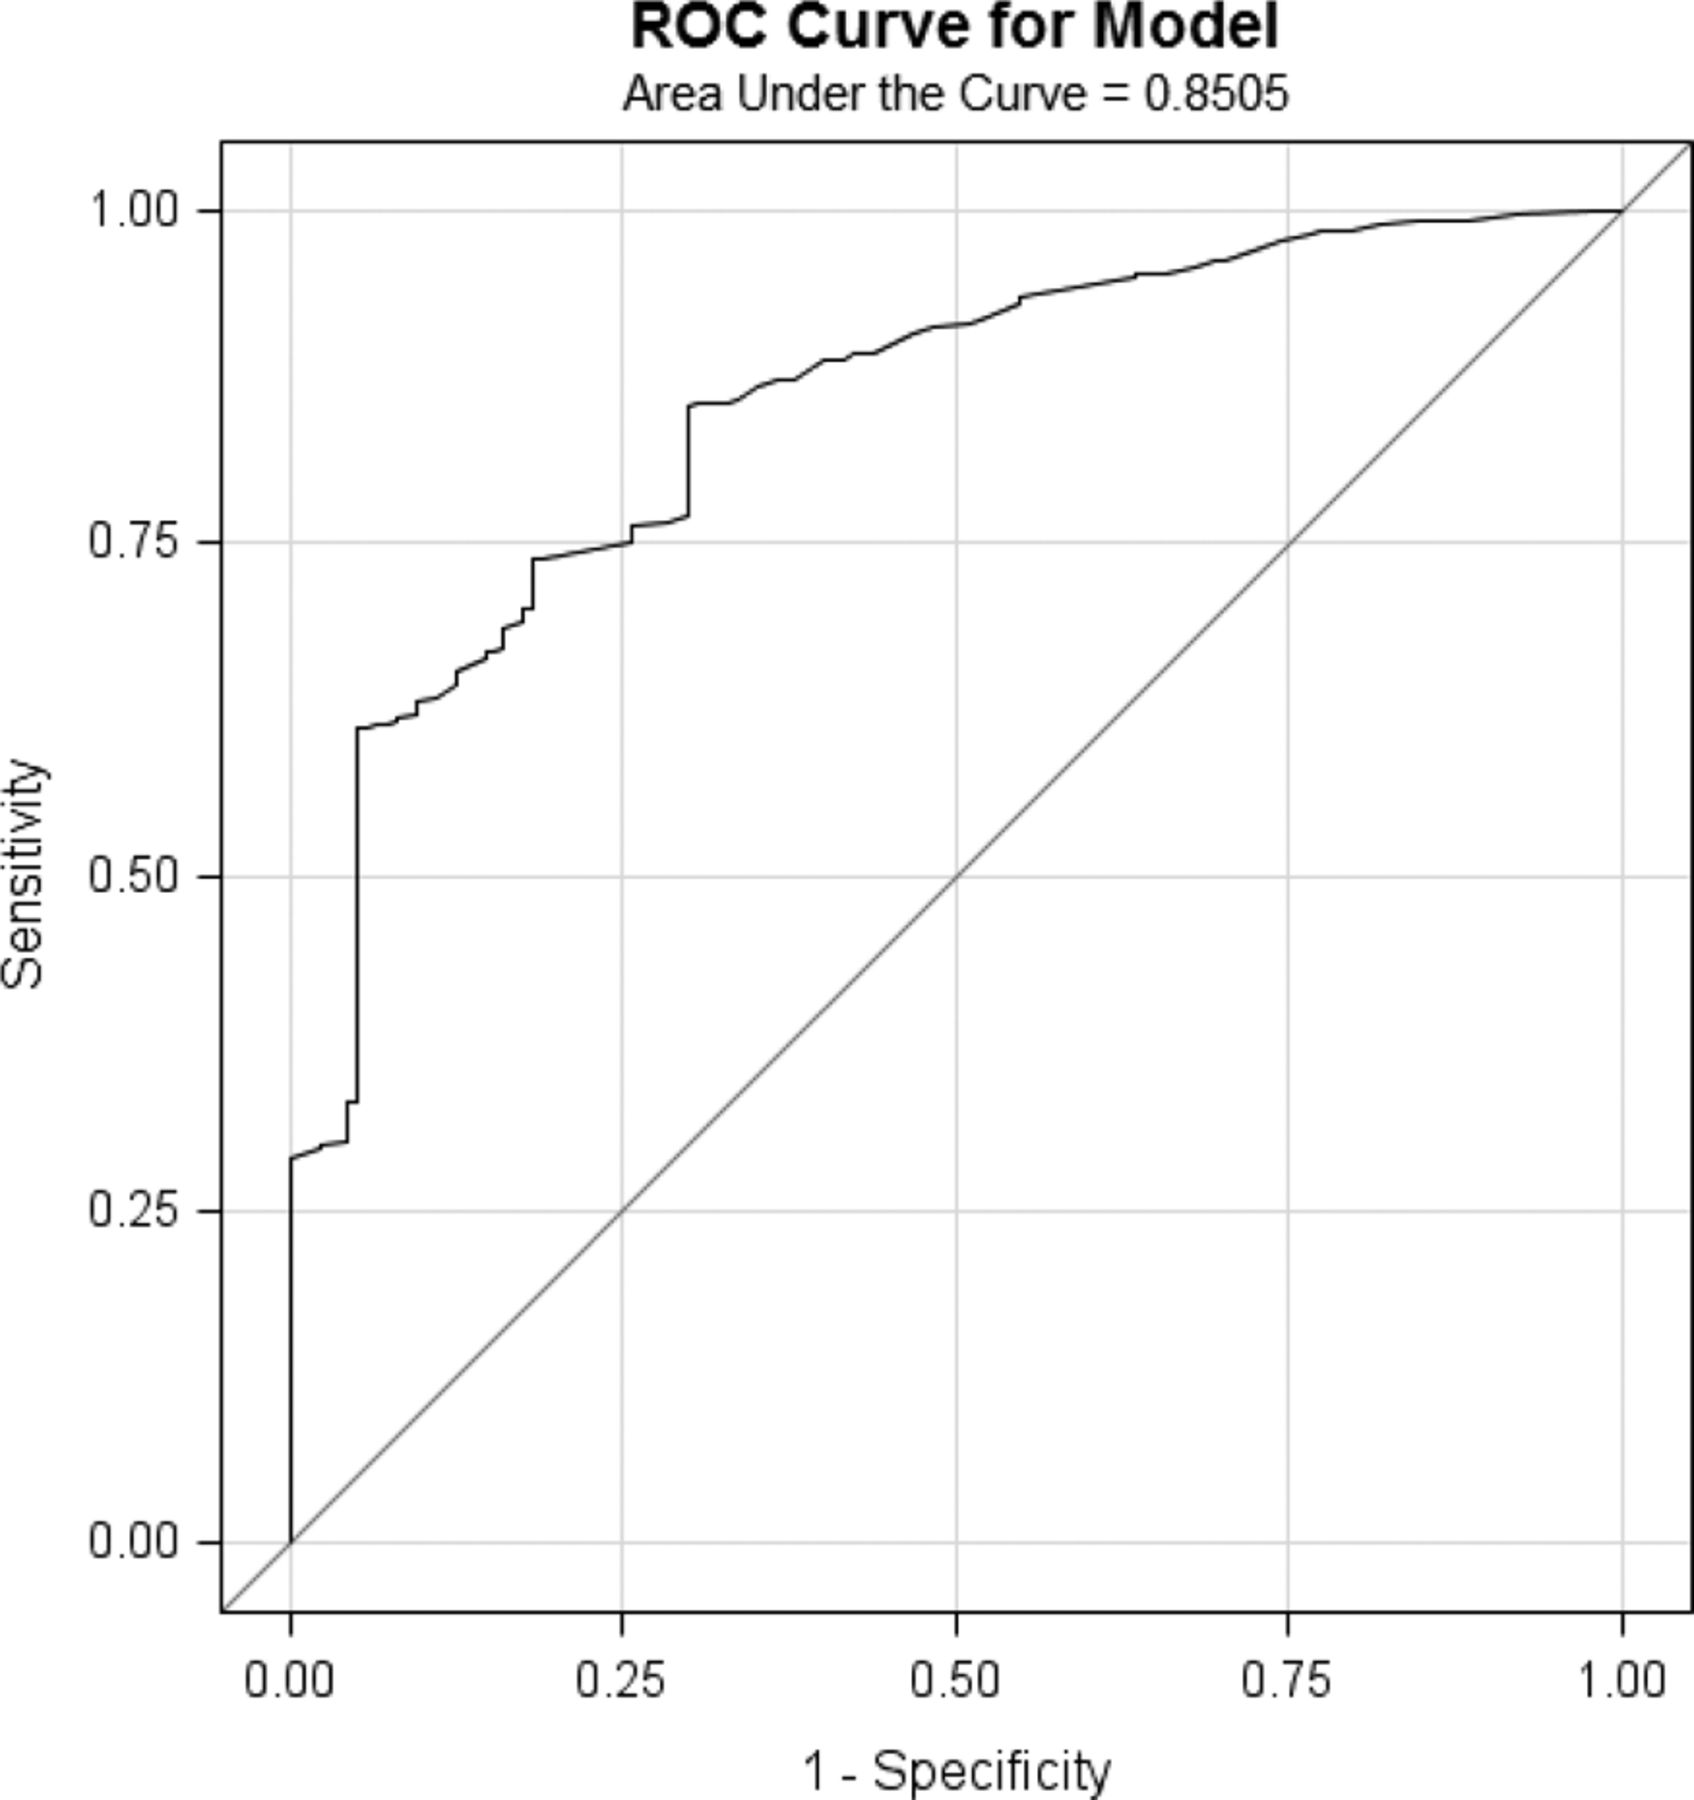
A ROC curve for the best model was produced by passing output (predicted values) from Proc Glimmix to Proc Logistic. The sensitivity and 1 − specificity of the logistic model was estimated by comparing the predicted probability of readmission with the actual probability of readmission for a variety of probability cut points. The performance of any diagnostic test can be evaluated by the sensitivity (test positive/true positive) and specificity (test negative/true negative) of the test at a given cut-point. When there are multiple cut points—say, high, medium, and low—there will be multiple estimates of sensitivity and specificity. Plots of “sensitivity” versus “1 − specificity” for each cut point form a ROC curve. The AUC ranges from 0.500 to 0.999 and describes test or model discrimination. AUC values close to 0.999 are desirable because they signify high sensitivity and specificity. We examined the AUC value for our final model.
One approach to assessing the robustness of statistical predictions is to compare models' fit to independent training and testing data sets. Test models usually perform less well because of optimistic training parameter bias. When independent training and testing data sets are not available, cross-validation or bootstrap analysis can be performed. In bootstrap analysis each observation is randomly excluded and the model is reestimated. The average bootstrap model then is contrasted with the original results. We completed bootstrap analysis (cross-validation option, Proc Logistic, SAS version 9.2) for the polypharmacy and comorbidity score model.
Results
Table 4 shows the extent of clustering in our data. Of the 958 study admissions, 68% occurred in the group of patients with a single admission, whereas 32% of the study admissions occurred in the group of patients with ≥2 admissions during the observation period. Ninety-five percent of admissions occurred in the group of patients with 1 to 4 admissions.
Table 1 has 2 purposes. The first is to show the characteristics of the study admissions. The overall 30-day readmission risk was 14.3%. The second purpose is to show unadjusted 30-day risk estimates for various admission groups and the corresponding adjusted Glimmix P value. (Proc Glimmix, SAS version 9.2). Table 1 suggests that polypharmacy or a history of heart failure, pneumonia, or COPD increases 30-day readmission risk, whereas age, sex, insurance status, prior emergency department use, smoking, cognitive issues, low social support, or financial issues do not.
Figures 1 and 2 show similar information for Charlson scores. Figure 1 shows the skewed Charlson score distribution, where most admissions have low scores. Figure 2 shows that higher Charlson scores are associated with higher 30-day readmission risks. There is a 2-fold increase in risk between those admissions with a score of ‘0’ versus admissions with a score ≥5.
Table 2 shows typical Glimmix logistic output for 2 models of 30-day readmission risk (log readmission odds = β0 + βi Xij + εj, where εj represents the random cluster effect). Model 1 includes the Charlson score (high/low) dichotomy, the polypharmacy dichotomy, and a medical history dichotomy (a positive history of heart failure, pneumonia, or COPD/no history). Model 2 drops the composite heart failure/pneumonia/COPD variable. In model 1 the composite variable has a large P value (P > .05) and a wide confidence interval that includes 1.0. No other variables in our candidate predictor pool competed well with the Charlson and polypharmacy variables. Models with Charlson score quartiles and the Charlson dichotomy were similar.
Table 3 considers the possibility of interaction between the 2 dominant predictors and readmission risk. The data show a 3-fold increase in risk between the absence of both factors (6%) and the presence of both factors (19%). However, the P value for the “polypharmacy × Charlson” cross-product term was large (P = .10) on the logistic scale, and there was little evidence of predictor synergy on a risk scale: (12% − 5.8%) + (9.6% − 5.8%) = 10% versus (19% − 5.8%), or 13.2%.
Figure 3 shows the ROC curve for the 2-factor logistic model. The AUC statistic is 0.8505. We found that the average bootstrap model performed almost as well as than the original model (AUC = 0.8470 for the bootstrap model vs AUC = 0.8505 for the original model). The performance difference between the 2 models was only apparent at the third AUC decimal place, indicating the values are clinically identical. Presumably because of our “large” sample size, the small numeric AUC difference was statistically significant (P < .0001). Nevertheless, the bootstrap analysis confirms the clinical utility of the 2-item clinical prediction model in populations like the FMS.

Charlson score and polypharmacy dichotomies predict less than 30-day readmission. The graph shows the receiver operating characteristics curve for the model. Area under the curve = 0.8505.
Discussion
Patients admitted to the FMS had an overall readmission risk of 14%. This risk is lower than the 22% readmission risk reported in a recent study of general medical admissions and the 20% risk of readmission often cited among Medicare beneficiaries.27,28 A 2014 Department of Health and Human Services care improvement report includes a 2013 national readmission estimate of 17.5%.28 The lower 30-day readmission risk for our patients may reflect the younger age of this cohort (only 28% were age 65 or older), but age alone is an inconsistent predictor for readmission. Older age did not predict readmission risk in our model or in several recent studies.18⇓⇓⇓⇓⇓⇓⇓⇓⇓⇓⇓–30 However, age did predict readmission risk in others.31,32 Prior research shows that improved transitional care and coordination of care after hospitalization are associated with lower readmission.9⇓–11 So, it is conceivable that the continuity of care and early proactive visits provided by the FMC physicians after discharge played a role in keeping readmission rates lower.
A Charlson comorbidity index score of ≥5 points and polypharmacy (≥6 medications) were independently associated with an increased risk for 30-day readmission. In addition, the risks resulting from a higher Charlson index and polypharmacy were cumulative but not synergistic (Table 3). These results support our hypotheses: that data available at the time of an FMS admission can predict 30-day readmission risk, and that a composite index of individual factors is a stronger predictor of readmission risk. Research on the role of polypharmacy is mixed; some investigators found an increased risk of readmission with polypharmacy,33,34 whereas others found no relationship between polypharmacy and readmission risk.35,36
Several studies have found that a higher Charlson score was associated with higher readmission risk.12,30,37,38 The Charlson index predicts long-term mortality, with a weighted combination of admission (or discharge) diagnostic codes in a positive nonlinear manner.24,25 Thus the Charlson index has been used in other studies to reduce confounding bias by illness severity so that administrative cohorts of patients can be compared on other factors such as costs. This statistical adjustment is successful because Charlson scores measure illness severity, which in turn is related to a variety of adverse health phenomena, including hospitalization risk. The tautological relationship between illness severity, hospitalization risk, and mortality risk does not negate the practical utility of using the Charlson index in a readmission context.
A case-control study of readmission risk for community-dwelling patients admitted to a family medicine inpatient service found that prior admissions, prior emergency department visits, longer hospital stays, medical comorbidities, and a large number of medications at discharge predicted 30-day readmission in bivariate analysis.39 The logistic model found that only prior admissions and longer stays predicted increased readmission risk. The case-control design, the decision to study only the first admission, and that study's method for studying comorbidity differed from our design and may explain why our results differ from those of that study. In addition, those authors did not propose or test the predictive value of their readmission risk factors.
A very large Israeli prospective cohort study of 30-day readmissions tested 76 predictive factors for readmission risk.40 Using regression trees and logistic models, it found that 11 variables, including chronic conditions, prior health services use, body mass index, and geographic location weakly predicted increased readmission risk (odds ratios <2.00). Those results differ from ours in that they did not indicate increased risk from polypharmacy and Charlson scores, and the study's 11-factor model was less predictive than our 2-item model.
We note that low social support and financial issues were not significant predictors of readmission for our patient population. However, the percentage of patients who self-reported these concerns was low (Table 1). This finding may indicate a documentation problem since they were based on patient self-report. In a prior analysis of FMS readmissions over 5 years, the single best predictor of readmission was discharge “not to home,” typically an extended care facility (ECF), which could be interpreted as a measure of dependency or frailty.21 In this study we excluded the small number of patients admitted from an ECF because their outcomes may be different and their care outside the hospital is coordinated by ECF personnel, not by the FMS.
The 0.85 AUC statistic for our 2-variable logistic model shows that it performs better than other, more complex models described in the literature.41 Other risk factors previously associated with increased risks of readmission, such as prior ED use or psychosocial issues, did not improve the predictive value of these 2 variables in our family medicine sample.19,42 The majority of the models designed for either academic or clinical purposes offer moderate predictive value under ideal circumstances but perform poorly in routine circumstances.41 There is no dominant predictive model with a high (≈0.90) AUC statistic. The LACE index, calculated at discharge, uses length of stay, Charlson score, acuity of illness, and emergency department admission to predict early death and readmission.19 When applied to a general medical inpatient population in Ontario, Canada, the LACE index had an AUC statistic of 0.68.19 The LACE index did not perform well when applied to older patients in the United Kingdom.43
Accurately predicting high risk for readmission with a simple tool is important because clinicians are not accurate predictors of unplanned readmission.16 A prediction tool that is independent of the discharge diagnosis is useful for a general medical population because the majority of such patients are not admitted for the high-cost conditions that are the focus of current readmission reduction initiatives. Moreover, our 2-variable model can be implemented by any clinical provider with access to pharmacy and comorbidity data at the time of admission. A patient's medication list is already evaluated at admission, and the Charlson index can be calculated after the patient's medical history has been obtained.
Together, the pharmacy and Charlson data place a patient in 1 of 4 risk cells (high-high, low-low, low-high, high-low). Using the current model, we found that 27% of 958 admissions were low risk (no polypharmacy and low Charlson score), 42% were intermediate risk (polypharmacy [37%] or high Charlson [5%]), and 30% were high risk (both polypharmacy and high Charlson score). Pilot data collected at our institution showed that readmission risk can be reduced when a pharmacist performs an inpatient consultation, educates the patient to improve adherence, participates in follow-up visits after discharge, and collaborates with inpatient and outpatient physicians, behavioral health consultants, and social workers (S. Fosnight, personal communication). Resource limitations might preclude such an intervention for all medical inpatients; however, resources might be targeted to patients for whom the return on the investment might be greatest.
Limitations and Strengths
Our study limitations are those inherent to a retrospective cohort with routinely recorded clinical and administrative data. Replication in an independent family medicine cohort is needed. However, the cross-validation analysis supports the robustness of our findings. The statistical control for admission clustering should also control for prior admissions during defined periods. Measurement errors, confounding, and/or patient selection problems could have biased our results. For example, candidate psychosocial predictors (eg, financial issues, social stressors, or cognitive impairment) were recorded by nursing personnel following a partially standardized clinical assessment with unknown measurement properties. Patients who were “lost to follow-up” in the community or at another facility may differ from those retained. Finally, patients who were readmitted may differ from patients who were not readmitted in a variety of unknown ways.
Since our data represent an analysis of routinely collected clinical data from 1 inpatient service of a single, midsized community hospital, it is unknown whether our model could be helpful in other general medical inpatient populations. The cross-validation analysis suggests that the model will be useful. The FMS only admits patients from the family medicine patient panel, so the source of patients is not a potential predictor. Transitional care planning is done by the FMS team using a standard checklist to minimize variation. Statistical peculiarities of our data set may still limit generalizations to other settings that have their own unique features. However, a prior study suggests that the FMC population, which generated the FMS cohort, is generally representative of primary care patients across the country.44
A sample of 1000 admissions among 500 patients may be too small to uncover weak predictors of readmission among some mixed groups of FMS patients. However, weak predictors would be less useful clinically. Prior readmission studies have looked at millions of Medicare admissions. These huge study sizes allow for very fine-grained analysis. Low variability within the sample with regard to candidate predictors can reduce the possibility of finding associations with 30-day risk of readmission.
A strength of this study is that the pharmacy and Charlson data, and most of the other candidate predictors (age, sex, insurance status, prior emergency department use), were not subject to recall bias. In addition, directionality is not a concern because we know that the candidate predictors were documented before the readmissions occurred. Finally, the clustering of admissions within patients was considered by using mixed regression models.
Conclusion
We show that 2 risk factors—polypharmacy and high Charlson index score—predict 30-day readmission as well or better than more complex models. The AUC statistic for the 2 predictors was 85%, which is as large as or larger than other readmission risk models in the literature. Moreover, any clinical provider with information about drugs and diagnoses at admission can identify patients with a high readmission risk at the time of admission and begin interventions to reduce readmissions and control costs.
Acknowledgments
The authors acknowledge Patricia Dudley, BA; Ashley Hendrock, BS; Noor Ramahi, BS; and Betsy Barefoot, BA, who extracted and entered data. Maggie Factor provided invaluable administrative support.
Notes
This article was externally peer reviewed.
Funding: Financial support for this study was provided the Department of Family Medicine, Summa Health System, Akron, OH.
Conflict of interest: none declared.
- Received for publication April 15, 2015.
- Revision received September 28, 2015.
- Accepted for publication October 1, 2015.
References
In this issue


Jump to section
Related Articles
Cited By...
- Predictors of readmission and mortality in adults with diabetes or stress hyperglycemia after initial hospitalization for COVID-19
- Use of electronic medical records in development and validation of risk prediction models of hospital readmission: systematic review
- Modelling care quality for patients after a transient ischaemic attack within the US Veterans Health Administration
- Predictors of 30-day hospital readmission: The direct comparison of number of discharge medications to the HOSPITAL score and LACE index
- Are Patients Frequently Readmitted to the Hospital Different from the Other Admitted Patients?
- Family Medicine Research That Provides Compelling, Urgent Data to Improve Patient Care