
Article Figures & Data
Figures
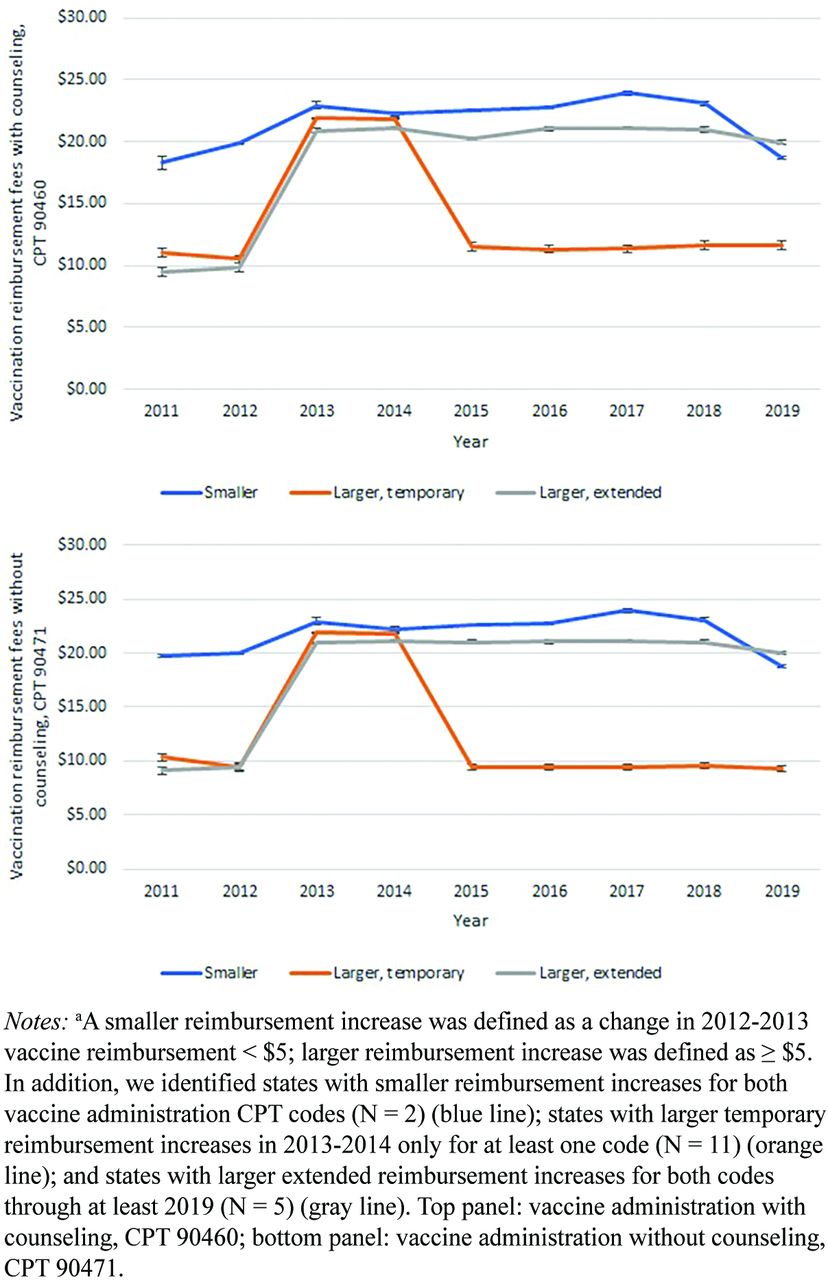
- Figure 1.
Medicaid vaccination administration reimbursements by reimbursement size change and return to baseline reimbursement for Medicaid insured participants.a Abbreviation: CPT, current procedural terminology.
- Figure 2.
Unadjusted trends in influenza vaccination completion by magnitude and duration of reimbursement increase for patients with Medicaid.a Abbreviation: CPT, current procedural terminology.
- Appendix Figure 1.
US map with included and excluded states from the study analysis. Abbreviation: CPT, current procedural terminology.
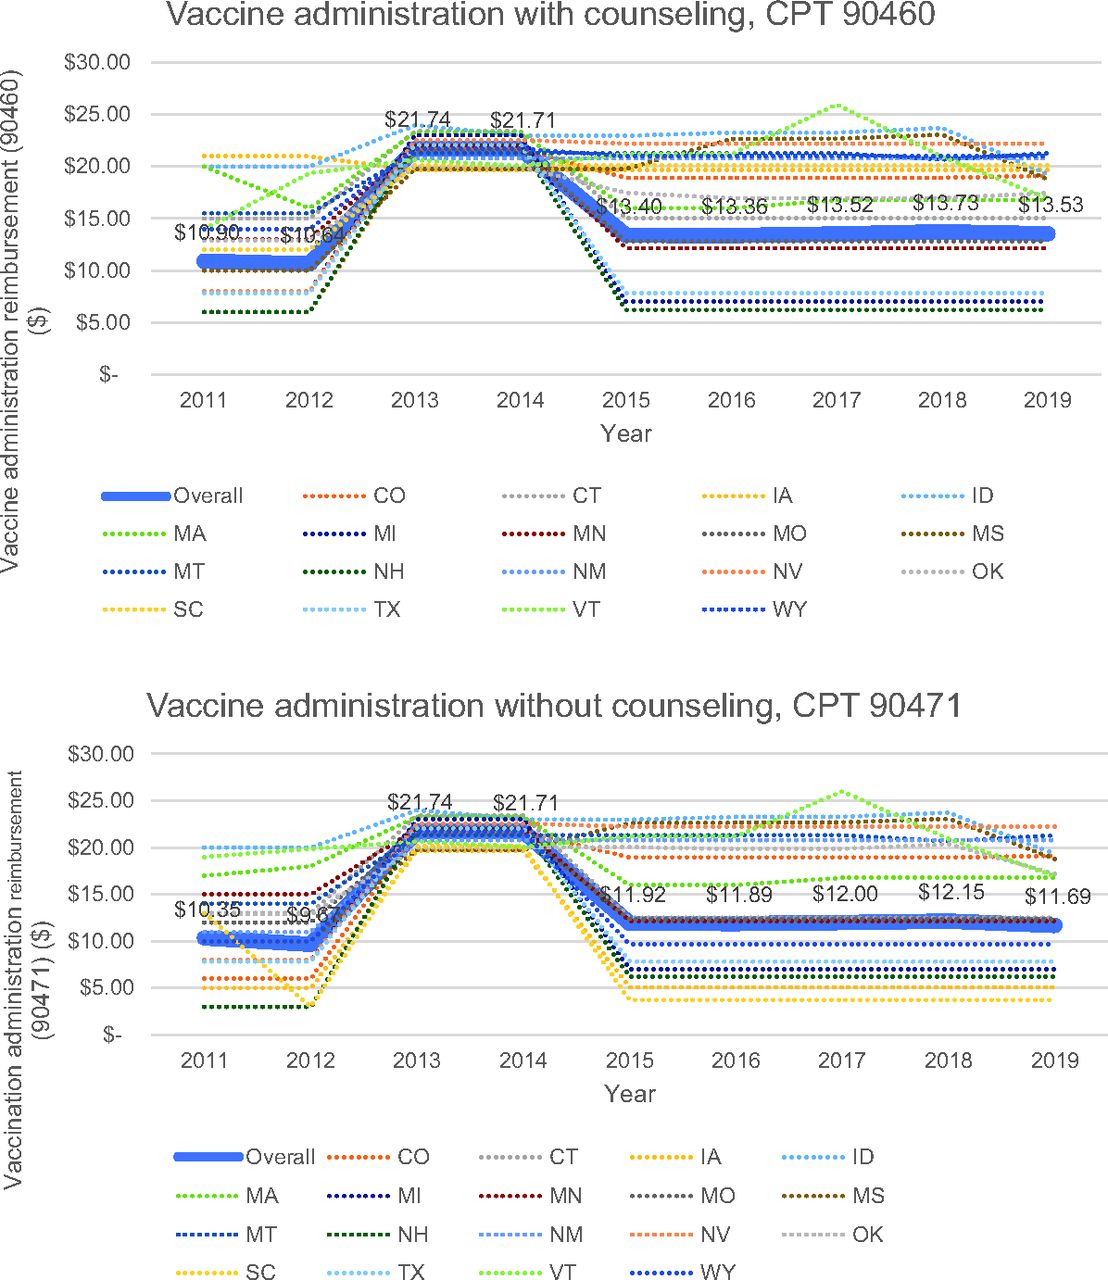
- Appendix Figure 2.
Medicaid vaccination administration reimbursements by year overall and by state for Medicaid insured participants.
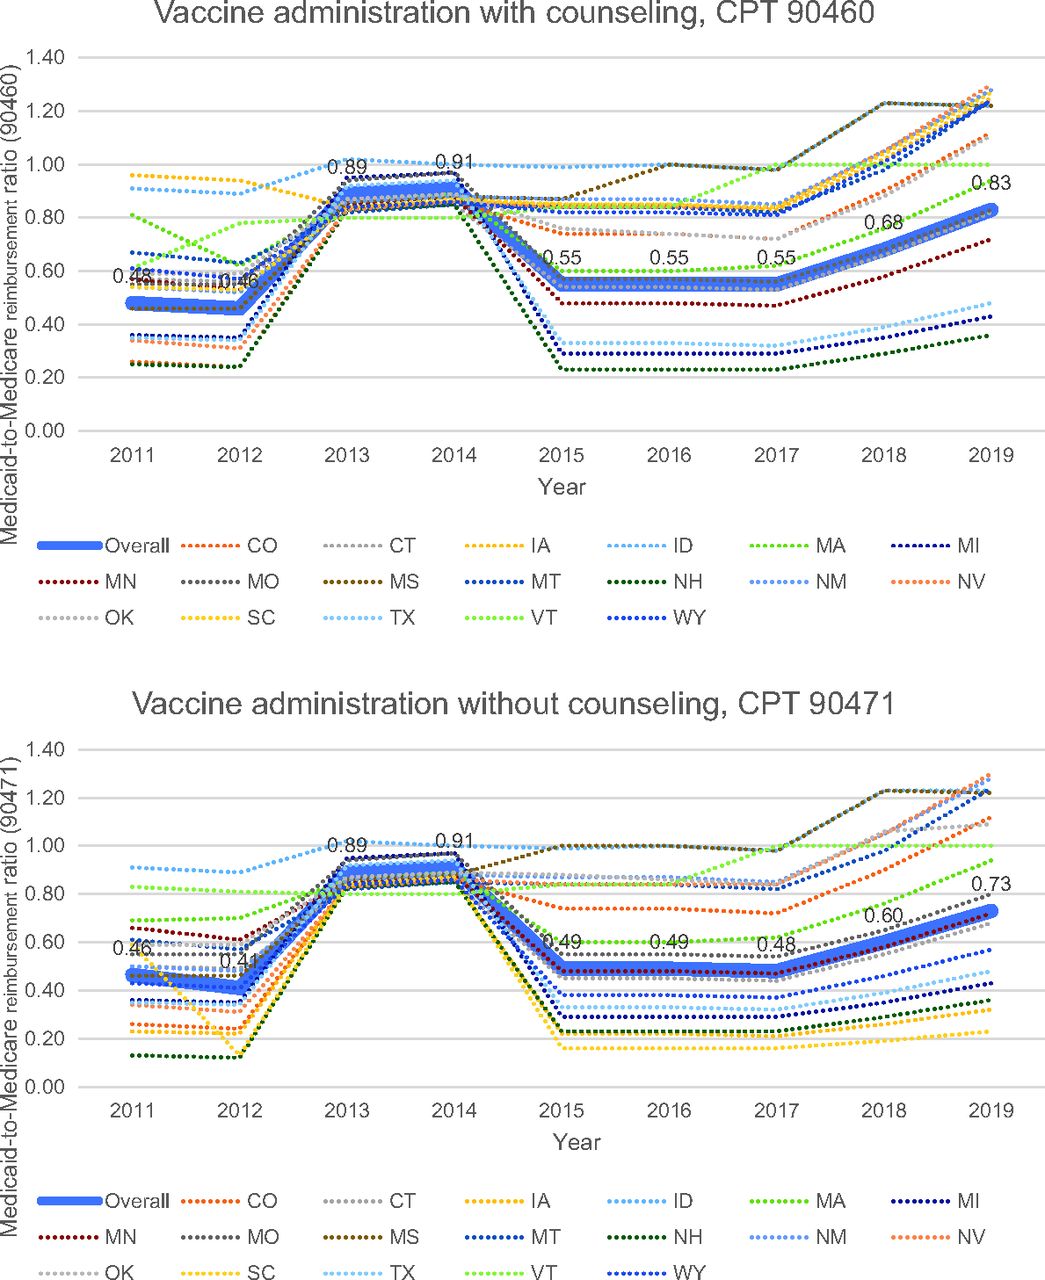
- Appendix Figure 3.
Medicaid-to-Medicare vaccination reimbursement ratios by year overall for Medicaid insured participants.
- Appendix Figure 4.
Medicaid vaccination administration reimbursements by reimbursement size change and return to baseline reimbursement for Medicaid insured participants—by CPT code. Abbreviation: CPT, current procedural terminology.
- Appendix Figure 5.
Medicaid vaccination administration reimbursements overall and by state for Medicaid insured participants – by CPT code. Abbreviation: CPT, current procedural terminology.
- Appendix Figure 6.
Unadjusted trends in influenza vaccination completion by year overall and by state for Medicaid insured participants. Abbreviation: CPT, current procedural terminology.
- Appendix Figure 7.
Unadjusted trends in influenza vaccination completion by reimbursement size change and return to baseline reimbursement for patients with Medicaid – by CPT code. Abbreviation: CPT, current procedural terminology.


Tables
- Table 1.
Characteristics of Adolescents with Medicaid Coverage in 2011 and 2019—National Immunization Survey–Teen
Year 2011 2019 N 1,641 2,121 N (weighted %) N (weighted %) Age 13 391 (24.9) 482 (22.1) 14 335 (17.0) 464 (22.2) 15 339 (23.9) 430 (21.1) 16 320 (19.3) 413 (18.8) 17 256 (14.8) 332 (15.9) Sex Male 796 (49.3) 1,124 (52.0) Female 845 (50.7) 997 (48.0) Race White, non-Hispanic 653 (34.9) 962 (37.3) Black, non-Hispanic 291 (24.6) 182 (18.2) Hispanic 536 (30.7) 767 (37.0) Other, non-Hispanic 161 (9.8) 210 (7.6) Poverty status Above poverty 701 (35.3) 1,119 (48.8) Below poverty 873 (60.2) 897 (43.4) Missing 67 (4.5) 105 (7.8) Mother’s age ≤34 295 (22.5) 299 (15.9) 35 to 44 809 (51.6) 1,136 (54.8) ≥45 537 (25.9) 686 (29.3) Mother’s marital status Married 809 (40.0) 970 (38.7) Not married 832 (60.0) 1,151 (61.3) Number of visits to doctors in a previous yeara None 233 (15.4) 259 (13.9) 1 375 (23.3) 499 (25.9) 2+ 1,012 (61.3) 1,332 (60.1) Vaccination providers facility type Private 563 (34.0) 801 (41.7) Public 425 (27.6) 446 (20.9) Hospital 130 (7.6) 260 (10.2) STD/School/Teen clinic/other 59 (3.8) 42 (2.4) Mixed 330 (18.8) 434 (16.5) Missing 134 (8.2) 138 (8.3) Medicaid Expansion status Not expanded NA 1,162 (60.0) Expanded NA 959 (40.0) Mean state Medicaid managed care penetration rate (SD) 53.0% (33.3%) 71.4% (38.8%) Notes. aSum does not equal sample size because of missing (n = 1,620 for 2011, n = 2,090 for 2019).
Abbreviation: SD, standard deviation.
- Table 2.
Difference-in-Difference Estimates of the Association Between Medicaid Reimbursement Change and Duration and Influenza Vaccination Ratesa
Coeff (95% CI) Differences by state group at baseline Smaller reimbursement change states (ref) Larger temporary reimbursement change states −3.5 (−9.1, 2.1) Larger extended reimbursement change states −6.7 (−12.5, −0.8)* Differences by time period Before (2011 to 2012) (ref) During (2013 to 2014) −2.7 (−9.0, 3.6) After (2015 to 2019) −2.8 (−9.0, 3.4) Difference-in-Difference estimates Temporary reimbursement change versus smaller change in 2013 to 2014 versus 2011 to 2012 3.0 (−3.8, 9.8) Temporary reimbursement change versus smaller change in 2015 to 2019 versus 2011 to 2012 3.3 (−3.4, 10.0) Larger extended reimbursement change versus smaller change in 2013 to 2014 versus 2011 to 2012 1.8 (−5.3, 8.9) Larger extended reimbursement change versus smaller change in 2015 to 2019 versus 2011 to 2012 2.9 (−4.2, 10.0) Notes. aModels adjusted for age (continuous), sex, race/ethnicity, poverty status, mother’s age, mother’s marital status, type of vaccination facility, number of doctor visits in the past year, Medicaid managed care penetration rates (continuous), and state expansion status. Estimates were also weighted using sampling weights and include individual-level random effects. *P < .05.
Abbreviation: CI, confidence interval.
- Appendix Table 1.
Unweighted and Unadjusted Influenza Vaccination Completion by Year by Adequate Provider Data Definitiona
Year Unweighted % (95% CI) (unadjusted adequate provider data definition) Unweighted % (95% CI) (adjusted adequate provider data definition) 2011 21.1 (19.7, 22.6) 20.8 (19.4, 22.3) 2012 24.9 (23.5, 26.4) 24.8 (23.4, 26.3) 2013 23.9 (22.6, 25.2) 23.9 (22.6, 25.2) 2014 23.3 (22.1, 24.5) 23.3 (22.1, 24.5) 2015 22.3 (21.2, 23.5) 22.3 (21.2, 23.5) 2016 23.5 (21.9, 25.1) 23.5 (21.9, 25.1) 2017 25.2 (23.4, 27.1) 25.2 (23.4, 27.1) 2018 26.8 (25.5, 28.2) 26.8 (25.5, 28.2) 2019 28.0 (26.1, 29.9) 28.0 (26.1, 29.9) Notes. aUnadjusted adequate provider data definition means calculation of unadjusted vaccination rates were based on original 2011-2013 definition of adolescents having adequate provider data in the NIS-Teen for those years. Adjusted adequate provider data definition means calculation of unadjusted vaccination rates were based on adjusted definition of adolescents having adequate provider data in 2011-2013, as per new definition proposed in 2014 and after; therefore, only vaccination rates for 2011-2013 should differ between unadjusted and adjusted adequate provider definitions (grayed rows).
Abbreviation: CI, confidence interval.
- Appendix Table 2.
Vaccine Administration Reimbursement Comparison Chart for 2013-2014 (for CPT Code 90460)
VFC Regional Maximum(Updated Nov 2012)a Medicare Reimbursement Schedule 2013 Medicare Reimbursement Schedule 2014 State US$ US$ US$ Vaccine Administration Reimbursement Level (VFC versus Medicare)b CO 21.68 25.89 25.22 VFC CT 23.41 28.25 27.47 VFC IA 19.68 23.44 22.88 VFC ID 20.13 23.66 22.98 Medicare MA 23.29 27.09 26.25 VFC MI 23.03 24.36 23.63 VFC MN 21.22 25.85 25.12 VFC/Medicare MO 21.53 22.93 22.28 VFC MS 19.79 23.13 22.45 VFC MT 21.32 25.89 25.14 VFC NH 22.02 26.68 25.98 VFC NM 20.80 24.20 23.58 VFC NV 22.57 27.08 26.15 VFC OK 19.58 22.93 22.47 VFC/Medicare SC 20.16 23.90 23.28 VFC TX 22.06 24.06 23.45 VFC VT 21.22 25.86 25.05 VFC WY 21.72 25.94 25.16 VFC/Medicare ↵Notes. aPer Table 1 in Centers for Medicare & Medicaid Final rule.19
↵b Information obtained from Medicaid State Plan Amendment (SPA), attachment 4.19-B for each state accessed at medicaid.gov/medicaid/medicaid-state-plan-amendments. For reimbursement frequency, a state could have chosen to adjust its reimbursement schedule to make payment as the service was provided (FFS) or reimbursed a supplemental amount equal to the difference between the Medicaid rate in effect on July 1, 2009 and the minimum payment required either a monthly or quarterly interval. For vaccine administration reimbursement method, a state could have opted to reimburse at the VFC regional maximum or the Medicare reimbursement level.
Abbreviation: CPT, current procedural terminology.
- Appendix Table 3.
Characteristics of 2011 NIS-Teen Medicaid Insured Participants in States Included Versus Excluded from the Analysis Due to Lack of Reliable Vaccine Administration Reimbursement Data from Medicaid MAX Filesa
Year 2011 2019 Enrollees in States with Reliable Reimbursement Data (included) Enrollees in States with Unreliable Reimbursement Data (excluded) Enrollees in States with Reliable Reimbursement Data (included) Enrollees in States with Unreliable Reimbursement Data (excluded) 1,641 2,955 2,121 3,245 N (Weighted %) N (Weighted %) N (Weighted %) N (Weighted %) Age 13 391 (24.9) 653 (20.2) 482 (22.1) 721 (20.3) 14 335 (17.0) 626 (21.4) 464 (22.2) 715 (23.6) 15 339 (23.9) 583 (20.1) 430 (21.1) 654 (20.2) 16 320 (19.3) 585 (21.4) 413 (18.8) 610 (16.4) 17 256 (14.8) 508 (16.9) 332 (15.9) 545 (19.6) Sex Male 796 (49.3) 1,548 (50.8) 1,124 (52.0) 1,772 (52.4) Female 845 (50.7) 1,407 (49.2) 997 (48.0) 1,473 (47.6) Race White, non-Hispanic 653 (34.9) 1,319 (38.0) 962 (37.3) 1,418 (31.9) Black, non-Hispanic 291 (24.6) 747 (25.9) 182 (18.2) 497 (21.7) Hispanic 536 (30.7) 558 (27.1) 767 (37.0) 873 (36.2) Other, non-Hispanic 161 (9.8) 331 (9.0) 210 (7.6) 457 (10.2) Poverty status Above poverty 701 (35.3) 1,386 (40.8) 1,119 (48.8) 1,743 (48.1) Below poverty 873 (60.2) 1,425 (54.0) 897 (43.4) 1,346 (44.3) Missing 67 (4.5) 144 (5.2) 105 (7.8) 156 (7.6) Mother’s age ≤34 295 (22.5) 521 (20.1) 299 (15.9) 471 (14.7) 35 to 44 809 (51.6) 1,438 (51.2) 1,136 (54.8) 1,722 (55.7) ≥45 537 (25.9) 996 (28.7) 686 (29.3) 1,052 (29.7) Mother’s marital status Married 809 (40.0) 1,338 (42.7) 970 (38.7) 1,428 (39.2) Not married 832 (60.0) 1,617 (57.3) 1,151 (61.3) 1,817 (60.8) Number of visits to doctors in a previous year None 233 (15.4) 374 (14.2) 259 (13.9) 399 (16.5) 1 375 (23.3) 707 (24.6) 499 (25.9) 844 (29.1) 2+ 1,012 (61.3) 1,842 (61.2) 1,332 (60.1) 1,949 (54.4) Vaccination providers facility type Private 563 (34.0) 1,121 (43.2) 801 (41.7) 1,174 (39.0) Public 425 (27.6) 683 (22.4) 446 (20.9) 726 (22.5) Hospital 130 (7.6) 337 (10.1) 260 (10.2) 453 (10.0) STD/School/Teen clinic/other 59 (3.8) 91 (3.0) 42 (2.4) 70 (1.8) Mixed 330 (18.8) 484 (15.2) 434 (16.5) 588 (17.2) Missing 134 (8.2) 239 (6.0) 138 (8.3) 234 (9.5) Medicaid Expansion status Not expanded NA NA 1,162 (60.0) 779 (27.6) Expanded NA NA 959 (40.0) 2,466 (72.4) Mean state Medicaid managed care penetration rate (SD) 53.0% (33.3%) 60.7% (31.0%) 71.4% (38.8%) 82.1% (21.4%) Notes. aThere were missing responses for number of visits to doctors in the past year.
Abbreviations: STD, sexually transmitted disease; SD, standard deviation.
- Appendix Table 4.
Vaccine Administration Reimbursement Change Magnitude and Duration for Each CPT Code
2011 Medicaid Reimbursement 2012 Medicaid Reimbursement 2013 Medicaid Reimbursement 2014 Medicaid Reimbursement 2015 Medicaid Reimbursement 2016 Medicaid Reimbursement 2017 Medicaid Reimbursement 2018 Medicaid Reimbursement 2019 Medicaid Reimbursement State US$ US$ US$ US$ US$ US$ US$ US$ US$ 2022 Medicaid Reimbursement Reimbursement Change Category (% Change)j Temporary (2013-2014) Versus Extended (2013-2015) Reimbursement Changej a) Vaccine administration with counseling, CPT Code 90460c CO 6.00a 6.00a 21.68d 21.68d 18.93b 18.93b 18.93 18.93 19.12 19.75 Large Extended CT 15.00a 15.00a 23.41d 23.41d 15.05 15.05 15.05 15.05 15.05 15.05 Large Temporary IA 21.00a 21.00a 19.68d 19.68d 19.68 19.68 19.68 19.68 19.68 19.68 Smaller NA ID 20.00h 20.00a 24.00d 23.00d 22.98 23.28 23.28 23.73 19.23 19.29 Smaller NA MA 20.00a 16.00a 23.29d 23.29d 16.00 16.00 16.78 16.78b 16.78b 17.70 Large Temporary MI 8.00a 8.00a 23.03d 23.03d 7.00 7.00 7.00 7.00 7.00 7.00 Large Temporary MN 13.00a 13.00a 22.00d 22.00d 12.15 12.15 12.15 12.15 12.15 12.15 Large Temporary MO 12.00a 12.00a 21.53d 21.53d 12.84e 12.84f 12.84f 12.84f 12.84f 13.73 Large Temporary MS 10.00a 10.00a 19.79d 19.79d 19.79 22.67 22.70 23.08 18.78 12.98 Large Extended MT 15.52 15.52 21.32d 21.32d 21.32 21.32 21.32 20.68 21.32 21.32 Large Extended NH 6.00a 6.00a 22.02d 22.02d 6.20e 6.20f 6.20f 6.20f 6.20f 6.39 Large Temporary NM 12.00a 12.00a 20.80a 20.80a 20.80 20.80 20.80 20.80 20.80 20.80 Large Extended NV 8.00a 8.00a 22.57a 22.57a 22.22 22.22 22.22 22.22 22.22 22.22 Large Extended OK 12.90 12.90 20.00d 20.00d 17.48 16.96 16.96 16.96 17.47 18.34g Large Temporary SC 12.00a 12.00a 20.16a 20.16a 20.16 20.16 20.16 20.16 20.16 20.16 Large Extended TX 7.84 7.84 22.06d 22.06d 7.84 7.84 7.84 7.84 7.84 7.84 Large Temporary VT 14.00 19.39 20.65 20.08 21.21 21.21 25.99 20.94 16.95 13.87 Smaller NA WY 14.00a 14.00a 21.72d 21.72d 21.00b 21.00b 21.00 21.00 21.00 20.48 Large Extendedd b) Vaccine administration without counseling, CPT Code 90471c CO 6.00a 6.00a 21.68d 21.68d 18.93b 18.93b 18.93 18.93 19.12 19.75 Larger Extended CT 13.00a 13.00a 23.41d 23.41d 12.52 12.52 12.52 12.52 12.52 12.52 Larger Temporary IA 5.00a 5.00a 19.68d 19.68d 5.09 5.09 5.09 5.09 5.09 5.09 Larger Temporary ID 20.00h 20.00a 24.00d 23.00d 22.98 23.28 23.28 23.73 19.29 19.29 Smaller NA MA 17.00a 18.00a 23.29d 23.29d 16.00 16.00 16.78 16.78b 16.78b 17.70 Larger Temporary MI 8.00a 8.00a 23.03d 23.03d 7.00 7.00 7.00 7.00 7.00 7.00 Larger Temporary MN 15.00a 15.00a 22.00d 22.00d 12.15 12.15 12.15 12.15 12.15 12.15 Larger Temporary MO 12.00a 12.00a 21.53d 21.53d 12.34e 12.34f 12.34f 12.34f 12.34f 13.21 Larger Temporary MS 10.00a 10.00a 19.79d 19.79d 22.6 22.67 22.7 23.08 18.78 12.98 Larger Extended MT 14.00a 14.00a 21.32d 21.32d 21.32 21.32 21.32 20.68 21.32 21.32 Larger Extended NH 3.00a 3.00a 22.02d 22.02d 6.20e 6.20f 6.20f 6.20f 6.20f 5.32 Larger Temporary NM 11.00a 11.00a 20.80d 20.80d 20.80 20.80 20.80 20.80 20.80 20.80 Larger Extended NV 8.00a 8.00a 22.57d 22.57d 22.22 22.22 22.22 22.22 22.22 22.22 Larger Extended OK 12.90 12.90 20.00d 20.00d 20.05 19.83 19.86 20.36 17.2 12.62g Larger Extended SC 13.00a 3.00a 20.16d 20.16d 3.72 3.72 3.72 3.72 3.72 3.72 Larger Temporary TX 7.84 7.84 22.06d 22.06d 7.84 7.84 7.84 7.84 7.84 7.84 Larger Temporary VT 19.00 19.86 20.65 20.08 21.21 21.21 25.99 20.94 16.95 13.87 Smaller NA WY 10.00a 10.00a 21.72d 21.72d 9.67i 9.67i 9.67i 9.67 9.67 16.94 Larger Temporary ↵Notes. areimbursement values obtained from the modal reimbursement value for CPT code 90460 and 90471 for each state from Medicaid Analytic eXtract (MAX) Other Services File.
↵b imputed values from year 2017 Medicaid state reimbursement schedule.
↵c unless otherwise specified, reimbursements were obtained from Medicaid state reimbursement schedules.
↵d source was the CMS Final rule.19
↵e 2015 American Academy of Pediatrics Survey.
↵f imputed from year 2015 Medicaid state reimbursement schedule.
↵g imputed from year 2023 (data not shown) Medicaid state reimbursement schedule.
↵h imputed values from year 2012 Medicaid state reimbursement schedule.
i imputed values from year 2018 Medicaid state reimbursement schedule.
↵j A smaller reimbursement increase was defined as a change in 2012-2013 vaccine reimbursement < $5; larger reimbursement increase was defined as ≥ $5. In addition, we identified states with larger reimbursements are either temporary (if the higher reimbursements only lasted through 2014) or extended (if the higher reimbursements lasted beyond 2015).
Abbreviation: CPT, current procedural terminology.
- Appendix Table 5.
Vaccine Administration Reimbursement Change Magnitude and Duration for Both Vaccine Administration CPT Codesa
State Reimbursement Change Size and Duration Category CO Larger extended CT Larger temporary IA Larger temporary ID Smaller MA Larger temporary MI Larger temporary MN Larger temporary MO Larger temporary MS Larger extended MT Larger extended NH Larger temporary NM Larger extended NV Larger extended OK Larger temporary SC Larger temporary TX Larger temporary VT Smaller WY Larger temporary Notes. aAn unified reimbursement change category and reimbursement duration was a compiled from information for CPT codes 90460 and 90471 (see Appendix Table 4). We stratified states with smaller reimbursement increases for both CPT codes as smaller reimbursement change states. States with larger increases that extended the reimbursement bump into 2019 for both CPT codes were classified as larger extended reimbursement states. All other states were categorized as temporary reimbursement states.
- Appendix Table 6.
Full Model Results: Difference-in-Difference Estimates of the Association Between Medicaid Reimbursement Change and Duration and Influenza Vaccination Rates – Unified CPT Categorizationa
Coeff (95% CI) Diff-in-Diff Estimate (pct pts) Differences by state group at baseline Smaller reimbursement change states (ref) Larger temporary reimbursement change states −3.5 (−9.1, 2.1) Larger extended reimbursement change states −6.7 (−12.5, −0.8) Differences by time period Before (2011 to 2012) (ref) During (2013 to 2014) −2.7 (−9.0, 3.6) After (2015 to 2019) −2.8 (−9.0, 3.4) Difference-in-Difference estimates Larger temporary reimbursement change versus smaller change in 2013 to 2014 versus 2011 to 2012 3.0 (−3.8, 9.8) Larger temporary reimbursement change versus smaller change in 2015 to 2019 versus 2011 to 2012 3.3 (−3.4, 10.0) Larger extended reimbursement change versus smaller change in 2013 to 2014 versus 2011 to 2012 1.8 (−5.3, 8.9) Larger extended reimbursement change versus smaller change in 2015 to 2019 versus 2011 to 2012 2.9 (−4.2, 10.0) Age (years) −1.5 (−2.1, −0.8) Sex Male (ref) Female 0.6 (−1.2, 2.5) Race White, non-Hispanic (ref) Black, non-Hispanic 1.0 (−1.8, 3.8) Hispanic 3.8 (1.5, 6.1) Other, non-Hispanic/multi-race 5.0 (1.8, 8.1) Poverty status Above poverty (ref) Below poverty −0.1 (−2.1, 1.9) Missing −1.2 (−5.8, 3.4) Mother’s age ≤34 (ref) 35 to 44 −0.1 (−2.8, 2.5) ≥45 2.3 (−0.6, 5.2) Mother’s marital status Married (ref) Not married −3.9 (−5.8, −2.0) Number of visits to doctors in a previous year None (ref) 1 3.1 (−0.4, 5.8) 2+ 9.4 (7.0, 11.8) Facility type for teen’s vaccination providers All private (ref) All public −6.1 (−8.5, −3.8) All hospital −2.2 (−5.6, 1.2) All STD/School/Teen clinic/other −4.6 (−11.1, 1.9) Mixed −0.1 (−2.6, 2.5) Missing −3.8 (−7.4, −0.2) Medicaid Expansion status Not expanded (ref) Expanded 5.5 (3.4, 7.6) Managed Care penetration rate −3.3 (−5.7, −0.9) ↵Notes. a Adjusted multivariable regression model also includes adjustment for Medicaid vaccination reimbursements (in US$), state fixed effects for states with reliable data (CO, CT, IA, ID, MA, MI, MN, MO, MS, MT, NH, NM, NV, OK, SC, TX, VT, WY). Medicaid Managed Care penetration rates for children in comprehensive Medicaid plans in states with reliable data were obtained from Medicaid and CHIP Payment and Access Commission (MACPAC) reports.30 Medicaid expansion status was determined by whether a state expanded Medicaid in each year between 2014-2019. The models also included state fixed effects (dummy variable for each state) and a random effect at the person level.
Abbreviations: STD, sexually transmitted disease; CI, confidence interval; CPT, current procedural terminology.
- Appendix Table 7.
Difference-in-Difference Estimates of the Association Between Medicaid Reimbursement Change and Duration and Influenza Vaccination Rates – Sensitivity Analyses by CPT Codea
Coeff (95% CI) Vaccine Admin with Counseling, CPT 90,460 Coeff (95% CI) Vaccine Admin without Counseling, CPT 90,471 Diff-in-Diff Estimate (pct pts) Diff-in-Diff Estimate (pct pts) Differences by state group at baseline Smaller reimbursement change states (ref) (ref) Larger temporary reimbursement change states 2.3 (−2.4, 7.0) −2.6 (−8.3, 3.1) Larger extended reimbursement change states −2.0 (−6.7, 2.7) −5.8 (−11.5, −0.2) Differences by time period Before (2011 to 2012) (ref) (ref) During (2013 to 2014) −4.2 (−9.3, 0.9) −2.6 (−8.9, 3.7) After (2015) −0.9 (−5.9, 4.1) −2.7 (−8.9, 3.5) Difference-in-Difference estimates Larger temporary reimbursement change versus smaller change in 2013 to 2014 versus 2011 to 2012 4.6 (−1.2, 10.3) 2.7 (−4.1, 9.5) Larger temporary reimbursement change versus smaller change in 2015 versus 2011 to 2012 1.1 (−4.6, 6.8) 3.4 (−3.4, 10.2) Larger extended reimbursement change versus smaller change in 2013 to 2014 versus 2011 to 2012 4.7 (−1.0, 10.5) 3.6 (−3.4, 10.5) Larger extended reimbursement change versus smaller change in 2015 versus 2011 to 2012 2.8 (−2.9, 8.6) 3.6 (−3.3, 10.5) Age (years) −1.5 (−2.1, −0.8) −1.5 (−2.1, −0.8) Sex Male (ref) (ref) Female 0.6 (−1.2, 2.5) 0.6 (−1.2, 2.5) Race White, non-Hispanic (ref) (ref) Black, non-Hispanic 0.9 (−1.9, 3.7) 0.9 (−1.9, 3.6) Hispanic 3.2 (0.9, 5.5) 3.7 (1.4, 5.9) Other, non-Hispanic/multi-race 4.5 (1.4, 7.6) 5.1 (2.0, 8.3) Poverty status Above poverty (ref) (ref) Below poverty −0.1 (−2.1, 1.9) −0.2 (−2.1, 1.8) Missing −1.3 (−5.9, 3.3) −1.2 (−5.8, 3.4) Mother’s age ≤34 (ref) (ref) 35 to 44 −0.05 (−2.7, 2.6) −0.1 (−2.7, 2.5) ≥45 2.4 (−0.5, 5.3) 2.3 (−0.6, 5.2) Mother’s marital status Married (ref) (ref) Not married −3.9 (−5.9, −2.0) −3.9 (−5.9, −2.0) Number of visits to doctors in a previous year None (ref) (ref) 1 3.1 (0.4, 5.8) 3.1 (0.4, 5.8) 2+ 9.5 (7.1, 11.9) 9.4 (7.0, 11.8) Facility type for teen’s vaccination providers All private (ref) (ref) All public −6.1 (−8.5, −3.8) −6.2 (−8.5, −3.8) All hospital −2.0 (−5.4, 1.4) −2.1 (−5.5, 1.3) All STD/School/Teen clinic/other −4.7 (−11.1, 1.7) −4.6 (−11.1, 1.8) Mixed 0.02 (−2.6, 2.6) −0.02 (−2.6, 2.6) Missing −3.9 (−7.4, −0.3) −3.8 (−7.4, −0.2) Medicaid Expansion status Not expanded (ref) (ref) Expanded 5.1 (3.0, 7.1) 4.8 (2.8, 6.9) Managed Care penetration rate −4.0 (−6.3, −1.7) −4.3 (−6.8, −1.7) ↵a Adjusted multivariable regression model also includes adjustment for Medicaid vaccination reimbursements (in US$), state fixed effects for states with reliable data (CO, CT, IA, ID, MA, MI, MN, MO, MS, MT, NH, NM, NV, OK, SC, TX, VT, WY). Medicaid Managed Care penetration rates for children in comprehensive Medicaid plans in states with reliable data were obtained from Medicaid and CHIP Payment and Access Commission (MACPAC) reports.30 Medicaid expansion status was determined by whether a state expanded Medicaid in each year between 2014 and 2019. The models also included state fixed effects (dummy variable for each state) and a random effect at the person level.
Abbreviations: STD, sexually transmitted disease; CI, confidence interval; CPT, current procedural terminology.
- Appendix Table 8.
Sensitivity Analysis of Difference-in-Difference Estimates of the Association between Medicaid Reimbursement Change and Duration and Influenza Vaccination Rates – Excluded 2012 from Pre-Policy Time Perioda
Coeff (95% CI) Differences by state group at baseline Smaller reimbursement change states (ref) Larger temporary reimbursement change states −1.8 (−8.9, 5.1) Larger extended reimbursement change states −4.9 (−12.2, 2.5) Differences by time period Before (2011 to 2012) (ref) During (2013 to 2014) −4.3 (−12.7, 4.0) After (2015 to 2019) −9.1 (−18.1, −0.2) Difference-in-Difference estimates Larger temporary reimbursement change versus smaller change in 2013 to 2014 versus 2011 to 2012 1.3 (−7.2, 9.8) Larger temporary reimbursement change versus smaller change in 2015 to 2019 versus 2011 to 2012 2.1 (−6.0, 10.1) Larger extended reimbursement change versus smaller change in 2013 to 2014 versus 2011 to 2012 −0.2 (−9.1, 8.8) Larger extended reimbursement change versus smaller change in 2015 to 2019 versus 2011 to 2012 1.4 (−7.1, 9.9) aModels adjusted for age (continuous), sex, race/ethnicity, poverty status, mother’s age, mother’s marital status, type of vaccination facility, number of doctor visits in the past year, Medicaid managed care penetration rates (continuous), and state expansion status. Estimates were also weighted using sampling weights and include individual-level random effects.
Abbreviation: CI, confidence interval.
- Appendix Table 9.
Multivariable Association Between Changes in Medicaid Reimbursements for Vaccine Administration and Receipt of Influenza Vaccinationa
Coeff (95% CI) Vaccine Admin with Counseling, CPT 90460 (pct points) Coeff (95% CI) Vaccine Admin without Counseling, CPT 90471 (pct points) Medicaid reimbursement ($1 increase) 0.1 (−0.1, 0.3) 0.05 (−0.1, 0.2) Age (years) −1.5 (−2.1, −0.8) −1.5 (−2.1, −0.8) Year (observation year) 1.0 (0.4, 1.5) 0.9 (0.3, 1.5) Sex Male (ref) (ref) Female 0.5 (−1.3, 2.4) 0.5 (−1.3, 2.4) Race White (ref) (ref) Black, non-Hispanic 2.0 (−0.9, 4.9) 2.0 (−0.8, 4.9) Hispanic 3.5 (1.0, 6.0) 3.5 (1.0, 6.1) Other, non-Hispanic/multi-race 4.6 (1.4, 7.7) 4.6 (1.4, 7.7) Poverty status Above poverty (ref) (ref) Below poverty 0.4 (−1.6, 2.4) 0.4 (−1.6, 2.4) Missing −1.1 (−5.6, 3.5) −1.1 (−5.6, 3.5) Mother’s age ≤34 (ref) (ref) 35 to 44 −0.08 (−2.7, 2.6) −0.08 (−2.7, 2.6) ≥45 2.0 (−0.9, 4.9) 2.1 (−0.8, 5.0) Mother’s marital status Married (ref) (ref) Not married −4.0 (−6.0, −2.1) −4.0 (−6.0, −2.1) Number of visits to doctors in a previous year None (ref) (ref) 1 2.8 (0.2, 5.5) 2.9 (0.2, 5.5) 2+ 9.4 (7.1, 11.8) 9.4 (7.1, 11.8) Facility type for teen’s vaccination providers All private (ref) (ref) All public −5.9 (−8.3, −3.6) −5.9 (−8.2, −3.6) All hospital −2.5 (−5.9, 1.0) −2.5 (−5.9, 1.0) All STD/School/Teen clinic/other −4.5 (−11.2, 1.7) −4.8 (−11.2, 1.7) Mixed 0.5 (−2.1, 3.1) 0.5 (−2.1, 3.1) Missing −3.9 (−7.5, −0.3) −3.9 (−7.5, −0.3) Medicaid Expansion status Not expanded (ref) (ref) Expanded −1.5 (−5.3, 2.4) −1.4 (−5.2, 2.5) Managed Care penetration rate −1.9 (−6.9, 3.1) −1.2 (−6.1, 3.7) ↵a Adjusted multivariable regression model also includes adjustment for Medicaid vaccination reimbursements (in US$), state fixed effects for states with reliable data (CO, CT, IA, ID, MA, MI, MN, MO, MS, MT, NH, NM, NV, OK, SC, TX, VT, WY). Medicaid Managed Care penetration rates for children in comprehensive Medicaid plans in states with reliable data were obtained from Medicaid and CHIP Payment and Access Commission (MACPAC) reports.30 Medicaid expansion status was determined by whether a state expanded Medicaid in each year between 2014-2019. The models also included a random effect at the person level.
Abbreviations: STD, sexually transmitted disease; CI, confidence interval; CPT, current procedural terminology.


